632
Inherent Biases in Reference-based Evaluation for
Grammatical Error Correction and Text Simplification
Leshem Choshen1and Omri Abend2
1School of Computer Science and Engineering,2Department of Cognitive Sciences
The Hebrew University of Jerusalem
[email protected], [email protected]
Abstract
The prevalent use of too few references for evaluating text-to-text generation is known to bias estimates of their quality (hence-forth,low coverage biasor LCB). This pa-per shows that overcoming LCB in Gram-matical Error Correction (GEC) evaluation cannot be attained by re-scaling or by in-creasing the number of references in any feasible range, contrary to previous sug-gestions. This is due to the long-tailed distribution of valid corrections for a sen-tence. Concretely, we show that LCB in-centivizes GEC systems to avoid correct-ing even when they can generate a valid correction. Consequently, existing sys-tems obtain comparable or superior per-formance compared to humans, by mak-ing few but targeted changes to the input. Similar effects on Text Simplification fur-ther support our claims.
1 Introduction
Evaluation in monolingual translation (Xu et al.,
2015; Mani, 2009) and in particular in GEC (Tetreault and Chodorow, 2008; Madnani et al.,
2011;Felice and Briscoe, 2015; Bryant and Ng,
2015; Napoles et al., 2015) has gained notori-ety for its difficulty, due in part to the hetero-geneity and size of the space of valid corrections (Chodorow et al.,2012;Dreyer and Marcu,2012). Reference-based evaluation measures (RBM) are the common practice in GEC, including the stan-dard M2 (Dahlmeier and Ng, 2012), GLEU (Napoles et al., 2015) and I-measure (Felice and Briscoe,2015).
The Low Coverage Bias (LCB) was previously discussed byBryant and Ng(2015), who showed that inter-annotator agreement in producing
ref-erences is low, and concluded that RBMs under-estimate the performance of GEC systems. To address this, they proposed a new measure, Ra-tio Scoring, which re-scales M2 by the inter-annotator agreement (i.e., the score of a human corrector), interpreted as an upper bound.
We claim that the LCB has more far-reaching implications than previously discussed. First, while we agree with Bryant and Ng (2015) that a human correction should receive a perfect score, we show that LCB does not merely scale system performance by a constant factor, but rather that some correction policies are less prone to be bi-ased against. Concretely, we show that by only correcting closed class errors, where few possible corrections are valid, systems can outperform hu-mans. Indeed, in Section 2.3we show that some existing systems outperform humans on M2 and GLEU, while only applying few changes to the source.
We thus argue that the development of GEC sys-tems against low coverage RBMs disincentivizes systems from making changes to the source in cases where there are plentiful valid corrections (open class errors), as necessarily only some of them are covered by the reference set. To support our claim we show that (1) existing GEC systems under-correct, often performing an order of mag-nitude less corrections than a human does (§3.2); (2) increasing the number of references alleviates under-correction (§3.3); and (3) under-correction is more pronounced in error types that are more varied in their valid corrections (§3.4).
A different approach for addressing LCB was taken by (Bryant and Ng,2015;Sakaguchi et al.,
for a sentence and their long-tailed distribution. Indeed, even short sentences have over 1000 valid corrections on average. Empirically assessing the effect of increasingM on the bias, we find dimin-ishing returns using three standard GEC measures (M2, accuracy and GLEU), underscoring the dif-ficulty in this approach.
Similar trends are found when conducting such experiments to Text Simplification (TS) (§4). Specifically we show that (1) the distribution of valid simplifications for a given sentence is long-tailed; (2) common measures for TS dramatically under-estimate performance; (3) additional refer-ences alleviate this under-prediction.
To recap, we find that the LCB hinders the relia-bility of RBMs for GEC, and incentivizes systems developed to optimize these measures not to cor-rect. LCB cannot be overcome by re-scaling or increasingM in any feasible range.
2 Coverage in RBMs
We begin by formulating a methodology for study-ing the distribution of valid corrections for a sen-tence (§2.1), and then turn to assessing the ef-fect inadequate coverage has on common RBMs (§2.2). Finally, we compare human and system scores by common RBMs (§2.3).
Notation. We assume each ungrammatical sen-tence x has a set of valid corrections Correctx, and a discrete distribution Dx over them, where
PDx(y)fory ∈Correctxis the probability a hu-man annotator would correctxasy.
Let X = x1. . . xN be the evaluated set of source sentences and denoteDi := Dxi. Eachxi is independently sampled from some distribution
Lover input sentences, and is paired withM cor-rectionsYi =
yi1, . . . , yiM , which are indepen-dently sampled fromDi. Our analysis assumes a fixed number of references across sentences, but generalizing to sentence-dependentM is straight-forward. Thecoverageof a reference setYiof size
M for a sentencexiis defined asPy∼Di(y∈Yi). A system Cis a function from input sentences to proposed corrections (strings). An evaluation measure is a functionf:X ×Y ×C → R. We use the term “true measure” to refer to a measure’s output where the reference set includes all valid corrections, i.e.,∀i:Yi =Correcti.
Experimental Setup. We conduct all experi-ments on the NUCLE test dataset (Dahlmeier
et al., 2013). NUCLE is a parallel corpus of es-says written by language learners and their cor-rected versions, containing 1414 essays and 50 test essays, each of about 500 words.
We evaluate all participating systems in the CoNLL 2014 shared task, in addition to three of the best performing systems on this dataset, a hybrid system (Rozovskaya and Roth, 2016), a phrase-based MT system (Junczys-Dowmunt and Grundkiewicz,2016) and a neural network system (Xie et al.,2016). AppendixAlists system names and abbreviations.
2.1 Estimating the Corrections Distribution
Data. We turn to estimating the number of cor-rections per sentence, and their histogram. The ex-periments in the following section are run on a ran-dom sample of 52 short sentences from the NU-CLE test data, i.e. with 15 words or less. Through the length restriction, we avoid introducing too many independent errors that may drastically in-crease the number of annotation variants (as every combination of corrections for these errors is pos-sible), thus resulting in unreliable estimation for
Dx.
Proven effective in GEC and related tasks such as MT (Zaidan and Callison-Burch, 2011; Mad-nani et al.,2011;Post et al.,2012), we use crowd-sourcing to sample from Dx (see Appendix B). Aiming to judge grammaticality rather than flu-ency, we instructed the workers to correct only when necessary, not for styling. We begin by es-timating the histogram of Dx for each sentence, using the crowdsourced corrections. We use UN -SEENEST(Zou et al.,2016), a non-parametric al-gorithm to estimate a discrete distribution in which the individual values do not matter, only their probability. UNSEENEST aims to minimize the “earthmover distance”, between the estimated his-togram and the hishis-togram of the distribution. Intu-itively, if histograms are piles of dirt, UNSEEN -EST minimizes the amount of dirt moved times the distance it moved. UNSEENESTwas originally developed and tested for estimating the histogram of variants a gene may have, including undiscov-ered ones, a setting similar to ours. Our manual tests of UNSEENESTwith small artificially created datasets showed satisfactory results.1
1An implementation of U
Our estimates show that most input sentences have a large number of infrequent corrections that account for much of the probability mass and a rather small number of frequent corrections. Ta-ble 1presents the mean number of different cor-rections with frequency at least γ (for different
γs), and their total probability mass. For instance, 74.34 corrections account for 75% of the probabil-ity mass, each occurring with frequency≥0.1%.
Frequency Threshold (γ) 0 0.001 0.01 0.1 Variants 1351.24 74.34 8.72 1.35
[image:3.595.95.270.206.249.2]Mass 1 0.75 0.58 0.37
Table 1: Estimating the distribution of correctionsDx. The table presents the mean number of corrections per sentence with probability more thanγ(top row), as well as their total probability mass (bottom row).
The high number of rare corrections raises the question of whether these can be regarded as noise. To test this we conducted another crowd-sourcing experiment, where 3 annotators were asked to judge whether a correction produced in the first experiment, is indeed valid. We plot the validity of corrections against their frequencies, finding that frequency has little effect, where even the rarest corrections are judged valid 78% of the time. Details in AppendixC.
2.2 Under-estimation as a Function ofM
After estimating the histogram of valid corrections for a sentence, we turn to estimating the result-ing bias (LCB), for differentM values. We study sentence-level accuracy,F-Score and GLEU.
Sentence-level Accuracy. Sentence-level accu-racy is the percentage of corrections that exactly match one of the references. Accuracy is a ba-sic, interpretable measure, used in GEC by, e.g.,
Rozovskaya and Roth (2010). It is also closely related to the 0-1 loss function commonly used for training in GEC (Chodorow et al., 2012; Ro-zovskaya and Roth,2013).
Formally, given test sentences X =
{x1, . . . , xN}, their references Y1, . . . , YN and a systemC, we defineC’s accuracy to be
Acc(C;X, Y) = 1
N N
X
i=1
1C(xi)∈Yi. (1)
Note that C’s accuracy is, in fact, an estimate ofC’strue accuracy, the probability to produce a valid correction for a sentence. Formally:
T rueAcc(C) =Px∼L(C(x)∈Correctx). (2)
The bias of Acc(C;X, Y) for a sample of N
sentences, each paired withM references is then
T rueAcc(C)−EX,Y[Acc(C;X, Y)] = (3) T rueAcc(C)−P(C(x)∈Y) = (4)
P(C(x)∈Correctx)· (5)
(1−P(C(x)∈Y|C(x)∈Correctx)) (6)
We observe that the bias, denotedbM, is not af-fected by N, only by M. As M grows,Y better approximatesCorrectx, andbM tends to 0.
In order to abstract away from the idiosyn-crasies of specific systems, we consider an ideal-ized learner, which, when correct, produces a valid correction with the same distribution as a human annotator (i.e., according toDx). Formally, we as-sume that, ifC(x) ∈CorrectxthenC(x) ∼ Dx. Hence the biasbM (Eq.6) can be re-written as
P(C(x)∈Correctx)·(1−PY∼DM
x,y∼Dx(y∈Y)).
We will henceforth assume that C is perfect (i.e., its true accuracyis 1). Note that assuming any other value forC’strue accuracywould sim-ply scalebM by that accuracy. Similarly, assuming only a fractionp of the sentences require correc-tion scalesbM byp.
We estimatebM empirically using its empirical mean on our experimental corpus:
ˆbM = 1− 1
N N
X
i=1
PY∼DM
i ,y∼Di(y∈Y).
Using the UNSEENEST estimations of Di, we can computeˆbM for any size ofYi(M). However, as this is highly computationally demanding, we estimate it using sampling. Specifically, for every
M = 1, ...,20 andxi, we sampleYi 1000 times (with replacement), and estimateP(y ∈Yi)as the covered probability massPDi{y:y∈Yi}. Based on that we compute the accuracy distribution and expectation (see AppendixD).
We repeated all our experiments where Yi is sampled without replacement, and find similar trends with a faster increase in accuracy reaching over0.47withM = 10.
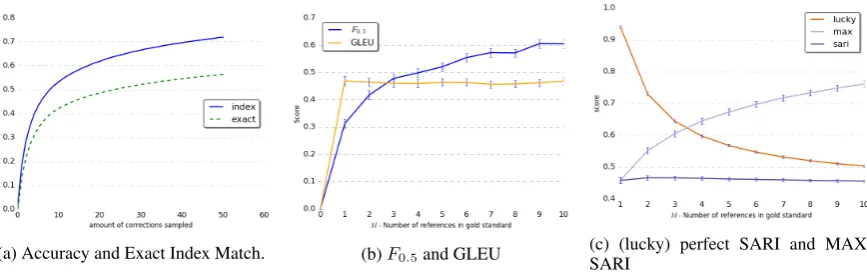
(a) Accuracy and Exact Index Match. (b)F0.5and GLEU (c) (lucky) perfect SARI and
[image:4.595.83.517.63.199.2]MAX-SARI
Figure 1: The score obtained by perfect systems according to GEC accuracy (1a), GEC F-score and GLEU (1b). Figure1c reports TS experimental results, namely the score of a perfect and lucky perfect system using SARI, and a perfect system using MAX-SARI. The y-axis corresponds to the measure values, and the x-axis to the number of referencesM. For bootstrapping experiments points are paired with a confidence interval (p=.95).
accuracy is only around 0.5. AsM increases, the contribution of each additional correction dimin-ishes sharply (the slope is 0.004 forM = 20).
We also experiment with a more relaxed mea-sure, Exact Index Match, which is only sensitive to the identity of the changed words and not to what they were changed to. Formally, two correc-tionscandc0over a source sentencexmatch if for their word alignments with the source (computed as above)a:{1, ...,|x|} → {1, ...,|c|, N ull}and
a0 :{1, ...,|x|} → {1, ...,|c0|, N ull}, it holds that
ca(i) 6= xi ⇔ c0a0(i) 6= xi, wherecN ull = c0N ull. Results, while somewhat higher, are still only 0.54 withM = 10. (Figure1a)
F-Score. While accuracy is commonly used as a loss function for training GEC systems,Fα-score is standard for evaluating system performance. The score is computed in terms ofeditoverlap be-tween edits that constitute a correction and ones that constitute a reference, where edits are sub-string replacements to the source. We use the stan-dardM2scorer (Dahlmeier and Ng,2012), which defines edits optimistically, maximizing over all possible annotations that generate the correction from the source. Since our crowdsourced correc-tions are not annotated for edits, we produce edits to the reference heuristically.
The complexity of the measure prohibits an an-alytic approach (Yeh,2000). We instead use boot-strapping to estimate the bias incurred by not be-ing able to exhaustively enumerate the set of valid corrections. As with accuracy, in order to avoid confounding our results with system-specific bi-ases, we assume the evaluated system is perfect and sample its corrections from the human distri-bution of correctionsDx.
Concretely, given a value forM and forN, we uniformly sample from our experimental corpus source sentences x1, ..., xN, and M corrections for each Y1, ..., YN (with replacement). Setting a realistic value for N in our experiments is im-portant for obtaining comparable results to those obtained on the NUCLE corpus (see §2.3), as the expected value ofF-score depends onN and the number of sentences that do not need correction (Ncor). Following the statistics of NUCLE’s test set, we setN = 1312andNcor = 136.
Bootstrapping is carried out by the accelerated bootstrap procedure (Efron,1987), with 1000 iter-ations. We also report confidence intervals (p = .95), computed using the same procedure.
Results (Figure1b) again show the insufficiency of commonly-usedM values for reliably estimat-ing system performance. For instance, the F0.5 -score for our perfect system is only 0.42 with
M = 2. The saturation effect, observed for ac-curacy, is even more pronounced in this setting.
GLEU. We repeat the procedure using the mean GLEU sentence score (Figure 1b), which was shown to better correlate with human judgments thanM2 (Napoles et al.,2016). Results are about
2%higher thanM2’s with a similar saturation ef-fect.Sakaguchi et al.(2016) observed a similar ef-fect when evaluating against fluency-oriented ref-erences; this has led them to assume that saturation is due to covering most of the probability mass, which we now show is not the case.2
2
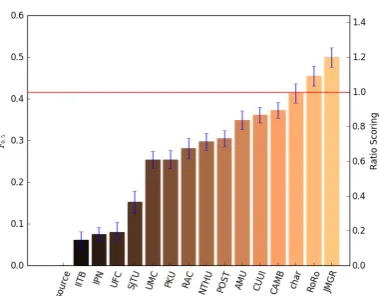
Figure 2: F0.5 values with M = 2for different systems,
including confidence interval (p =.95). The left-most col-umn (“source”) presents theF-score of a system that doesn’t make any changes to the source sentences. In red is human performance. See §2for a legend of the systems.
2.3 Human and System Performance
The bootstrapping method for computing the sig-nificance of the F-score (§2.2) can also be used for assessing the significance of the differences in system performance reported in the literature. We compute confidence intervals of different systems on the NUCLE test data (M = 2).
Results (Figure2) present mixed trends: some differences between previously reportedF-scores are indeed significant and some are not. For ex-ample, the best performing system is significantly better than all but the second one.
Considering theF-score of the best-performing systems, and comparing them to the F-score of a perfect system with M = 2 (in accordance with systems’ reported results), we find that their scores are comparable, where the systems RoRo and JMGR surpass a perfect system’s F-score. Similar experiments with GLEU show that the two systems obtain comparable or superior perfor-mance to humans on this measure as well.
2.4 Discussion
In this section we have established that (1) as sys-tems can surpass human performance on RBMs, re-scaling cannot be used to overcome the LCB, and that (2) as the distribution of valid corrections is long-tailed, the number of references needed for reliable RBMs is exceedingly high. Indeed, an average sentence has hundreds or more valid low-probability corrections, whose total probabil-ity mass is substantial. Our analysis with Exact In-dex Match suggests that similar effects are appli-cable to Grammatical Error Detection as well. The
proposal ofSakaguchi et al.(2016), to emphasize fluency over grammaticality in reference correc-tions, only compounds this problem, as it results in a larger number of valid corrections.
3 Implications of the LCB
We discuss the adverse effects of LCB not only on the reliability of RBMs, but on the development of GEC systems. We argue that evaluation with inad-equate reference coverage incentivizes systems to under-correct, and to mostly target errors that have few valid corrections (closed-class). We first show that low coverage can lead to under-correction (§3.1), then show that modern systems make far fewer corrections to the source, compared to hu-mans (§3.2). §3.3shows that increasing the num-ber of references can alleviate this effect. §3.4
shows that open-class errors are more likely to be under-corrected than closed-class ones.
3.1 Motivating Analysis
For simplicity, we abstract away from the details of the learning model and assume that systems attempt to maximize an objective function, over some training or development data. We assume maximization is achieved by iterating over the samples, as with the Perceptron or SGD.
Assume the system is faced with a phrase it pre-dicts to be ungrammatical. Assumepdetect is the probability this prediction is correct, and pcorrect is the probability it is able to predict a valid correc-tion for this phrase (including correctly identify-ing it as erroneous). Finally, assume evaluation is againstM references with coveragepcoverage(the probability that a valid correction will be found amongMrandomly sampled references).
We will now assume that the system may ei-ther choose to correct with the correction it finds the most likely or not at all. If it chooses not to correct, its probability of being rewarded (i.e., its output is in the reference set) is (1−pdetect). Otherwise, its probability of being rewarded is
pcorrect · pcoverage. A system is disincentivized from altering the phrase in cases where:
pcorrect·pcoverage<1−pdetect (7)
Corrector Sentence
Source This is especially to people who are overseas.
CHAR, UMC, JMGR This is especially for people who are overseas.
IPN This is especially to peoples who are overseas.
CUUI This is especially tothepeople who are overseas.
NUCLEA This is especiallytrue for peo-ple who are overseas.
[image:6.595.73.290.71.203.2]NUCLEB This is especially relevant to people who are overseas.
Table 2: Example for a sentence and proposed corrections by different systems (top part) and by the two NUCLE annota-tors (bottom part). Systems not mentioned in the table retain the source. No system produces a new word as needed. The two references differ in their corrections.
Precision-oriented measures (e.g., F0.5) penal-ize invalidly correcting more harshly than not cor-recting an ungrammatical sentence. In these cases, Condition (7) should be written as
pcorrect·pcoverage−(1−pcorrect·pcoverage)α <1−pdetect
where α is the ratio between the penalty for in-troducing a wrong correction and the reward for a valid correction. The condition is even more likely to hold with such measures.
3.2 Under-correction in GEC Systems
In this section we compare the prevalence of changes made to the source by the systems, to their prevalence in the NUCLE references. To strengthen our claim, we exclude all non-alphanumeric characters, both within tokens or as separate tokens. See Table2for an example.
We consider three types of divergences between the source and the reference. First, we measure the extent to whichwordswere changed: altered, deleted or added. To do so, we compute word alignment between the source and the reference, casting it as a weighted bipartite matching prob-lem. Edge weights are assigned to be the token edit distances.3 Following word alignment, we define WORDCHANGE as the number of aligned words and unaligned words changed. Second, we quantify wordorderdifferences using Spearman’s
ρbetween the order of the words in the source sen-tence and the order of their corresponding-aligned words in the correction. ρ = 0 where the word
3Aligning words in GEC is much simpler than in MT, as
most of the words are unchanged, deleted fully, added, or changed slightly.
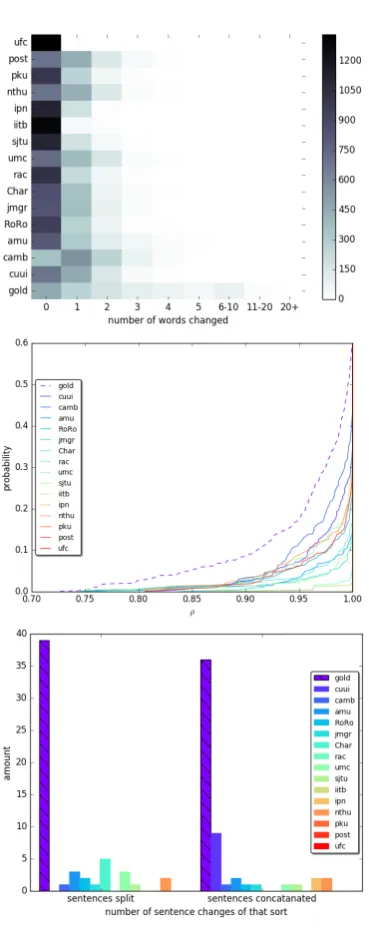
order is uncorrelated, and ρ = 1 where the or-ders exactly match. We report the averageρ over all source sentence pairs. Third, we report how many source sentences were split and how many concatenated by the reference and by the systems. One annotator was arbitrarily selected for the fig-ures.
Results. Results (Figure 3) show that humans make considerably more changes than systems ac-cording to all measures of under-correction, both in terms of the number of sentences modified and the number of modifications within them. Differ-ences are often an order of magnitude large. For example, 36 reference sentences include 6 word changes, where the maximal number of sentences with 6 word changes by any system is 5. We find similar trends on the references of the TreeBank of Learner English (Yannakoudakis et al.,2011).
3.3 HigherM Alleviates Under-correction
This section reports an experiment for determin-ing whether increasdetermin-ing the number of references in training indeed reduces under-correction. There is no corpus available with multiple references which is large enough for re-training a system. Instead, we simulate such a setting with an ora-cle reranking approach, and test whether the avail-ability of increasingly more training references re-duces a system’s under-correction.
Concretely, given a set of sentences, each paired with M references, a measure and a system’s k -best list, we define an oracle re-ranker that se-lects for each sentence the highest scoring cor-rection. As a test case, we use the RoRo system with k = 100, and apply it to the largest avail-able language learner corpus which is paired with a substantial amount of GEC references, namely the NUCLE test corpus. We use the standardF -score as the evaluation measure, examining the under-correction of the oracle re-ranker for differ-entM values, averaging over the 1312 samples of
M references from the available set of ten refer-ences provided byBryant and Ng(2015).
or-Figure 3: The prevalence of changes in system outputs and in the NUCLE reference. The top figure presents the number of sentences (heat) for each amount of word changes (x-axis; measured by WORDCHANGE) done by the outputs and the reference (y-axis). The middle figure presents the percent-age of sentence pairs (y-axis) where the Spearmanρvalues do not exceed a certain threshold (x-axis). The bottom figure presents the counts of source sentences (y-axis) concatenated (right bars) or split (left bars) by the references (striped col-umn) and the outputs (coloured columns). See AppendixA for a legend of the systems. Under all measures, the gold standard references make substantially more changes to the source sentences than any of the systems, in some cases an order of magnitude more.
Lval
empty Lvalnot empty evalid eerror SmallM 0 PY(e, Lval) PY(Lval)
LargeM 0 0 1
[image:7.595.308.526.72.135.2]Correction Rate = ↓ ↑
[image:7.595.90.275.100.566.2]Table 3: The expected effect of oracle re-ranking on under-correction. Values represent the probability of altering a sub-string of the inpute, which is a proxy to the expected cor-rection rate. Lvalis the valid alterations in thek-best list. PY(Lval)is the probability that a valid correction from the list is also in the reference setY,PY(e, Lval)is the proba-bility that, in addition, the reference that keepseis not inY. WhenM increases, the expected correction rate is expected to increase only ifeis an error and a valid correction of it is found in thek-best list.
Figure 4: The amount of sentences (y-axis) with a given number of words changed (x-axis) following oracle reranking with differentM values (column colors), where the amount forM = 1is subtracted from them. All references are ran-domly sampled except the “all” column that contains all ten references. In conclusion, tuning against additional refer-ences indeed reduces under-correction.
acle re-ranking has no effect and can be ignored. The corrections in thek-best list can then be par-titioned to those that keepeas it is; those that in-validly altere; and those that validly altere.
Table 3 presents the probability that ewill be altered in the different cases. Analysis shows that under-correction is likely to decrease withMonly in the case whereeis an error and thek-best list contains a valid correction of it. Whenever the ref-erence allows both keeping eand altering e, the re-ranker selects keepinge.
[image:7.595.310.524.264.433.2]3.4 Under-correction by Error Types
In this section we study the prevalence of under-correction according to edit types, finding that open-class types of errors (such as replacing a word with another word) are more starkly under-corrected, than closed-class errors. Evaluating with low coverage RBMs does not incentivize sys-tems to address open-class errors (in fact, it disin-centivizes them to). Therefore, even if LCB is not the cause for this trend, current evaluation proce-dures may perpetuate it.
We use the data ofBryant et al.(2017), which automatically assigned types to each edit in the output of all CoNLL 2014 systems on the NUCLE test set. As a measure of under-correction ten-dency, we take the ratio between the mean num-ber of corrections produced by the systems and by the references. We note that this analysis does not consider whether the predicted correction is valid or not, but only how many of the errors of each type the systems attempted to correct.
We find that all edit types are under-predicted on average, but that the least under-predicted ones are mostly closed-class types. Concretely, the top quarter of error types consists of orthographical errors, plurality inflection of nouns, adjective in-flections to superlative or comparative forms and determiner selection. The bottom quarter includes the categories verb selection, noun selection, par-ticle/preposition selection, pronoun selection, and the type OTHER, which is a residual category. The only exception to this regularity is the closed-class punctuation selection type, which is found in the lower quarter. See AppendixE.
This trend cannot be explained by assuming that common error types are targeted more. Indeed, error type frequency is slightly negatively corre-lated with the under-correction ratio (ρ=-0.29 p-value=0.16). A more probable account of this ef-fect is the disincentive of GEC systems to correct open-class error types, for which even valid cor-rections are unlikely to be rewarded.
4 Similar Effects on Simplification
We now turn to replicating our experiments on Text Simplification (TS). From a formal point of view, evaluation of the tasks is similar: the output is obtained by making zero or more edits to the source. RBMs are the standard for TS evaluation, much like they are in GEC.
Our experiments on TS demonstrate that
simi-lar trends recur in this setting as well. The ten-dency of TS systems to under-predict changes to the source has already been observed by previous work (Alva-Manchego et al.,2017), showing that TS systems under-predict word additions, dele-tions, substitudele-tions, and sequence shifts (Zhang and Lapata, 2017), and have low edit distance from the source (Narayan and Gardent,2016). Our experiments show that LCB may account for this under-prediction. Concretely, we show that (1) the distribution of valid references for a given sen-tence is long-tailed; (2) common evaluation mea-sures suffer from LCB, taking SARI (Xu et al.,
2016) as an example RBM (similar trends are ob-tained with Accuracy); (3) under-prediction is al-leviated withMin oracle re-ranking experiments.
We crowd-sourced 2500 reference simplifica-tions for 47 sentences, using the corpus and the an-notation protocol ofXu et al.(2016), and applying UNSEENESTto estimateDx(AppendixB). Table
4shows that the expected number of references is even greater in this setting.
Assessing the effect of M on SARI, we find that SARI diverges from Accuracy andF-score in that its multi-reference version is not a maximum over the single-reference scores, but some combi-nation of them. This can potentially increase cov-erage, but it also leads to an unintuitive situation: an output identical to a reference does not receive a perfect score, but rather the score depends on how similar the output is to the other references. A more in-depth analysis of SARI’s handling of multiple references is found in Appendix F. In order to neutralize this effect of SARI, we also report results with MAX-SARI, which coincides with SARI onM = 1, and is defined as the maxi-mum single-reference SARI score forM >1.
experi-Frequency Threshold (γ) 0 0.001 0.01 0.1 Variants 2636.29 111.19 4.68 0.13
Mass 1 0.42 0.14 0.02
Table 4: Estimating the distribution of simplificationsDx. The table presents the mean number of simplifications per sentence with probability more thanγ(top row), as well as their total probability mass (bottom row).
ments to MAX-SARI, conducting re-ranking ex-periments on k-best lists in two settings: Moses (Koehn et al., 2007) with k = 100, and a neu-ral model (Nisioi et al.,2017) withk = 12. Our results indeed show that under-prediction is alle-viated withM in both settings. For example, the least under-predicting model (the neural one) did not change 50 sentences withM = 1, but only 29 weren’t changed withM = 8. See AppendixG.
5 Conclusion
We argue that using low-coverage reference sets has adverse effects on the reliability of reference-based evaluation, with GEC and TS as a test case, and consequently on the incentives offered to sys-tems. We further argue that these effects can-not be overcome by re-scaling or increasing the number of references in a feasible way. The pa-per makes two methodological contributions to the monolingual translation evaluation literature: (1) a methodology for evaluating evaluation measures by the scores they assign a perfect system, us-ing a bootstrappus-ing procedure; (2) a methodology for assessing the distribution of valid monolingual translations. Our findings demonstrate how these tools can help characterize the biases of existing systems and evaluation measures. We believe our findings and methodologies can be useful for sim-ilar tasks such as style conversion and automatic post-editing of raw MT outputs.
We note that the LCB further jeopardizes the reliability of common validation experiments for RBMs, that assess the correlation between human and measure rankings of system outputs ( Grund-kiewicz et al.,2015). Indeed, if outputs all simi-larly under-correct, correlation studies will not be affected by whether an RBM is sensitive to under-correction. Therefore, the tendency of RBMs to reward under-correction cannot be detected by such correlation experiments (cf. Choshen and Abend,2018a).
Our results underscore the importance of
de-veloping alternative evaluation measures that tran-scend n-gram overlap, and use deeper analysis tools, e.g., by comparing the semantics of the ref-erence and the source to the output (cf.Lo and Wu,
2011). Napoles et al.(2016) have made progress towards this goal in proposing a reference-less grammaticality measure, using Grammatical Error Detection tools, as did Asano et al. (2017), who added a fluency measure to the grammaticality. In a recent project (Choshen and Abend,2018b), we proposed a complementary measure that mea-sures the semantic faithfulness of the output to the source, in order to form a combined semantic mea-sure that bypasses the pitfalls of low coverage.
Acknowledgments
This work was supported by the Israel Science Foundation (grant No. 929/17), and by the HUJI Cyber Security Research Center in conjunction with the Israel National Cyber Bureau in the Prime Minister’s Office. We thank Nathan Schneider, Courtney Napoles and Joel Tetreault for helpful feedback.
References
Fernando Alva-Manchego, Joachim Bingel, Gustavo Paetzold, Carolina Scarton, and Lucia Specia. 2017.
Learning how to simplify from explicit labeling of complex-simplified text pairs. In Proceedings of the Eighth International Joint Conference on Natu-ral Language Processing (Volume 1: Long Papers), pages 295–305, Taipei, Taiwan. Asian Federation of Natural Language Processing.
Hiroki Asano, Tomoya Mizumoto, and Kentaro Inui. 2017. Reference-based metrics can be replaced with reference-less metrics in evaluating grammat-ical error correction systems. InProceedings of the Eighth International Joint Conference on Natural Language Processing (Volume 2: Short Papers), vol-ume 2, pages 343–348.
Christopher Bryant, Mariano Felice, and Ted Briscoe. 2017. Automatic annotation and evaluation of error types for grammatical error correction. In Proceed-ings of the 55th Annual Meeting of the Association for Computational Linguistics (Volume 1: Long Pa-pers), pages 793–805, Vancouver, Canada. Associa-tion for ComputaAssocia-tional Linguistics.
Christopher Bryant and Hwee Tou Ng. 2015. How far are we from fully automatic high quality grammati-cal error correction? InACL (1), pages 697–707.
[image:9.595.93.274.72.115.2]Leshem Choshen and Omri Abend. 2018a. Automatic metric validation for grammatical error correction. In Proceedings of the 56th Annual Meeting of the Association for Computational Linguistics (Volume 1: Long Papers).
Leshem Choshen and Omri Abend. 2018b. Reference-less measure of faithfulness for grammatical error correction. InProceedings of the 2018 Conference of the North American Chapter of the Association for Computational Linguistics: Human Language Technologies.
Daniel Dahlmeier and Hwee Tou Ng. 2012. Better evaluation for grammatical error correction. In Pro-ceedings of the 2012 Conference of the North Amer-ican Chapter of the Association for Computational Linguistics: Human Language Technologies, pages 568–572. Association for Computational Linguis-tics.
Daniel Dahlmeier, Hwee Tou Ng, and Siew Mei Wu. 2013. Building a large annotated corpus of learner english: The nus corpus of learner english. In Proceedings of the Eighth Workshop on Innovative Use of NLP for Building Educational Applications, pages 22–31.
Markus Dreyer and Daniel Marcu. 2012. Hyter: Meaning-equivalent semantics for translation eval-uation. In Proceedings of the 2012 Conference of the North American Chapter of the Association for Computational Linguistics: Human Language Tech-nologies, pages 162–171. Association for Computa-tional Linguistics.
Bradley Efron. 1987. Better bootstrap confidence in-tervals. Journal of the American statistical Associa-tion, 82(397):171–185.
Mariano Felice and Ted Briscoe. 2015. Towards a stan-dard evaluation method for grammatical error detec-tion and correcdetec-tion. In HLT-NAACL, pages 578– 587.
Roman Grundkiewicz, Marcin Junczys-Dowmunt, Ed-ward Gillian, et al. 2015. Human evaluation of grammatical error correction systems. In EMNLP, pages 461–470.
Marcin Junczys-Dowmunt and Roman Grundkiewicz. 2016. Phrase-based machine translation is state-of-the-art for automatic grammatical error correction. In Proceedings of the 2016 Conference on Empiri-cal Methods in Natural Language Processing, pages 1546–1556, Austin, Texas. Association for Compu-tational Linguistics.
Philipp Koehn, Hieu Hoang, Alexandra Birch, Chris Callison-Burch, Marcello Federico, Nicola Bertoldi, Brooke Cowan, Wade Shen, Christine Moran, Richard Zens, Chris Dyer, Ondrej Bojar, Alexandra Constantin, and Evan Herbst. 2007. Moses: Open source toolkit for statistical machine translation. In Proceedings of the 45th Annual Meeting of the As-sociation for Computational Linguistics Companion
Volume Proceedings of the Demo and Poster Ses-sions, pages 177–180.
Chi-kiu Lo and Dekai Wu. 2011. Meant: an inexpen-sive, high-accuracy, semi-automatic metric for eval-uating translation utility via semantic frames. In Proceedings of the 49th Annual Meeting of the Asso-ciation for Computational Linguistics: Human Lan-guage Technologies-Volume 1, pages 220–229. As-sociation for Computational Linguistics.
Nitin Madnani, Joel Tetreault, Martin Chodorow, and Alla Rozovskaya. 2011. They can help: Using crowdsourcing to improve the evaluation of gram-matical error detection systems. InProceedings of the 49th Annual Meeting of the Association for Com-putational Linguistics: Human Language Technolo-gies: short papers-Volume 2, pages 508–513. Asso-ciation for Computational Linguistics.
Inderjeet Mani. 2009. Summarization evaluation: an overview. InProceedings of the NTCIR Workshop, volume 2.
Courtney Napoles, Keisuke Sakaguchi, Matt Post, and Joel Tetreault. 2015. Ground truth for grammati-cal error correction metrics. InProceedings of the 53rd Annual Meeting of the Association for Compu-tational Linguistics and the 7th International Joint Conference on Natural Language Processing, vol-ume 2, pages 588–593.
Courtney Napoles, Keisuke Sakaguchi, and Joel Tetreault. 2016. There’s no comparison: Reference-less evaluation metrics in grammatical error correc-tion. In Proceedings of the 2016 Conference on Empirical Methods in Natural Language Process-ing, pages 2109–2115. Association for Computa-tional Linguistics.
Shashi Narayan and Claire Gardent. 2016. Unsuper-vised sentence simplification using deep semantics. InProceedings of the 9th International Natural Lan-guage Generation conference, pages 111–120, Edin-burgh, UK. Association for Computational Linguis-tics.
Sergiu Nisioi, Sanja Štajner, Simone Paolo Ponzetto, and Liviu P Dinu. 2017. Exploring neural text sim-plification models. InProceedings of the 55th An-nual Meeting of the Association for Computational Linguistics (Volume 2: Short Papers), volume 2, pages 85–91.
Matt Post, Chris Callison-Burch, and Miles Osborne. 2012. Constructing parallel corpora for six indian languages via crowdsourcing. InProceedings of the Seventh Workshop on Statistical Machine Transla-tion, pages 401–409. Association for Computational Linguistics.
pages 28–36. Association for Computational Lin-guistics.
Alla Rozovskaya and Dan Roth. 2013. Joint learning and inference for grammatical error correction. Ur-bana, 51:61801.
Alla Rozovskaya and Dan Roth. 2016. Grammatical error correction: Machine translation and classifiers. InProc. of ACL, pages 2205–2215.
Keisuke Sakaguchi, Courtney Napoles, Matt Post, and Joel Tetreault. 2016. Reassessing the goals of matical error correction: Fluency instead of gram-maticality.Transactions of the Association for Com-putational Linguistics, 4:169–182.
Joel R Tetreault and Martin Chodorow. 2008. Na-tive judgments of non-naNa-tive usage: Experiments in preposition error detection. In Proceedings of the Workshop on Human Judgements in Computational Linguistics, pages 24–32. Association for Computa-tional Linguistics.
Ziang Xie, Anand Avati, Naveen Arivazhagan, Dan Ju-rafsky, and Andrew Y Ng. 2016. Neural language correction with character-based attention. arXiv preprint arXiv:1603.09727.
Wei Xu, Chris Callison-Burch, and Courtney Napoles. 2015. Problems in current text simplification re-search: New data can help. Transactions of the As-sociation for Computational Linguistics, 3:283–297.
Wei Xu, Courtney Napoles, Ellie Pavlick, Quanze Chen, and Chris Callison-Burch. 2016. Optimizing statistical machine translation for text simplification. Transactions of the Association for Computational Linguistics, 4:401–415.
Helen Yannakoudakis, Ted Briscoe, and Ben Medlock. 2011. A new dataset and method for automatically grading esol texts. InProceedings of the 49th An-nual Meeting of the Association for Computational Linguistics: Human Language Technologies-Volume 1, pages 180–189. Association for Computational Linguistics.
Alexander Yeh. 2000. More accurate tests for the sta-tistical significance of result differences. In Pro-ceedings of the 18th conference on Computational linguistics-Volume 2, pages 947–953. Association for Computational Linguistics.
Omar F Zaidan and Chris Callison-Burch. 2011. Crowdsourcing translation: Professional quality from non-professionals. InProceedings of the 49th Annual Meeting of the Association for Computa-tional Linguistics: Human Language Technologies-Volume 1, pages 1220–1229. Association for Com-putational Linguistics.
Xingxing Zhang and Mirella Lapata. 2017. Sentence simplification with deep reinforcement learning. In Proceedings of the 2017 Conference on Empirical Methods in Natural Language Processing, pages
584–594, Copenhagen, Denmark. Association for Computational Linguistics.