Operational storm impact forecast information for the coast : design, implementation in MorphAn and evaluation of an operational coastal storm impact application
78
0
0
Full text
(2)
(3) Operational storm impact forecast information for the coast Design, implementation in MorphAn and evaluation of an operational coastal storm impact application by. Jelmer Veenstra. in partial fulfillment of the requirements for the degree of Master of Science in Civil Engineering and Management at the University of Twente, to be defended publicly on Wednesday 23 March 2016 at 16:00.. Name: Student number: Chair group: Department: Study: Faculty: Location and date: Thesis committee:. J. (Jelmer) Veenstra s1006177 Marine and Fluivial Systems (prof.dr. S.J.M.H. Hulscher) Water Engineering and Management Civil Engineering and Management Engineering Technology Enschede, 16 March 2016 Dr. K. M Wijnberg University of Twente Ir. J. M. Damen University of Twente Dr. M. Boers Deltares Ir. P. F. C. van Geer Deltares Ir. J. Rietdijk Hoogheemraadschap van Delfland. A digital version of this thesis is available at essay.utwente.nl. The cover image is an aerial picture of Noorderstrand on the Schouwen-Duiveland island with the Brouwersdam on the left, by Peter Buteijn (March 2010). The Noorderstrand was a former weak spot of the Dutch coast and was therefore reinforced in the fall of 2013..
(4)
(5) Preface This master thesis reports about my graduation project that finalizes my study Water Engineering and Management at the University of Twente. The project was initiated by Deltares and the Delfland water authority and was mainly conducted at Deltares. It started with a preparatory phase from July to September 2015, in which a literature review and research plan were set up. The literature review was used to explore the possibilities for research topics that are relevant for coastal managers and the development of MorphAn. One of these topics was selected to serve as the scope of the research plan, providing operational storm impact forecast information for the coast. The graduation project itself was conducted from October 2015 to March 2016, during which an operational coastal storm impact application was designed, implemented in MorphAn and evaluated. I have really enjoyed the period at Deltares and I am grateful for the fact that I had the chance to work in its inspiring and open environment. I would like to thank my supervisors from Deltares, Marien and Pieter, for their enthusiasm and motivation, and for always creating time for me in busy calendars. I would like to thank my supervisor from Delfland, Jeroen, for providing insight in the practical world of a water manager and his enthusiasm about my work. I would also like to thank my supervisors from the University of Twente, John and Kathelijne, for keeping me on a research track, and not to wander too far from my goal to write my thesis instead of only writing a new application. Thank you Joost, for your help with XBeach and your patience. Thank you Marc, for providing access to RWsOS data of Rijkswaterstaat and providing insight in the value of this data source. Thank you Tom, Simone and Caroline for your help with Matroos and giving insight in the data its models provide. I would like to thank my fellow student and great friend, Jonne, for reviewing my entire work and providing me with a readers’ view. Lastly, I would also like to thank my fellow students at Deltares, for the great lunch, coffee and walking breaks we had, with great talks about thesis problems, LaTeX opinions as well as the many more less serious topics.. i.
(6) Summary Dunes protect a large part of the Dutch coast against flooding from the sea. Although most storms will not cause failure of this sea defense, they may still cause a threat to, for instance, seaside towns because of dune erosion and overtopping. Also, high waves and current velocities near the shore may cause damage to coastal structures or property on the beach. Currently, weather, water level and wave forecasts provide coastal managers with timely information about the severity of an approaching storm, but the damaging effects to be expected of that particular storm are usually unclear. Despite ongoing research, no early warning system which incorporates storm impact assessment is currently available at water authorities. In this study, an operational, quick, flexible and easy to use storm impact application is designed, implemented in MorphAn and evaluated. MorphAn is a computer program that is already used for dune assessment and other coastal related analyses by coastal water authorities and Rijkswaterstaat. There are three main components which are coupled in the storm impact application. These are bathymetry data, water level and wave data as well as an XBeach model. JARKUS transect bathymetry data from MorphAn or alternative 2D grid bathymetry sources like recent bathymetry derived from Argus cameras can be selected and are automatically downloaded. Real-time water level and wave forecast data from Rijkswaterstaat with a 48 hour lead time is retrieved for the location of the chosen bathymetry data. Using this water level and wave data from remote servers eliminates local computational time of large and complicated water level and wave models. Therefore, the storm impact application can be used on a normal laptop and is accessible by water authorities. The bathymetry and water level and wave data is automatically fed into the XBeach model, which calculates the hydrodynamic and morphologic processes that occur during the storm. The storm impact application in MorphAn provides a Graphical User Interface (GUI) where a user takes several steps in order to obtain a result that provides insight in the effects of the approaching storm on the coast. These effects are for instance dune erosion or breaching, damage of property, high current velocities near the shore and overtopping of dunes or structures. Coastal managers can directly use this result for communication purposes, as well as for decisions about beach and hinterland evacuations or protecting measures of sea dikes or dunes. The quality of the storm impact application is evaluated with the criteria Speed, Relevance, Understanding, Robustness and Evolvability. The speed is sufficient to assess approximately 240 1D transects as well as a 2D model with a longshore domain size of 250 to 5000 meter, both within a two hour limit. The relevance of the storm impact application as well as the storm impact information it provides is recognized by coastal water authorities. The understanding is improved by providing a GUI as well as variable output visualization complexities, although there are many improvements possible in the GUI that is currently implemented. The robustness of the storm impact application components is good, because of several different available bathymetry sources, redundant Rijkswaterstaat hardware and an XBeach model as well as a MorphAn GUI that are both locally installed. There are several possibilities to evolve the storm impact application by improving current possibilities as well as implementing international data sets to use the storm impact application elsewhere. The information provided by the storm impact application is evaluated with the criteria Accuracy and Performance. The uncertainties of the different bathymetry sources, water level and wave forecasts as well as the XBeach model are assessed. A sensitivity analysis of the uncertainties of water level and wave data provides information about their effect on the result, to be taken into account in decision making. The confidence interval of the dune retreat that is provided by the ii.
(7) storm impact application is approximately 15 meters. This confidence interval can be used by decision makers, to determine whether decisions can be bases on the storm impact application in operational practice. The storm impact application developed in this study is only useful if it will be used in practice. Evaluation of the seven criteria that were defined in this study provide a promising outlook for operational practice, although many improvements are possible for the GUI. A prototype of a storm impact application was developed, implemented in MorphAn and evaluated. This application uses real-time water level and wave forecast data as well as recent bathymetry. The storm impact application from this study can be used to provide relevant, accurate and timely storm impact information for the coast. Concluding, an operational, quick, flexible and easy to use storm impact application is now available for operational practice and ready to be further developed.. iii.
(8) Table of Contents. 1 Introduction 1.1 Motivation . . . . . . . . . . . . . . . . . . . . . . . . . . . . . . . 1.2 Problem definition . . . . . . . . . . . . . . . . . . . . . . . . . . . 1.2.1 Coastal area regulations and authorities of the Netherlands 1.2.2 Existing storm impact projects . . . . . . . . . . . . . . . . 1.2.3 Storm impact information in MorphAn . . . . . . . . . . . 1.3 Research objective and research questions . . . . . . . . . . . . . . 1.4 Methodology . . . . . . . . . . . . . . . . . . . . . . . . . . . . . . 1.4.1 1D and 2D bathymetry data . . . . . . . . . . . . . . . . . 1.4.2 Water and wave forecast data . . . . . . . . . . . . . . . . . 1.4.3 Morphological model . . . . . . . . . . . . . . . . . . . . . . 1.4.4 Evaluation . . . . . . . . . . . . . . . . . . . . . . . . . . . 1.5 Research approach . . . . . . . . . . . . . . . . . . . . . . . . . . . 1.5.1 Define the storm impact application components . . . . . . 1.5.2 Implement the storm impact application in MorphAn . . . 1.5.3 Evaluate the quality of the storm impact application . . . . 1.5.4 Analyze the results of the storm impact application . . . .. . . . . . . . . . . . . . . . .. . . . . . . . . . . . . . . . .. . . . . . . . . . . . . . . . .. . . . . . . . . . . . . . . . .. . . . . . . . . . . . . . . . .. . . . . . . . . . . . . . . . .. . . . . . . . . . . . . . . . .. . . . . . . . . . . . . . . . .. . . . . . . . . . . . . . . . .. 1 1 1 1 2 4 5 5 5 6 6 6 7 7 7 8 8. 2 Components of the storm impact application 2.1 Schematization of the storm impact application 2.2 Bathymetry data . . . . . . . . . . . . . . . . . 2.2.1 Transect bathymetry data . . . . . . . . 2.2.2 Grid bathymetry data . . . . . . . . . . 2.2.3 Real-time bathymetry data . . . . . . . 2.3 RWsOS water level and wave forecast data . . 2.4 XBeach model . . . . . . . . . . . . . . . . . .. . . . . . . .. . . . . . . .. . . . . . . .. . . . . . . .. . . . . . . .. . . . . . . .. . . . . . . .. . . . . . . .. . . . . . . .. 9 9 10 10 10 11 12 14. the components . . . . . . . . . . . . . . . . . . . . . . . . . . . . . . . . . . . . . . . . . . . . . . . . . . . . . . . . . . . . . . . . . . . . . . . . . . . . . . . . . . . . . . . . . . . . . . . . . . .. and GUI) . . . . . . . . . . . . . . . . . . . . . . . . . . . . . . . . . . . . . . . . . . . . . . . . . . . . . . . . . . . . . . .. . . . . . . . . .. . . . . . . . . .. . . . . . . . . .. . . . . . . . . .. . . . . . . . . .. 17 18 18 18 18 21 23 23 23 25. . . . . .. . . . . .. . . . . .. . . . . .. . . . . .. . . . . .. . . . . .. 27 27 28 29 30 31. 3 Implementation in MorphAn 3.1 Technical prerequisites . . . 3.2 Input . . . . . . . . . . . . . 3.2.1 Parameters . . . . . 3.2.2 Bathymetry . . . . . 3.2.3 RWsOS . . . . . . . 3.2.4 Building data . . . . 3.3 XBeach model run . . . . . 3.4 Output . . . . . . . . . . . 3.5 Current prototype method .. (coupling of . . . . . . . . . . . . . . . . . . . . . . . . . . . . . . . . . . . . . . . . . . . . . . . . . . . . . . . . . . . . . . . . . . . . . . . .. 4 Quality of the storm impact application 4.1 Speed . . . . . . . . . . . . . . . . . . . 4.2 Relevance . . . . . . . . . . . . . . . . . 4.3 Understanding . . . . . . . . . . . . . . 4.4 Robustness . . . . . . . . . . . . . . . . 4.5 Evolvability . . . . . . . . . . . . . . . . iv. . . . . .. . . . . .. . . . . .. . . . . . . .. . . . . .. . . . . . . .. . . . . .. . . . . . . .. . . . . .. . . . . . . .. . . . . .. . . . . . . .. . . . . .. . . . . . . .. . . . . .. . . . . . . .. . . . . .. . . . . . . .. . . . . .. . . . . . . .. . . . . . . .. . . . . .. . . . . . . .. . . . . .. . . . . .. . . . . .. . . . . .. . . . . ..
(9) 5 Accuracy and performance of the storm impact application results 5.1 Accuracy . . . . . . . . . . . . . . . . . . . . . . . . . . . . . . . . . . . . . 5.1.1 Uncertainties of the bathymetry data . . . . . . . . . . . . . . . . . 5.1.2 Uncertainties of the RWsOS water level and wave data . . . . . . . . 5.1.3 Uncertainties due to the XBeach model . . . . . . . . . . . . . . . . 5.2 Performance: sensitivity analysis for the water level and wave uncertainties 5.2.1 Performance conclusion . . . . . . . . . . . . . . . . . . . . . . . . .. . . . . . .. . . . . . .. . . . . . .. . . . . . .. 33 33 33 34 35 35 38. 6 Discussion 6.1 Speed . . . . . 6.2 Relevance . . . 6.3 Understanding 6.4 Robustness . . 6.5 Evolvability . . 6.6 Accuracy . . . 6.7 Performance . .. . . . . . . .. . . . . . . .. . . . . . . .. . . . . . . .. 39 39 39 40 40 40 40 41. . . . . . . .. . . . . . . .. . . . . . . .. . . . . . . .. . . . . . . .. . . . . . . .. . . . . . . .. . . . . . . .. . . . . . . .. . . . . . . .. . . . . . . .. . . . . . . .. . . . . . . .. . . . . . . .. . . . . . . .. . . . . . . .. . . . . . . .. . . . . . . .. . . . . . . .. . . . . . . .. . . . . . . .. . . . . . . .. . . . . . . .. . . . . . . .. . . . . . . .. . . . . . . .. . . . . . . .. . . . . . . .. . . . . . . .. . . . . . . .. . . . . . . .. . . . . . . .. . . . . . . .. . . . . . . .. 7 Conclusions 7.1 RQ 1: What are necessary storm impact application components to acquire relevant storm impact information? . . . . . . . . . . . . . . . . . . . . . . . . . . . . . . . . 7.2 RQ 2: How can the storm impact information be provided using a storm impact application in MorphAn? . . . . . . . . . . . . . . . . . . . . . . . . . . . . . . . . 7.3 RQ 3: What is the quality of the storm impact application? . . . . . . . . . . . . . 7.4 RQ 4: What is the accuracy and performance of the storm impact application results? 7.5 Research objective . . . . . . . . . . . . . . . . . . . . . . . . . . . . . . . . . . . .. 43. 8 Recommendations 8.1 Bathymetry . . . . . . . . . . . 8.2 RWsOS . . . . . . . . . . . . . 8.3 XBeach model . . . . . . . . . 8.4 Sensitivity of the model results 8.5 MorphAn and scripting . . . .. 45 45 45 46 48 49. . . . . .. . . . . .. . . . . .. . . . . .. . . . . .. . . . . .. . . . . .. . . . . .. . . . . .. . . . . .. . . . . .. . . . . .. . . . . .. . . . . .. . . . . .. . . . . .. . . . . .. . . . . .. . . . . .. . . . . .. . . . . .. . . . . .. . . . . .. . . . . .. . . . . .. . . . . .. . . . . .. . . . . .. . . . . .. Bibliography. 43 44 44 44 44. 51. A Water authorities and regulations A.1 Coastal water authorities in the Netherlands . . . . . . . . . . . . . . . . . . . . . . A.2 Dune safety regulations . . . . . . . . . . . . . . . . . . . . . . . . . . . . . . . . . B MorphAn functions and possibilities. I I II III. C XBeach input files. V. D Installation guide. IX. E Sensitivity analysis case overview. XI. v.
(10) List of Figures 1.1. The coupled models within MICORE (Baart et al., 2015) . . . . . . . . . . . . . .. 2.1 2.2 2.3 2.4 2.5 2.6 2.7. Schematization of the storm impact application components JARKUS data of raai 9795 from 2007 to 2014 . . . . . . . . JARKUS grid bathymetry data for the Dutch coast and the SWAN operational model area (Gautier and Caires, 2015) . Two RWsOS data model areas and timeseries . . . . . . . . XBeach model application for calm and storm conditions . Wave angles and bins for different coastline rotations . . . .. . . . . . . . . . . . . . . . . Sand Engine . . . . . . . . . . . . . . . . . . . . . . . . . . . . . . . .. . . . . . . .. . . . . . . .. . . . . . . .. . . . . . . .. 4. . . . . . . .. 9 10 11 13 14 15 15. Project tree screen (?) . . . . . . . . . . . . . . . . . . . . . . . . . . . . . . . . . . Pop-up input screen . . . . . . . . . . . . . . . . . . . . . . . . . . . . . . . . . . . 1D JARKUS bathymetry selector (?) . . . . . . . . . . . . . . . . . . . . . . . . . . GUI interface for 2D bathymetry . . . . . . . . . . . . . . . . . . . . . . . . . . . . XBeach grid coordinates . . . . . . . . . . . . . . . . . . . . . . . . . . . . . . . . . GUI interface where the XBeach grid is generated with interpolated values from the bathymetry layer. . . . . . . . . . . . . . . . . . . . . . . . . . . . . . . . . . . . . . 3.7 Extended grid in the MorphAn GUI . . . . . . . . . . . . . . . . . . . . . . . . . . 3.8 The water data that is retrieved from the RWsOS database . . . . . . . . . . . . . 3.9 1D XBeach result . . . . . . . . . . . . . . . . . . . . . . . . . . . . . . . . . . . . . 3.10 2D XBeach output . . . . . . . . . . . . . . . . . . . . . . . . . . . . . . . . . . . . 3.11 Storm impact application shortcut buttons in the MorphAn ribbon. The buttons are divided into four groups. . . . . . . . . . . . . . . . . . . . . . . . . . . . . . . .. 17 19 19 20 21. 4.1. Timeline of RWsOS and calamity team . . . . . . . . . . . . . . . . . . . . . . . . .. 27. 5.1 5.2 5.3 5.4 5.5. Initial 2D bathymetry and bed level change . . . . . . . . . . . . . Initial and eventual bed level for the different cases . . . . . . . . . The water level and wave characteristics for the Sinterklaasstorm of Sensitivity results of case 1 to 40 . . . . . . . . . . . . . . . . . . . Initial and eventual bed level for cases 1 to 20 . . . . . . . . . . . .. 36 36 37 37 38. 3.1 3.2 3.3 3.4 3.5 3.6. A.1 Water authorities of the Netherlands (Van Aalst, 2016). vi. . . . . . . . . . . . . . . 5 December . . . . . . . . . . . . . .. . . . . 2013 . . . .. . . . . . . . . . . . . . . .. 21 22 22 24 25 26. I.
(11) List of Tables 1.1. Evaluation criteria . . . . . . . . . . . . . . . . . . . . . . . . . . . . . . . . . . . .. 7. 3.1. Cross-sectional chart model output description, the terms in the left column are explained in Figure 3.9. . . . . . . . . . . . . . . . . . . . . . . . . . . . . . . . . . Ribbon shortcut functions . . . . . . . . . . . . . . . . . . . . . . . . . . . . . . . .. 24 26. C.1 XBeach input files . . . . . . . . . . . . . . . . . . . . . . . . . . . . . . . . . . . .. V. E.1 Overview and results of the sensitivity analysis model runs. . . . . . . . . . . . . .. XI. 3.2. vii.
(12)
(13) Chapter 1. Introduction 1.1. Motivation. A large part of the Dutch coast consists of dunes protecting the Netherlands against flooding from the sea. In order to keep the dunes safe, periodic safety assessments of the dunes are conducted by the coastal water authorities for which they currently use the program MorphAn (Lodder and van Geer, 2012). After the storm in 1953, the sea defenses have been drastically improved to withstand once in 2000 to once in 10000 year storms. Although less severe storms will not cause failure of the sea defense, they may still cause a threat of dune erosion and overtopping (Gautier and Caires, 2015). The storm impact on the coastal area is often unknown (Haerens et al., 2012). However, Dutch coastal managers are generally timely aware of an approaching storm, thanks to weather, water level and wave forecasts. Just a few examples of storm effects could be dune erosion or breaching, damage of property, fast current velocities near the shore and overtopping of dunes or structures. Because these storm impact effects are unknown, coastal managers can only inform inhabitants and emergency services based on expert judgment, but not based on actual predictions of the storm impact. Despite studies about storm impact response, these projects are not made accessible and flexible enough to be operationally used at water authorities. In this study, this problem is elaborated on and an operational, quick, flexible and easy to use storm impact application is designed, implemented in MorphAn and evaluated. A lot can be gained from an operational storm impact application, because it supports storm impact related decisions such as whether to evacuate buildings, the beach or the hinterland. It also answers safety related questions from emergency services and inhabitants. Furthermore, implementing a storm impact application in MorphAn provides the possibility to use live water data and use recent bathymetry data derived from video cameras. These implementations are both interesting and useful, because they can increase the speed and improve the relevance of assessments in MorphAn.. 1.2. Problem definition. This section describes the calamity regulations for coastal areas and existing storm impact projects. It concludes with a problem summary and a motivation why the current storm impact application does have potential to become operational.. 1.2.1. Coastal area regulations and authorities of the Netherlands. Some parts of the Dutch coast are natural and undefended dunes, while other parts may have a hybrid sea defense. The beach width ranges from less than fifty meters at narrow sections to hundreds of meters at the Sand Engine. The coastline is sandy and consist of intermediate beaches 1.
(14) 2. Chapter 1. Introduction. with sand bars in front of the coast line and breaking waves. The entire beach and dune area has high touristic value, which is reflected in the many beach pavilions and in the activity on the beach. Furthermore, the coastal area is also used for research projects, currently mainly at the Sand Engine nourishment. The dune coast is managed by Rijkswaterstaat and five of the twenty three water authorities (waterschappen) of the Netherlands. These water authorities are the main potential users of a storm impact application and are depicted in Appendix A. In order to maintain the coastal protection provided by the dunes, the state has provided laws and regulations for the management of primary water defenses. The Water Act (Waterwet) (Ministerie van Infrastructuur en Milieu, 2009) prescribes the prevention or limitation of floods, as well as the prevention and counteraction of landward movement of the coastline. Furthermore, it prescribes a periodic assessment of the primary flood defenses of the Netherlands to ensure dune safety. An overview of reports and assessment guides resulting from this law is provided in Appendix A. The most recent dune assessment guide prescribes dune assessment with the DUROS+1 model in the software package MorphAn. Besides the prevention of flooding and landward movement of the coastline, the Water Act (Ministerie van Infrastructuur en Milieu, 2009) also prescribes that water authorities should have a calamity organization and a calamity response plan. If Rijkswaterstaat predicts water levels of NAP +2.20m at Hoek van Holland, a code yellow warning is issued by the WMCN2 towards coastal authorities. This water level occurs 3.5 times a year. Code orange (NAP +2.80m) occurs once in every five years, code red (NAP +3.65m) once in every 100 years and code MHW3 (NAP +5.10m) once in every 10000 years. Water authorities take different precautions and measures depending on the warning code. (Ministerie van Infrastructuur en Milieu, 2015) Although water authorities do not interfere with emergency services or evacuation procedures, they are expected to provide information and knowledge that can be used to advise the decision makers. In the Netherlands, storm intensity, wind, storm surge, water level and wave height forecasts are often available. Usually, it is probable that the dunes will withstand the storm since they are well maintained, but the effects of these meteorological and hydrodynamic events are not assessed on forehand and therefore unknown. These storm impact effects are for instance the morphological changes of the dunes or whether they will breach, as well as possible damage to NWO’s like beach pavilions, buildings on a boulevard, or nearshore water levels, wave heights and flow velocities. Insight in storm impact effects can answer questions about whether to and where to evacuate a boulevard, the beach, or beach pavilions, whether it is still safe to walk on the beach, swim or windsurf, or whether a boulevard, dune or levee will overflow with water. Hindcast studies about several of these topic have been conducted in the past, but it would be an improvement if water authorities can act quickly during calamities and provide storm impact information to calamity organizations, building owners and inhabitants on forehand, based on a storm forecast.. 1.2.2. Existing storm impact projects. Several storm impact projects were developed as a pilot for operational or research goals, of which three are elaborated on. These projects are currently not used in operational practice, so storm impact information is still not available. The lessons that were learned from the different projects are used to provide criteria and a ideas for the new storm impact application in MorphAn.. HIS-KUST The HIS-Kust4 storm impact framework is a web application that used several pre-defined storm conditions for several locations, water levels, wave heights, wave periods and wave directions. The 1 DUROS+:. DUineROSie model, an empirical model to determine dune erosion based on a schematized post storm profile. The + indicates the updated model, with improvements like a variable wave period. 2 WMCN: Watermanagement Centrum Nederland, the Dutch water management center of Rijkswaterstaat in Lelystad. 3 WHW: Maatgevend Hoogwater, the normative water level for which the levee at Hoek van Holland is designed. 4 HIS-Kust: Hoogwater InformatieSysteem Kust, Dutch for flood information system for the coast..
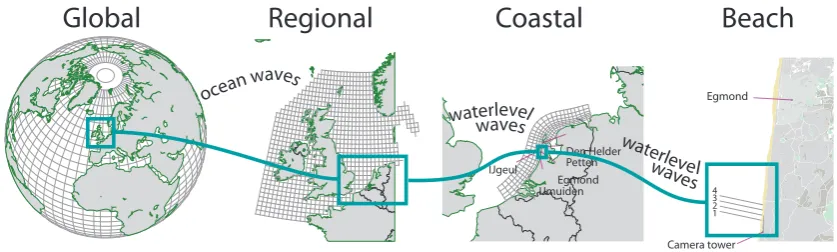
(15) Chapter 1. Introduction. 3. application enabled erosion calculation with DUROS5 for a JARKUS6 transect profile with five storm frequencies and fifty locations along the Dutch coast. (MX Systems, 2007) The HIS-Kust application was located on a remote server and it was terminated after the pilot period in 2007. Because the application uses predefined storm conditions, the results were not based on real forecasts and can therefore not be used to provide insight in the actual storm impact. This makes it difficult to use HIS-Kust for decision making. MICORE MICORE7 is an FP78 project that was conducted from 2008-2011. The project was a pilot that made morphological storm responses for nine European locations available online, available for anyone through a website (Van Dongeren et al., 2009; Haerens et al., 2012). Within the MICORE project, Baart et al. (2009) provided a suitable architecture for the design of an early warning system which is a good representation of such a system in general: Model set-up Beforehand model setup and establishment of input parameters. Data collection Scripts reading basic data (wind data, pressure data, bathymetric data etc.) from one or more data sources (e.g. using plain text files or OPeNDAP protocol). Pre-processing Scripts converting the downloaded basic data to the proper input formats for the model engines. Running model engines Running the numerical implementations of the physical processes using the prepared input to generate predictions. Post-processing Scripts processing and aggregating the raw model output as well as generating charts with information at the proper level of aggregation. Visualization or publishing Post-processed modeling results are published visually. Baart et al. (2009) also reported on the Dutch coast which was one of the nine study areas, specifically the Egmond beach. This Dutch showcase couples four models with decreasing domain size and increasing resolution, depicted in Figure 1.1. These models describe the hydrodynamic, wave and morphologic processes with four nested models: . The global Wave Watch 3 (WW3) model for water levels and waves . The regional Dutch Continental Shelf Model (DCSM) is a Delft3D model for hydrodynamics and waves . The Dutch ”Kuststrook Fijn” coastal model for hydrodynamics and waves . The XBeach model has the highest resolution and entails the smallest area (the Egmond coast beach), for which it predicts the morphological changes Baart et al. (2015) studied the morphological forecast skill of the MICORE model train as a function of lead time and concluded that the forecast system gives a three day lead time for morphological effects of water levels under storm conditions. Besides coupling models, MICORE couples four different data sources for the Dutch part of the project. These are the latest wind speed and direction from online windfield predictions of the HiRLAM project, online water level predictions, a network of wave buoys of Rijkswaterstaat to compare predicted and observed wave heights and annual JARKUS transect measurements to evaluate changes in the coastline. Some of the results of the nine study locations of the MICORE project are still publicly available. The MICORE project was meant to show the capabilities of coupling models and providing open information about calamities. However, this pilot project does not provide results on arbitrary 5 DUROS:. the older version of the DUROS+ model. acronym for ”JAaRlijkse KUStmeting”, the annual Dutch coastal transect measurements that are provided by Rijkswaterstaat. 7 MICORE: Morphological Impacts and COastal Risks induced by Extreme storm events. 8 FP7: the EU Seventh Framework Programme for Research and Technological Development, which was the main instrument for research in Europe from 2007-2013 and has been followed up by Horizon2020 (2014 to 2020). 6 JARKUS:.
(16) 4. Chapter 1. Introduction. Global. Regional ave an w s oce. Coastal wateralevevel w s IJgeul. Beach Egmond. wat erle wavve l es. Den Helder Petten Egmond IJmuiden. 4 3 2 1. Camera tower. Figure 1.1: The coupled models within MICORE (Baart et al., 2015). locations along a coast, the models require much computational power and the project is not in development anymore. Therefore, the project is not sufficient for coastal managers to base decisions on and is not used in operational practice in the Netherlands. RISC-KIT The MICORE project was followed up by RISC-KIT9 in 2013, which aims to provide a set of opensource methods and tools (the RISC-KIT) to support coastal managers and emergency decision makers (Van Dongeren et al., 2014). The Netherlands have only provided an example of what is possible for this project, but will not participate further. Also, because this project is still running, it has less visible results than MICORE. Nevertheless, the existence of this follow-up project shows the need for more storm response research.. 1.2.3. Storm impact information in MorphAn. Both the calamity regulations and the existing storm impact projects show the demand for storm impact information. According to Baart et al. (2009) and Baart et al. (2015), a storm impact or flood forecast function should provide timely access to relevant information of sufficient accuracy, and information about the confidence of the result. A storm impact application aims to show the effects of the current water level and wave forecast on the coast. Water authorities can use the storm impact application to determine whether a dangerous situation occurs and to make decisions accordingly. It is important that the results are realistic, because unnecessary evacuation due to a false positive or a dangerous situation due to a false negative are both undesirable. The previous projects were pilots or research projects that were not used in operational practice because of several reasons. HIS-Kust did not provide accurate or complete information because of scenario assessment instead of real time data. MICORE and RISC-KIT provide accurate results but contain complex models which were set-up for both research projects and cannot be executed with limited computing power. Furthermore, these projects were not meant to become operational and there is no guarantee that the existing models will be maintained. All projects have the disadvantage that they are new and unknown programs, with which potential users have to learn to work with. This study implements an operational storm impact application in MorphAn (Lodder and van Geer, 2012), a computer program where potential users are already acquainted with. A general description of MorphAn is provided in Appendix B. MorphAn provides a clear and simple graphical user interface (GUI) and is the prescribed computer program for dune safety assessment with the DUROS+10 model at coastal water authorities. Additionally, MorphAn provides the possibility to use Python scripting to access a wide range of advanced functions to expand the standard functions. Several possible MorphAn improvements were defined by Veenstra (2015), of which one was a storm impact application that is further developed in the current study. 9 RISC-KIT:. Resilience-Incrasing Strategies for Coasts - toolKIT, the FP7 project that followed op MICORE, which has started in 2013 and will be finished in 2017. 10 DUROS+: the updated version of the DUROS model, which for instance uses a time-varying wave period.
(17) Chapter 1. Introduction. 5. Besides being implemented in a program where potential users can already work with, the storm impact application developed in this study provides realistic results. This is because it uses recent bathymetry data, real-time water level and wave data as well as a hydrodynamic and morphological model calibrated for the Dutch coast. The relevant storm impact information is for instance described by Baart et al. (2009). This study mentions the indicators overtopping, overwashing, beach and dune erosion, dune breach and localized flooding. Other processes that affect the coastal area are for instance wind, wave heights, tide and surge levels in combination with the (effect on the) initial beach profile (Haerens et al., 2012). The important storm impact information selected for this study is the following: Bed levels during the storm The initial bed level and the eventual bed level show the erosion amount from the beach and dunes as well as whether buildings are becoming unstable due to erosion around the foundation. Water levels, wave heights, run-up Water levels typically increase towards the shore, wave heights decrease due to dissipation. Visualizing the combination of both water levels and wave heights shows whether dunes are likely to overtop or overwash. It also indicates whether the water level, waves or the wave run-up reaches the buildings. Building locations In order to show the impact on buildings, their location must be available. Current velocities Fast currents affect swimmer safety and buildings.. 1.3. Research objective and research questions. The research objective of this study is: ”Provide coastal managers with relevant, accurate and timely storm impact information for the coast, by developing, implementing and evaluating a prototype of a robust and operational storm impact application in MorphAn, based on real-time water level and wave forecast data as well as recent bathymetry.” The research questions that have to be answered to achieve the research objective are the following: 1. What are necessary storm impact application components to acquire relevant storm impact information? 2. How can the storm impact information be provided using a storm impact application in MorphAn? 3. What is the quality of the storm impact application? 4. What is the accuracy and performance of the storm impact application results? For each research question, a separate research approach step and a corresponding report chapter is defined.. 1.4. Methodology. There were several choices made prior to the study. The storm impact application that is designed uses live water and wave data, combined with recent bathymetry data as input for a morphological model. The choices that were made, will be briefly described here.. 1.4.1. 1D and 2D bathymetry data. As stated in the MorphAn description in Appendix B, annual 1D JARKUS measurements are often used in the Netherlands as bathymetry data. This is sufficient for areas with low longshore variability and straight coastlines. When longshore variability is higher however, 1D JARKUS.
(18) 6. Chapter 1. Introduction. transect measurements cannot represent the entire coastal bathymetry due to their large spacing. The morphological models that use this 1D bathymetry cannot accurately calculate morphological processes along curved coastlines, because longshore transport is not taken into account. Also, situations where waves obliquely approach the shore can cause 30-50% more erosion because of this longshore transport (Den Heijer, 2013). Furthermore, 2D models enable assessment of the spatial effects of a dune breach or an overwash of a barrier island. For these reasons, also 2D models and bathymetry were considered. First, the 1D version of the storm impact application was made operational. This was followed by further developing the storm impact application such that it also supports 2D grid bathymetry and models. More details about different bathymetry data sources will be provided in Chapter 2.2.. 1.4.2. Water and wave forecast data. The choice was made to use water and wave data from RWsOS11 as input, instead of using a computational expensive model train as in the MICORE project. The latter is more work to implement and maintain, and RWsOS is an already existing and robust system. Furthermore, using RWsOS does not require much computational power. This makes it possible to run the storm impact application on a general laptop, which makes it accessible for coastal managers. The RWsOS system and data will be described in Chapter 2.3. 1.4.3. Morphological model. Up to now, two morphological models were mentioned, DUROS+ and XBeach. XBeach is used in the storm impact application because it models both the hydrodynamic as well as the morphological processes. It is a widely used and validated model for storm impacts on sandy coasts. It also performs better in modeling morphological change then DUROS+, due to the fact that it models the actual processes and does not assume a relatively simple equilibrium dune profile that DUROS+ uses. Because processes are modeled, it is also possible to see the progress trough time, instead of only the eventual result. The fact that it also models the hydrodynamic processes provides insight in water level and wave height variations over the cross shore domain, and thus also near the shore. XBeach can model 1D as well as 2D domains and three modes are available (stationary, surfbeat and non-hydrostatic). Deltares (2015c) derived suitable default settings by validating XBeach with a series of tests for the Dutch coast. These settings were also used in the storm impact application, so it can be applied to the Dutch coast. More details about the XBeach model will be provided in Chapter 2.4.. 1.4.4. Evaluation. The demands and limitations for making the storm impact application operational at water authorities were assessed with seven criteria, depicted in Table 1.1. According to Baart et al. (2009), a storm impact or flood forecast function is only useful if it provides timely access (Speed ) to relevant information (Relevance) of sufficient accuracy (Accuracy). Baart et al. (2015) added that it is also important to provide information on the confidence of a forecast (Performance). Furthermore, for a storm impact application to become operational, its components have to be robust (Robustness), because it should not be dependent on unavailable resources in case of a storm calamity. Also, the results must be clear in order to use them operationally (Understanding). In order to keep the storm impact application up to date and flexible, it must be able to evolve (Evolvibility). The seven criteria were evaluated with for instance literature, a sensitivity analysis and a survey. The different evaluation methods for each of the criteria will be further elaborated on in the relevant steps of the research approach in Chapter 1.5.. 11 RWsOS:. Rijkswaterstaat Samenhangende Operationele Systemen, the operational flood early warning system of the WMCN of Rijkswaterstaat, which also provides water level and wave forecasts for the North Sea..
(19) Chapter 1. Introduction. 7. Table 1.1: Evaluation criteria. Criterion. Description. Speed. Is storm impact information available within a sufficiently small amount of time?. Relevance. Relevant information for supporting coastal managers?. Understanding. Is the storm impact application and the information it provides easily understood by the technical user and decision makers?. Robustness. How robust are the different components of the storm impact application?. Evolvability. Is it suitable for or easy to adapt to other input data or other study areas?. Accuracy. What is the accuracy of the different storm impact application components?. Performance. What is the erosion volume sensitivity predicted by the storm impact application when assessing the component uncertainties?. 1.5. Research approach. The approach that was used for each of the research questions is described in this section. The execution of each of the four research approach steps is elaborated on in a separate chapter.. 1.5.1. Define the storm impact application components. The components of the storm impact application are several bathymetry data sources, RWsOS water level and wave data and an XBeach model. For the bathymetry component several data sources are acquired and the resolution, coverage, accessibility, retrieval method and data format were assessed. The result provides an overview of bathymetry data that is available for the storm impact application. The RWsOS component was assessed by describing the model setup of the data provided through RWsOS, the data format and the retrieval method. The XBeach model component was defined by comparing the three modes of the model, the areas of application and the wave calculation method in both 1D and 2D model domains. The three storm impact application components are described in Chapter 2.. 1.5.2. Implement the storm impact application in MorphAn. The storm impact application in MorphAn combines the RWsOS (water and wave) and bathymetry input data with an XBeach model. Python scripting provides access to a lot of functions and tools in the C# code and this was used to embed these three components into MorphAn. A storm impact application design was made, which encompasses the input data sources and their format, the model and model settings that were used and a design of the operations that the storm impact application in MorphAn performs. The resulting design was discussed with the developer of MorphAn to decide how to implement the function using scripting in Python and how to comply with the used standards and existing functions in MorphAn. This discussion contributes to a more efficient process and also makes the script more general usable, for example in further new functions within MorphAn or DeltaShell. In order to increase understanding, the scripts were concealed with a GUI which is also implemented with the scripting function. The GUI enables the user to gather and visualize the relevant input data from several sources, start the XBeach model with the input and visualize the relevant storm impact information from the input and the model output. The storm impact application implementation in MorphAn is described in Chapter 3..
(20) 8. 1.5.3. Chapter 1. Introduction. Evaluate the quality of the storm impact application. Criteria for the storm impact application were defined with literature in the Methodology in Chapter 1.4. The first five criteria were used to assess the storm impact application itself. Speed was evaluated by comparing the model runtime to the approximately two hours that are available for a storm impact analysis according to coastal managers. Relevance of the storm impact application and its results were evaluated with a survey of coastal managers. Understanding was described and discussed with coastal managers. The criterion Robustness elaborates on the robustness and availability of the different components of the storm impact application (input, model, hardware, access). The criterion Evolvability describes the input availability outside the Netherlands and the expandability of the storm impact application. All these criteria define the quality of the storm impact application in Chapter 4.. 1.5.4. Analyze the results of the storm impact application. Where the first five criteria are about the storm impact application itself, the actual results that are provided by the storm impact application were assessed with the latter two criteria. The Accuracy of the different storm impact application components was determined with literature. The Performance of the storm impact application was assessed by conducting a sensitivity analysis of the component accuracy, with erosion volumes as indicator. These two criteria determine the quality of the results of the storm impact application in Chapter 5..
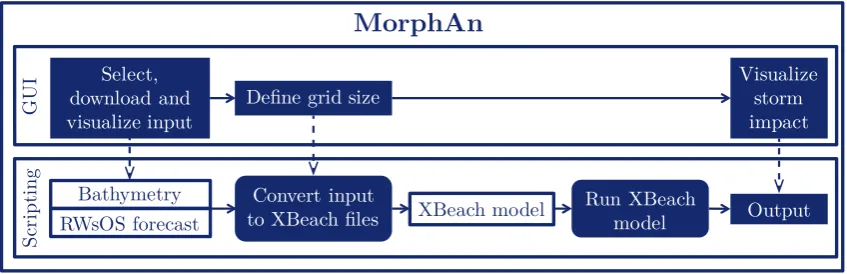
(21) Chapter 2. Components of the storm impact application The storm impact application in MorphAn provides a Graphical User Interface (GUI) where recent bathymetry data and RWsOS water level and wave forecasting data can be easily selected and automatically retrieved from the internet and used as input for an XBeach model.. 2.1. Schematization of the storm impact application. Figure 2.1 shows the schematization of the storm impact application in MorphAn. The white blocks are already existing parts. A description of MorphAn itself is available in Appendix B. For instance, MorphAn contains a GUI and a scripting function, both depicted as white blocks in Figure 2.1. These contain the parts that are added to the GUI and implemented with the scripting function. Again, the white blocks are existing components Bathymetry data, RWsOS forecast data and the XBeach model, that are combined in the storm impact application. Each of these three existing components will be elaborated on in a different section of this chapter. The three existing components join together in MorphAn via the blue blocks, created in this study. The blue rounded blocks are processes implemented with scripting and the blue rectangle blocks are users actions in the GUI, which affect the process. The bathymetry files and RWsOS raw data is selected by the user in the GUI, it is downloaded and converted to XBeach input files in the background, depending on the user-defined grid size in the GUI. The XBeach model runs and creates output in the background, which is visualized with and in the GUI by the user. The new blue blocks will be elaborated on in Chapter 3.. Scripting. GUI. MorphAn Select, download and visualize input Bathymetry RWsOS forecast. Visualize storm impact. Define grid size. Convert input to XBeach files. XBeach model. Run XBeach model. Output. Figure 2.1: Schematization of the storm impact application components (white blocks), processes (blue rounded blocks) and GUI actions (blue blocks) that are used by the GUI in MorphAn.. 9.
(22) 10. Chapter 2. Components of the storm impact application. Figure 2.2: JARKUS data of raai 9795 from 2007 to 2014. 2.2 2.2.1. Bathymetry data Transect bathymetry data. A JARKUS transect is a combined data set of dry and wet measurements. Wet bathymetry data is collected by ships that collect this data on each coastal transect. Dry transect beach data is derived from grid data with a resolution of 5 meters, yearly collected with laser altimetry (Lidar) equipped airplanes. These wet and dry datasets are combined and interpolated for the intertidal area. These transects are made every 250 meter along the Dutch coastline, but this spacing is smaller at several locations. The cross shore resolution is 5 meters on dry land and close to the coast, and 10 meters in deeper water. The yearly measured JARKUS transect dataset is large and is therefore divided into sixteen coastal sections for which data is collected from 1965. The raw JARKUS data of these coastal sections are made available by Rijkswaterstaat as *.jrk files (plain text) on the Open Earth Raw Data (OERD) repository. These data contains some duplicate cross shore locations due to overlapping wet and dry measurements and is written in a format that is somewhat difficult to read automatically with a program. At Deltares, the JARKUS transects are also converted to a large NetCDF1 file. This file contains the filtered JARKUS transect data, without duplicate or missing values. It also includes for instance coordinates for every location on a transect. The NetCDF file is openly available at the Deltares OPeNDAP server and are easier to read into a program than the raw transect files. However, MorphAn releases are equipped with the raw JARKUS transects of the entire Dutch coast up to the year of the release, which makes also these raw files easy to use within MorphAn itself. Both the raw JARKUS transect data from MorphAn as well as the NetCDF file can be used as input bathymetry for the operational 1D model. For the latter however, a Python installation is needed on the users computer, because MorphAn (DeltaShell) does not yet provide the functionality to get a small amount of data from a large online NetCDF file.. 2.2.2. Grid bathymetry data. Grid bathymetry data is available as well. The most accurate bathymetry data are the vaklodingen, which have an accuracy up to approximately 0.5 meters in x and y direction, depending on the collection method (Wiegman et al., 2005). Unfortunately, vaklodingen are collected irregularly, which makes it an unreliable data source for automatic bathymetry retrieval. The lidar beach data is collected each year, but often does not cover all dune rows of the sea defense and no bathymetry at all. Lidar dune data is collected approximately every five years (De Graaf et al., 2003). It would also be possible to combine these data sources with general topographic data of the Netherlands (AHN, Actueel Hoogtebestand Nederland) if the landward extent of the coastal topographic data is not sufficient. However, all of these sources do not provide a reliable and complete data source for automatic bathymetry retrieval yet, and are therefore not used within this study. 1 NetCDF:. a file format which is widely used to store self-describing, machine-independent and array-oriented data. This data can be easily read and interpreted with programs like Matlab, Python, ArcGIS and DeltaShell..
(23) Chapter 2. Components of the storm impact application. (a) Dutch coast, rectangular boxes are the file borders. 11. (b) Sand Engine and Scheveningen Harbour. Figure 2.3: JARKUS grid bathymetry data for (a) the Dutch coast and (b) a more detailed selection of the Sand Engine. This data is available for the entire Dutch coast and originates from the Deltares OPeNDAP server.. A more stable grid bathymetry data source is JARKUS grid data, which is the interpolated version of JARKUS transect data of Rijkswaterstaat. This data has a regular squared grid with a resolution of 20 meters. These NetCDF grid files are also openly available on the Deltares OPeNDAP server, just like the NetCDF transect files. Both the JARKUS transect as well as the grid data files are created almost immediately after Rijkswaterstaat has made the raw JARKUS transect data available on the OERD repository. An example of the JARKUS grid bathymetry data is given in Figure 2.3.. 2.2.3. Real-time bathymetry data. Because the JARKUS grid data is interpolated between the original JARKUS transects, this data is often only sufficient for longshore uniform areas, where analysis of several transects might also suffice. However, Figure 2.2 shows that the non-uniform Sand Engine area is an exception, which is due to a small spacing between transect measurements of sometimes only 50 meters. Nevertheless, many non-uniform areas cannot be represented by the available transect measurements. Furthermore, JARKUS data is collected once a year during the spring, and often already several months old when used for winter storm models. According to Cohen et al. (2009), the bathymetry strongly varies trough the year and the winter profiles contain significantly less volume than the spring profiles. This will be elaborated on in Chapter 5.1. This outdated bathymetry can affect the model output. This can partly be solved by modeling every storm that has occurred since the last bathymetry, and use the output bed level as the input bed level of the next storm, but this can be quite devious for successive storms over a period of multiple months. Furthermore, bed level prediction errors are passed on to the next model and could be amplified with every storm. Therefore, different grid data sources are elaborated on which do not have the above problems. There are possibilities to collect near real-time bathymetry with image or video cameras. These can be used to derive the current topography of the beach (Vousdoukas et al., 2010) or the current state of the intertidal beach bathymetry (Uunk et al., 2010). These Argus cameras can also be used to derive an estimation of the nearshore bathymetry with a method called Beach Wizard, which uses wave roller dissipation, intertidal variations and wave celerity observations that are derived from camera images (Van Dongeren et al., 2008). The accuracy of camera derived bathymetry can be increased by deriving wave celerities with radar data (Van Dongeren and Cohen, 2006). Radar.
(24) 12. Chapter 2. Components of the storm impact application. data can also be used as a standalone source for bathymetry data estimations (Friedman et al., 2014). Both grid and transect bathymetry data can be derived with this Beach Wizard method. A newer method to derive bathymetry from camera images is cBathy (Sembiring, 2015). According to Sembiring et al. (2014), cBathy performs better than Beach Wizard in estimating bathymetry, compared to reference jetski bathymetry measurements. However, cBathy is developed for rip current prediction and therefore is used to produce bathymetry data between the shoreline and a water depth of eight meters. The cBathy longshore resolution is 10m and the cross shore resolution is 3m (Sembiring, 2015). The beach and dune bathymetry are not taken into account, which is important for erosion during storms. Nevertheless, cBathy can be combined with other datasets to provide a complete bathymetry. These real-time bathymetry data sources are often only temporarily available for only some locations and not for the entire Dutch coast. Also, none of the above systems is currently operational or has measurements that are publicly available. However, the necessary equipment for a measurement station can be installed quite easily as well as on arbitrary locations and can therefore be considered a potential bathymetry data source for the storm impact application.. 2.3. RWsOS water level and wave forecast data. A Flood Early Warning System named Delft-FEWS North Sea is developed at Deltares, which is operational at Rijkswaterstaat as the RWsOS system. It produces forecasts of the water levels and wave data like the wave height, direction and period. This system automatically runs four times per day (every six hours) and produces forecasts for 48 hours. It consists of models that predict water levels and wave data. Water levels are predicted with a flood forecasting model for the Northwest European Shelf and North Sea, the Dutch Continental Shelf Model (DCSMv6). This model uses the air pressure and wind forecasts from the HiRLAM2 model of KNMI as boundary condions, which also runs four times per day. (De Kleermaeker et al., 2012) Wave data is generated by a SWAN model for the Dutch Continental Shelf (SWAN-DCSM) and the Southern North Sea (SWAN-ZUNO). The original SWAN wave model was developed by Booij et al. (1999) for computing random, wind generated waves in coastal regions. It is operational at Rijkswaterstaat as a part of RWsOS since 2015. This model consist of two nested grids, depicted in Figure 2.4. The larger DCSM grid has a resolution of 3.6 km and contains the entire Dutch continental shelf, with exception of the Nordic fjords and the Irish sea, to reduce computational time. This model makes use of water levels and current fields from the DCSMv6 model, wind fields from the HiRLAM model and wave boundary spectra from the operational global WAM wave model of the ECMWF3 . The DCSM model provides boundary conditions for the ZUNO model. The ZUNO model entails of the Southern North Sea area and has a curvilinear grid with a variable grid size of 2km offshore to 200 meters nearshore. The output of these RWsOS models is available for registered users via the MATROOS4 database at matroos.rws.nl. The output of the models is checked for outliers with automatic filters, but experts at Rijkswaterstaat also manually check and correct the output. Therefore the RWsOS output can be considered validated and can be used directly. Detailed SWAN wave spectra are calculated and used within the SWAN model, but these are only stored for a very limited amount of locations near harbors. This makes the data source not flexible enough for a storm impact application, and time series of wave characteristics are uses instead. The RWsOS database is used to extract timeseries of water level data (in meters w.r.t NAP5 ) with a timestep of ten minutes 2 HiRLAM:. High Resolution Limited Area Model, a Numerical Weather Prediction model provided by the Royal Dutch Meteorological Institute KNMI. 3 ECMWF: European Centre for Medium-Range Forecast. 4 MATROOS: Multifunctional Access Tool foR Operational Oceandata Services. The operational version of this database is available at Rijkswaterstaat (matroos.rws.nl), for which access is provided by Marc Philippart of RWS-WVL, operational manager of RWsOS. A research version of MATROOS is available at Deltares (matroos.deltares.nl). 5 N.A.P.: Normaal Amsterdams Peil (Amsterdam Ordnance Datum), a vertical datum based on the historical average summer flood reference..
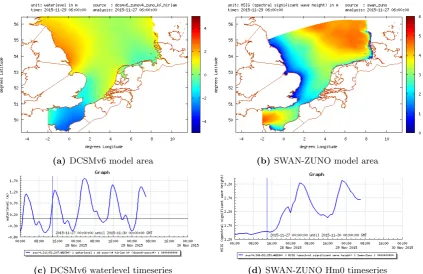
(25) Chapter 2. Components of the storm impact application. 13. Figure 2.4: SWAN operational model area (Gautier and Caires, 2015). to one hour from the DCSMv6 model and timeseries of wave characteristics with a timestep of one hour from the (SWAN-ZUNO) model. This wave data is the significant wave height (Hm0 ), the main wave direction (angle w.r.t North), the spectral wave period (T−1.0 m ) and the swell wave height (swell Hm0 or HE10 ), which is defined as the significant wave height based on the frequency domain 0.03 Hz - 0.10 Hz (Gautier and Caires, 2015). All this data is available on arbitrary coordinates within the RWsOS model grid, which is sufficient to be used as boundary conditions at locations several kilometers from the Dutch coast. Timeseries on the boundary of the model domain are retrieved as text files. It is also possible to retrieve the entire NetCDF file of the different models, but this is not necessary and takes more time. A visual example representation of the RWsOS data is given in Figure 2.5..
(26) 14. Chapter 2. Components of the storm impact application. (a) DCSMv6 model area. (b) SWAN-ZUNO model area. (c) DCSMv6 waterlevel timeseries. (d) SWAN-ZUNO Hm0 timeseries. Figure 2.5: Two RWsOS data model areas and timeseries on an arbitrary coordinate within the models. The model runs are from 27-11-2015 6:00 and provide a forecast of 48 hours. The data is retrieved on 27-11-2015 at 14:00, indicated by the vertical blue line.. 2.4. XBeach model. XBeach (Roelvink et al., 2015) is an open source depth averaged (1D or 2DH) numerical model, developed to simulate hydrodynamic and morphodynamic processes and impacts on sandy coasts with a domain size of kilometers and on the time scale of storms. Within XBeach, there are basically three general levels of detail to choose: The stationary mode is a simplified mode for long term simulations and only solves wave averaged equations. It neglects wave-group variations and thereby infragravity motions. Therefore, the stationary mode is not suitable to model storms. The surf beat mode is the standard XBeach mode and solves short-wave variations and swash of long waves. This is necessary in the swash zone, where time-averaged currents and setup are insufficient. The surf beat mode assumes that long waves are more important during storms than short waves and therefore only calculates the energy that is contained in the short waves, but not the characteristics or form of every individual short wave. Because the individual short waves are not taken into account, this mode cannot calculate short wave runup levels, as well as overtopping and overwash amounts. However, it does calculate long wave runup levels (swash) and also provides an indication whether a dune will overtop or overwash. The non-hydrostatic mode solves all equations with variable pressures, so there are no assumptions needed for long or short waves. However, because each short wave is taken into account and it has to comply to the Courant condition, it requires a very fine grid and small time steps. This results in a significant increase in the computational time compared to the other modes. The advantage is that wave runup for both long and short waves and therefore also overwash amounts can be modeled. The stationary mode is insufficient for a storm impact application because it is not suitable for storms. The non-hydrostatic mode is expected to be too computationally expensive for the time available for a storm impact application run. Also, Deltares (2015b) showed that the non-.
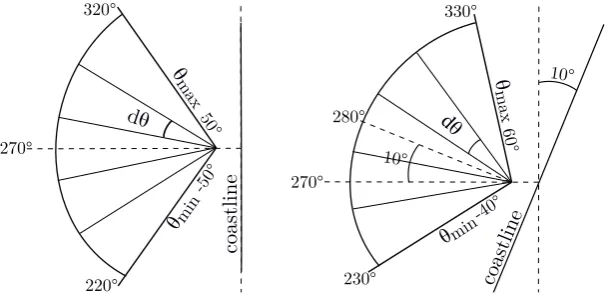
(27) Chapter 2. Components of the storm impact application. Calm conditions Swash zone. Infragravity dominated. 15. Storm conditions. Mixed engery. Infragravity dominated. Breaker zone. Mixed energy Short wave dominated. Shoaling zone. Short wave dominated. Deep water Highly reflective (gravely/structures). Dissipative (sandy). Dissipative (sandy). Highly reflective (gravely/structures). Figure 2.6: This figure from Deltares (2015b) shows calm and storm conditions: the dominant wave processes (black dashed lines), the dynamic zone where morphologic changes occur (brown dotted line) and the short wave parameterization performance (well/green, okay/orange, poorly/red). The black circle denotes their overlap: the area where short waves are relevant, its parameterization is insufficient and there are morphologic changes occurring. These areas should be modeled with the non-hydrostatic mode. Dissipative beaches in storm conditions can be modeled well without it. 320°. 330°. dθ. °. 220°. 10°. 270°. °. -40 n i θm. stli ne. coastline. θm. in. -50 °. 270°. 230°. c oa. 50. 280°. ° θmax 60. ax. θm dθ. 10°. Figure 2.7: Wave angles and bins for different coastline rotations. In the left example, only waves from 220°to 320°with respect to the North can enter the model. In the right example, the coastline rotation of 10°allows waves from 230°to 330°with respect to the north to enter the model. The values for θmin and θmax are with respect to the baseline of 270°with respect to the north.. hydrostatic mode is not necessary for storm conditions on dissipative beaches (Figure 2.6). Therefore, XBeach is used in the surf beat mode. The XBeach executable uses multiple input files that contain input parameters, x and y coordinates, initial bed levels, water level time series and wave characteristic time series. The contents of these files are described in Appendix C. XBeach works with wave bins of which the range is defined by θmin and θmax and the number of bins is derived from dθ. Figure 2.7 shows an example of a coastline with an orientation of 0°with respect to the North. θmin is -50°and θmax is 50°with respect to a line perpendicular to the coastline. dθ is 20°, which results in five wave bins. These waves enter the model and can only propagate within the wave bins. If they refract, they switch from one bin to another. More wave bins increase the computational time, and a larger absolute value for θmin and θmax increases the amount of waves that can enter the model. Values of -90°and +90°would include all the waves in the direction of the coast line. To save computational time in MorphAn, θmin and θmax are currently limited to -50°and +50°, with a dθ of 20°, as in Figure 2.7. In 1D mode, wave propagation and refraction of oblique waves is estimated with a quick Snell’s law estimation. This causes all waves to refract in cross shore direction, where the longshore component of the wave energy is lost. The Snell’s law estimation results in less realistic hydrodynamic processes and is therefore not used in 2D mode. With the applied 2D XBeach settings, the waves only enter.
(28) 16. Chapter 2. Components of the storm impact application. the model domain trough the offshore boundary. This means that some of the oblique waves cannot reach the entire shoreline of the model domain, which results in a triangular shadow zone at the side boundaries of the model domain. The hydrodynamic and morphological results are less reliable in these shadow zones, so the area of interest should not be located there. In order to overcome this problem, the model domain is extended so all waves reach the area of interest, Chapter 3 elaborates this solution..
(29) Chapter 3. Implementation in MorphAn (coupling of the components and GUI) The schematization in Figure 2.1 briefly summarizes the new functions that were implemented for the storm impact application. A Graphical User Interface (GUI) is designed and partly developed to make the storm impact application prototype operational for coastal managers, by providing the functionality without having to use the Python script. The steps that the user takes in the GUI are elaborated on in this chapter and can therefore be used as a user manual. Because the current storm impact application is a prototype, not all functionality is implemented as described in this chapter yet, but these are marked with a star (?). Chapter 3.5 will briefly elaborate on the differences from the ideal and the current GUI implementation. The base of the GUI is a project tree (?), depicted in Figure 3.1. This screen is divided in input and output, which both have sub-items that will be elaborated on in this chapter.. Figure 3.1: Project tree screen (?). 17.
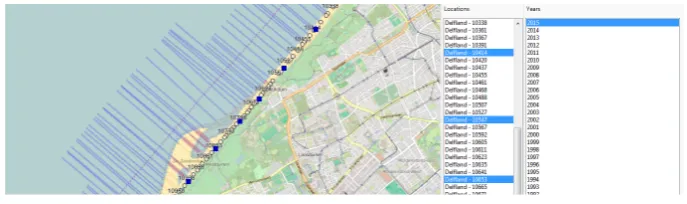
(30) 18. Chapter 3. Implementation in MorphAn (coupling of the components and GUI). 3.1. Technical prerequisites. There are some technical prerequisites in order for the storm impact application to work: . Windows computer with MorphAn 1.4 or higher installed, including the optional components Scripting and XBeach . XBeach Kingsday release (v1.22 or later, including NetCDF) executable to replace the MorphAn XBeach Groundhog Day release (v1.21) executable in the MorphAn installation folder . storm impact application scripts (from the SVN repository) in the MorphAn scripting folder . RWsOS MATROOS credentials (or a Deltares connection for Deltares MATROOS) . An internet connection for RWsOS data and for non-MorphAn bathymetry data . Optional: a Python (Anaconda) installation, if JARKUS data is retrieved from OPeNDAP . Optional: building data in strandtenten.txt (Appendix C) . Optional: building data in a shapefile (?) Appendix D elaborates on how to get the (installation) files, how to install and where to apply for credentials.. 3.2 3.2.1. Input Parameters. The current storm impact application prototype has several input options of which the most important are described here. The input parameters can be filled in by the user, currently in the pop-up screen in Figure 3.2. This input screen will be embedded under the Parameters button in the project tree in Figure 3.1 (?). The input options are divided into Bathymetry related options, RWsOS related options and options for the XBeach model grid and result plots. For the bathymetry, a choice between 1D and 2D sources can be made (bathy). Four types of bathymetry are now implemented: JARKUS transects from MorphAn, JARKUS transects from OPeNDAP, JARKUS grids from OPeNDAP and Beach Wizard grids. Furthermore, the year for which to retrieve the bathymetry is necessary, which will often be the most recent measurement year (year ). The list of transect numbers or area to analyze is selected at the bathymetry input (raailist). More on the bathymetry input data is elaborated on in Chapter 3.2.2. The RWsOS related options entail the source server (Deltares or Rijkswaterstaat, matroos), the start date and time of the analysis (tsmat tstart, in the format yyyymmddhhmm) and the period for which water level and wave data is retrieved from the server (datahours, in hours). The geographic location for which the RWsOS data is retrieved, is automatically determined by the selected bathymetry input. More on the RWsOS input data is elaborated on in Chapter 3.2.3. The XBeach model grid options are the number of grid cells in longshore y-direction (ny) and their size (XB dy). The number of grid cells in cross shore x-direction (nx) and their size (dx) is automatically determined at the bathymtery input and is therefore not user defined. The cross shore transect of the model grid that is visualized is defined by y sel. The XBeach model run itself elaborated on in Chapter 3.3. After the input parameters are provided, a folder structure is created where files will be stored later on. Folders are created for the bathymetry, RWsOS data and the XBeach model.. 3.2.2. Bathymetry. In the 1D mode of the storm impact application, the transect locations and the measurement year that will be analyzed are selected in a map or from a list like Figure 3.3 (?). The JARKUS transects will be retrieved from the MorphAn installation or from the Deltares OPeNDAP server. The resolution of these transects is high enough for XBeach and is therefore not optimized. JARKUS.
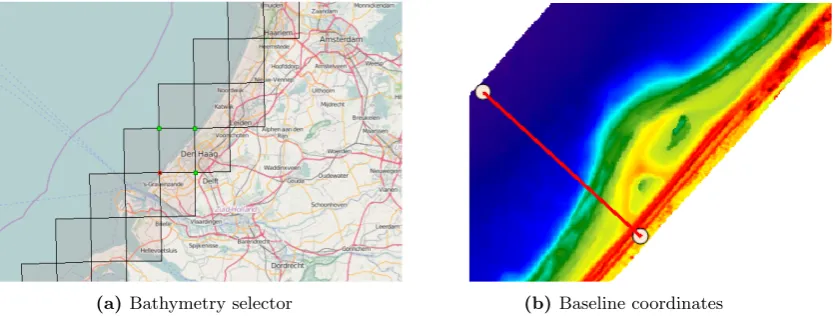
(31) Chapter 3. Implementation in MorphAn (coupling of the components and GUI). (a) 1D example input. 19. (b) 2D example input. Figure 3.2: Pop-up input screen. Figure 3.3: 1D JARKUS bathymetry selector (?). transect bathymetry often reaches to a depth of approximately NAP -10m, which is extended with a hard coded constant slope of 1:50, to a depth of NAP -20 meters in order to allow the long waves to travel into the model domain without disturbance. The coordinate of the new seaward boundary of the transect is used as location where the RWsOS data is retrieved. The coordinates of the transect points and the bathymetry on these points is written to several XBeach input files (Appendix C). When the 2D mode is used, 2D JARKUS bathymetry files can be selected in the window in Figure 3.4a. This file of approximately 150MB will then be downloaded from the Deltares OPeNDAP server. It is also possible to use other types of grid bathymetry files like Beach Wizard data, but then the file must be downloaded manually and the filename must be provided. The bathymetry data is displayed in a map, where a baseline for the model grid is drawn by the user, perpendicular to the coastline (Figure 3.4b). This baseline is part the left border of the model grid, as seen from the coast. Subsequently, a grid is automatically created based on the baseline and the user-defined number of gridcells in longshore direction (ny) and the cell width (dy). Figure 3.5 shows how this grid is defined. The origin (xori , yori ) is in RD1 coordinates (e.g. 70000, 460000). The rotation α is positive in clockwise direction, which corresponds with the coastline rotation 1 RD:. RijksDriehoek coordinate system used mainly in the Netherlands with its reference point in a church Amersfoort (155000, 463000) and its apparent origin in France. RD is a rectangular coordinate system where x and y values are distances in meters..
(32) 20. Chapter 3. Implementation in MorphAn (coupling of the components and GUI). (a) Bathymetry selector. (b) Baseline coordinates. Figure 3.4: GUI interface where (a) a 2D JARKUS bathymetry file is selected and downloaded and (b) any 2D bathymetry is shown in a map where the boundary coordinates for the XBeach grid baseline can be selected.. with respect to the North. The RD values for all (x,y) coordinates are defined in Equation 3.1 and 3.2, where x’ (y’) is the x-distance (y-distance) from the origin of the grid (xori , yori ) in meters. The origin is near the seaward coordinate of the user-defined baseline. x = xori + y 0 sin(α) + x0 cos(α). (3.1). y = yori + y 0 cos(α) − x0 sin(α). (3.2). It is also possible to use the 2D bathymetry data for a 1D transect analysis by providing ny=1 (one grid cell in longshore direction, two ’transects’) and the 1D wavebin settings (snells=1, dθ=100 and no extended grid) (?). The number of grid cells in cross-shore direction (nx) and the variable length of these grid cells (dx) are automatically determined. The nx is kept as low as possible to reduce the model runtime, while keeping the Courant number (Equation 3.3) just below Cmax = 0.9 in order to keep the explicit numerical scheme of XBeach stable. This optimization function is already embedded in MorphAn. u ∆t C= ≤ Cmax (3.3) ∆x The variable dx is determined on every grid cell in cross shore direction by using a default value for ∆t as well as a calculated velocity u (which is calculated with a fixed water level, a fixed wave height and the given bathymetry). During the model run, the dx of each grid cell and the actual velocity are used by XBeach to determine a suitable time step ∆t. When the Courant number is small (C < 0.5), the time step ∆t will be small and the runtime will increase. When the Courant number is too large (C > 1.0), the larger time step ∆t might cause instability in the numerical scheme. Furthermore, waves must be able to enter the model domain without disturbance which would cause initial energy loss. This is only possible if the seaward boundary is in deep water, which is defined as a water depth equal to or larger than half of the wave length. Therefore, in both the 1D as well as the 2D mode, the bathymetry is extended in seaward direction with a constant slope of 1:50, to a depth of NAP -20m. This depth is often used in XBeach models (Roelvink et al., 2015). The data of the underlaying bathymetry layer is evaluated to the curvilinear model grid. When the bathymetry layer has a coarse resolution, like for instance the JARKUS grid data (20x20m), the four surrounding values are interpolated by inverse distance weighing. The coordinates of each of the gridpoints, the evaluated bathymetry and the grid dimensions are then written to different XBeach input files (Appendix C). It is possible that the resulting grid (Figure 3.6) is not satisfactory. It for instance covers a too small or too large domain, the resolution is inadequate or the grid does not follow the coastline. Then, the input values for ny and XB dy can be changed or a new baseline can be drawn, after which a new grid can be created..
Figure


+7


Related documents
These results are not indicative of any specific invest- ment and show a constant rate of return, where an actual investment will fluctuate in value.. It does not include fees
Onderwerp Effect van het uitstellen van archeologisch vooronderzoek met ingreep in de bodem op het aantal werkdagen nodig voor het uitvoeren ervan, inclusief rapportering,
As expected, the TCDD-resistant DBA/2 mouse liver showed a transcriptional response following only the high dose of TCDD, while the sensitive C57BL/6 and rWT strains
Estimated post-smolt survival for hatchery reared salmon females in river Dalälven released between 1989-2010 and estimated index of Grey seal population in the Baltic Sea.. From
The role of the Manager of Occupational Therapy Services North is to work within the Mission and Mission in Action of HammondCare to lead and develop high quality efficient
On completion of the course, graduates will have the knowledge and skills required to undertake an Australian Maritime Safety Authority (AMSA) oral examination for Certificate of
A popular story told in Deaf culture is the story of a deaf person finally gaining access to American Sign Language after a life trapped in oralism or hearing culture.
Remember the Children, our mission partner who serves the Roma or “Gypsy” kids of Roma- nia, is now providing these kids with gifts of toiletries and other personal items called
