A Thesis Submitted for the Degree of EngD at the University of Warwick
http://go.warwick.ac.uk/wrap/51918
This thesis is made available online and is protected by original copyright. Please scroll down to view the document itself.
UNIVERSITY OF WARWICK
FACULTY OF SCIENCE
WMG
Engineering Doctorate
Innovation Report
Author
Mr Kylash Makenji, M.Sc., CEng
Submitted December 2011
Academic Mentors
Professor Gordon Smith and Dr Vannessa Goodship
i
ABSTRACT
There are numerous techniques that can be used for the decoration of polymeric substrates, dye sublimation, self-colouring, paint spraying, granular injection paint technology, pad printing, in-mould decoration and hot foil stamping. Dye sublimation was selected for this research as it was found to be both the most relevant technology area for IDT Systems Limited and the least understood. It is a customisable digital process which uses specialist Cyan, Magenta, Yellow and Black (CMYK) inkjet-able dyes that are transferred into a substrate via a carrier. During the process heat is applied which transforms the dyes from a solid into a gas phase. Analysis of literature identified a number of knowledge gaps, which are addressed during this research and detailed in this report.
Initial experimentation concluded that the sublimation dyes can penetrate a range of commercially available amorphous polymers, comparably to semi-crystalline types. These findings dispute previously published work, but these also lacked rigorously recorded methodologies to confirm comparable data. All of the materials, equipment and methodologies used throughout this research were therefore developed in this report.
Further detailed experimentation was completed, using amorphous polycarbonate, (PC) and semi-crystalline polybutylene terephthalate, (PBT) focusing on the process time and temperature to understand their influence on the level of dye penetration. The results revealed that increasing the process temperature and time improves the level of dye penetration and that comparable penetration levels were noted at 140-180 oC. Further research identified the importance of free volume in the polymer, this increases in size and connectivity as temperature increases above the glass transition points. Additional experimentation confirms that the free volume enables the dyes to penetrate into the polymer.
Characterisation of the CMYK sublimation dyes was completed using Differential Scanning Calorimetry enabling the thermal transitions to be identified. Visual experimentation confirmed that the dyes start and finish sublimation between 145-210oC.
As no software tool existed to visualise the dye penetration, one was developed using MatLab. The tool imports and then interpolates the data and graphically outputs it for the user. This allows a quicker set up time of the process and reduces the number of samples to be destroyed.
ii
ACKNOWLEDGEMENTS
I would like to extend my deepest thanks for the kind assistance and support from Professor Gordon Smith and Dr Vannessa Goodship; I would also like to thank everyone at WMG for their time, assistance and expert knowledge.
Furthermore I am deeply grateful for the assistance provided by my generous industrial sponsor, IDT Systems Limited, particularly Mr Peter Woodd and the team for their support throughout this process.
I would like to thank the Engineering and Physical Sciences Research Council for kindly funding this programme.
iii
ENGINEERING DOCTORATE MENTORS
Academic Mentors-Professor Gordon Smith, Dr Vannessa Goodship
Industrial Mentor-Mr Peter Woodd
INDUSTRIAL SPONSOR FOR THIS RESEARCH
IDT Systems Limited / The Factory / Dippenhall / Farnham / Surrey / GU10 5DW, Tel 01252 726080 / Website www.idt-systems.com
DECLARATION
I hereby declare that all of the work contained in this report was produced by the author and that none of the work has been previously submitted for an academic degree. All sources of quoted work have been referenced accordingly
iv
TABLE OF CONTENTS
ABSTRACT...i
ACKNOWLEDGEMENTS...ii
ENGINEERING DOCTORATE MENTORS ... iii
INDUSTRIAL SPONSOR FOR THIS RESEARCH... iii
DECLARATION ... iii
TABLE OF CONTENTS... iv
LIST OF FIGURES... vi
LIST OF TABLES... viii
FREQUENTLY USED ABBREVIATIONS ... ix
1. INTRODUCTION...1
1.1. INNOVATIONS FROM THIS RESEARCH...2
1.2. RESEARCH DISSEMINATION...2
1.3. RESEARCH EXPLOITATION AND IMPACT...3
1.4. RESEARCH METHODOLOGY AND REPORT STRUCTURE...4
2. OUTCOMES FROM THE LITERATURE REVIEW...6
2.1. DYE SUBLIMATION KNOWLEDGE GAPS ...8
3. INTRODUCTION TO EXPERIMENTATION UNDERTAKEN IN THIS RESEARCH...10
3.1. MATERIALS USED IN THE EXPERIMENTATION...10
3.1.1. THE SUBSTRATE POLYMERS...10
3.1.2. THE SUBLIMATION DYES...11
3.1.3. THE TRANSFER CARRIER...12
3.2. EXPERIMENTAL DESIGN AND EQUIPMENT USED ...12
3.2.1. THE DESIGN OF THE INITIAL DYE PENETRATION EXPERIMENTATION...13
3.2.2. DESIGN OF THE EXTENDED DYE PENETRATION EXPERIMENTATION ...15
3.2.3. THERMAL CHARACTERISATION OF THE SUBLIMATION DYES...15
3.3. THE OPTIMUM LEVEL OF DYE PENETRATION...17
3.4. DYE PENETRATION MEASUREMENT METHODOLOGY...18
4. EXPERIMENTAL RESULTS ...19
4.1. THE INITIAL DYE PENETRATION EXPERIMENTAL RESULTS ...19
4.2. THE EXTENDED DYE PENETRATION EXPERIMENTAL RESULTS...19
4.3. THE THERMAL CHARACTERISATION EXPERIMENTAL RESULTS ...20
5. ANALYSIS AND DISCUSSION OF THE DYE PENETRATION EXPERIMENTATION ....24
5.1. ANALYSIS AND DISCUSSION OF THE INITIAL EXPERIMENTATION ...24
5.1.1. SECTION CONCLUSIONS...25
5.2. ANALYSIS AND DISCUSSION OF THE EXTENDED EXPERIMENTATION ...26
5.2.1. AMORPHOUS PC ...26
5.2.2. SEMI-CRYSTALLINE PBT...29
5.2.3. COMPARISON BETWEEN THE PC AND PBT RESULTS...32
5.2.4. RATE OF DYE PENETRATION ...32
v
5.2.5.1. FURTHER EXPERIMENTATION USING FREE VOLUME ...39
5.2.6. THE DYE DEPTH PENETRATION MEASUREMENT ERRORS ...41
5.2.7. VISUAL APPRAISAL OF THE SUBSTRATE DECORATION ...42
5.2.8. VISUAL APPRAISAL OF THE SUBSTRATE SURFACE ...46
5.2.9. SECTION CONCLUSIONS...49
6. ANALYSIS AND DISCUSSION OF THE DYE THERMAL CHARACTERISATION ...55
6.1. SECTION CONCLUSIONS...59
7. VISUALISATION OF THE DYE PENETRATION USING MATLAB ...63
7.1. INTRODUCTION TO THE MATLAB PROGRAMME...63
7.2. THE MATLAB PROGRAMME...63
7.3. GRAPHICAL OUTPUTS ...65
7.3.1. PC GRAPHICAL OUTPUTS OF THE DYE PENETRATION DEPTH ...65
7.3.2. PBT GRAPHICAL OUTPUTS OF THE DYE PENETRATION DEPTH ...67
7.4. SECTION CONCLUSIONS...68
8. OVERALL CONCLUSIONS TO THE RESEARCH ...69
9. BENEFITS OF THE RESEARCH TO IDT SYSTEMS LIMITED...72
9.1. BENEFITS FROM THE DYE PENETRATION EXPERIMENTATION ...72
9.2. BENEFITS FROM THE THERMAL CHARACTERISATION OF THE DYE MATERIALS..72
9.3. BENEFITS OF THE MATLAB VISUALISATION TOOL...73
9.4. IMPACT TO PRODUCTION COSTS ADOPTING THE OPTIMISED PROCESS ...73
10. LIMITATIONS OF THE RESEARCH AND FURTHER WORK...76
vi
LIST OF FIGURES
Figure 1 The Engineering Doctorate research methodology...5
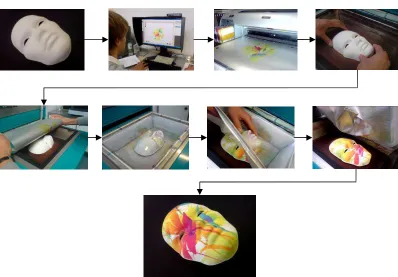
Figure 2 The IDT i-SDS transfer process...7
Figure 3 Dye penetration depths published by Adams (Adams, 2007)...8
Figure 4 The CMYK test print ...12
Figure 5 Schematic of the transfer press arrangement...13
Figure 6 Photograph of the dye sublimation decorated component...14
Figure 7 IDT D6.3 transfer press ...14
Figure 8 Image of a Mettler Toledo DSC1...16
Figure 9 Illustration of “Y” dye penetration into PBT ...18
Figure 10 DSC results for all colours ...20
Figure 11 ”K” dye material with the thermal transitions labelled...21
Figure 12 “Y” DSC plot showing the visual effects of the thermal loading...23
Figure 13 PC Average dye penetration depths with error bars...27
Figure 14 PC Average dye penetration measurements for CMYK colours...28
Figure 15 PBT Average dye penetration depths with error bars...29
Figure 16 PBT Average CMYK dye penetration measurements ...31
Figure 17 PC and PBT Average dye penetration depth measurements ...32
Figure 18 PC and PBT average rate of penetration ...33
Figure 19 Graph to show free volume of polymers below and above Tg...34
Figure 20 Graph of free volume in PC measured using PALS ...37
Figure 21 PBT with “M” dye displaying the measurement difficulty ...41
Figure 22 PBT with “M” dye at 160oC ...42
Figure 23 PC Photographs of the decorated substrates at 140 - 200oC ...43
Figure 24 PC Photograph of the surface showing a “faint” decoration ...44
Figure 25 PC Photograph of the surface showing a “blurry” decoration ...44
Figure 26 PBT Photographs of the decorated substrates at 140 -200oC ...44
Figure 27 PBT Photograph of a faint decorated surface...45
Figure 28 PC Photograph of the surface showing thermal damage...46
Figure 29 PC Photograph of the surface showing no thermal damage...46
vii
Figure 31 PBT Graph of DMTA results ...48
Figure 32 PC Free volume overlaid onto the Tg...51
Figure 33 PBT Free volume overlaid between the Tgand Tm...52
Figure 34 TP1and TP2, plotted with the water content for all colours...56
Figure 35 Thermal transitions and ranges of the dye materials...57
Figure 36 Plot of increased ramp rates for the “Y” dye material ...59
Figure 37 Average DSC results and average dye penetration depths PC & PBT ...60
Figure 38 Average DSC results plotted with the DMTA results of PC...61
Figure 39 Average DSC results plotted with the DMTA results of PBT...62
Figure 40 PBT “C” surface graph of the dye penetration depth...64
Figure 41 PBT “C” contour plot data of the dye penetration depth...64
Figure 42 PC Individual contour plots of CMYK colours ...65
Figure 43 PC Contour plot of average dye penetration depth ...66
Figure 44 PBT Individual contour plots of CMYK colours ...67
viii
LIST OF TABLES
Table 1 IDT Customer list and website details...4
Table 2 Details of the portfolio submissions ...5
Table 3 Experimental polymer substrates ...10
Table 4 Dye material composition...11
Table 5 Dye sublimation experimentation parameters...14
Table 6 Average dye penetration depth measurements by material and colour ...19
Table 7 PC and PBT dye penetration results...20
Table 8 Thermal transitions, enthalpy and water content for the dye materials ...22
Table 9 Comparison of Adams and the author’s initial experimental data...24
Table 10 PC Visual chart of deepest and shallowest dye penetration depths ...28
Table 11 PBT Visual chart of deepest and shallowest dye penetration depths ...30
Table 12 List of different polymers types with densities and free volume ...36
Table 13 PBT Free volume dye penetration experimentation ...40
Table 14 Visual appraisals of PC and PBT decorated substrates ...42
Table 15 PC& PBT Acceptable process settings and dye penetration depths...54
Table 16 Calculated process costs ...74
Table 17 PC & PBT Cost per cycle to produce acceptable specimens ...74
ix
FREQUENTLY USED ABBREVIATIONS
The list below contains some of the commonly used abbreviations found within this report. .
B Blurry
C Cyan
DEG Di-ethylene Glycol
DMTA Dynamic mechanical thermal analysis
DSC Differential scanning calorimetry
F Faint
IMD In mould decoration
K Key (Black)
M Magenta
oC Degrees Celsius
OK Okay
PALS Positron annihilation lifetime spectroscopy
PBT Polybutylene terephthalate
PC Polycarbonate
PET Polyethylene terephthalate
PP Polypropylene
TC extrapolated completion temperature
TC Transfer carrier
TD Thermal damage
TE1 1stextrapolated onset temperature TE2 2ndextrapolated onset temperature
Tg Glass transition temperature
Tm Melt transition temperature
TP1- 1sttemperature peak TP2 2ndtemperature peak
TP3 3rdtemperature peak
1
1. INTRODUCTION
At the dawn of this programme it was evident that very little quality research was available regarding the dye sublimation process analysis of literature reviews yielded large knowledge gaps. The sponsor company, who has been a part of this technology for over 15 years, confirmed that this was the state of affairs within this industry.
The aim of the Engineering Doctorate, (EngD) is to create and exploit new innovations in the dye sublimation process. This is achieved by understanding the process fundamentals enabling industry to select from a wider range of materials and ensure the dyes are optimally processed.
The dye sublimation process relies on a considerable amount of testing and evaluation time to generate a consumer ready component (Barrow, 2010). The software based dye penetration visualisation tool discussed in section 7 was developed by the author to reduce the costly sampling and measuring time, currently taken.
2
1.1. INNOVATIONS FROM THIS RESEARCH
The list below contains the innovations the author has created from the research during the period of the EngD. The innovations
are:- The capability to use amorphous polymers in the dye sublimation process, where they were previously thought to be unsuitable, thereby extending the range of material usage for IDT Systems Limited, (IDT) to exploit with this technology
The ability to use the time and temperature parameters to control the level of dye penetration into the polymer, thereby allowing IDT to control the lifetime of the surface decoration
The establishment of a methodology for assessing the suitability of new polymers in the dye sublimation process, thereby allowing IDT to quickly assess new materials.
Identification of the key thermal transitions of the dyes in the process when sublimation starts and ends and linking this knowledge to the dye sublimation process. This allows IDT to establish quality control of their raw material suppliers.
The creation of a visualisation tool in Matlab to establish ideal processing set up conditions for the acceptable level of dye penetration. This reduces wastage of parts during evaluation.
Further as a contribution to knowledge this work has also highlighted the importance of free volume as a mechanism for the transportation of the dye into and through the polymer.
1.2. RESEARCH DISSEMINATION
3 Another method of dissemination was the University of Warwick 2010 poster competition where the author won a runner up prize. The poster contained the salient points of the research objectives and findings; these had to be verbally conveyed to a judging panel (Makenji, 2010).The final mode of dissemination was the publication of the patent titled “Improvements in Dye Sublimation” detailed in portfolio submission 6 (Makenji and Baumber, 2010). The patent describes a new method for processing the dye sublimation technology. It was conceived as a result of the experimentation completed in portfolio submission 3.
1.3. RESEARCH EXPLOITATION AND IMPACT
This research has enabled IDT to commercially exploit the use of polymers previously thought of as being unsuitable for the process. One of the recent exploitations is the offshoot business, “Who’s On Your Case” where consumers can order personally decorated polycarbonate mobile phone cases (It’s my case, 2011, Who’s on your case, 2011). Table 1 shows IDT Systems customer projects, where the research has been of direct or indirect commercial benefit. These are considered in this context as they have enabled IDT Systems to test, trial or use semi-crystalline polymers in the process where this was previously thought as being unsuitable. Alternatively this research has enabled them to applying the innovations from the EngD which enables by them to achieve aesthetically pleasing components in a short space of time without significant destructive testing.
4
Table 1 IDT Customer list and website details
Customer Website details
IDT Systems, Who’s on your case www.whosonyourcase.com
Uncommon www.getuncommon.com
Microsoft www.microsoft.com
Dell www.dell.com
ATI www.atigunstocks.com
Casemate www.case-mate.com
Flextronics www.flextronics.com
Tom Tom www.tomtom.com
Oakley www.oakley.com
1.4. RESEARCH METHODOLOGY AND REPORT STRUCTURE
This innovation report is structured to follow the progress of the Engineering Doctorate and theportfolio submissions. Firstly there was a need to research the various techniques for the surface decoration of polymers, including materials, process and industrial practises. This was completed using secondary data sources such as peer reviewed journals, publications, articles, books and the internet. Most of this was completed using the University of Warwick library resources and data bases such as Science Direct and Compendex. IDT was an invaluable source of knowledge, given the lack of published data and vast amount of industrial experience they have with the surface decoration of substrates. This combined use of academic and industrial resources led to the identification of knowledge gaps, located in section 2.1 of this report. Due to the lack of published knowledge with the dye sublimation process these gaps were addressed by designing and completing primary experimentation.
5
Figure 1 The Engineering Doctorate research methodology
[image:16.595.68.530.506.733.2]Section 7 presents details on a dye penetration depth visualisation tool developed using MATLAB. Section 8 contains overall conclusions of the research and experimentation. Section 9 highlights the benefits of the research to IDT and includes a section which identifies some financial gains of using the optimised process highlighted in this report. Section 10 contains suggested further work and the references are located in section 11. Table 2 lists theportfolio submissionscompleted during the EngD, these will be referred to for further explanation or detail within this report.
Table 2 Details of the portfolio submissions
No Portfolio submission title Report section
1 Colourful Decoration Techniques for Plastic Injection Moulded Parts
Suitable for Mass Customisation 2 & 2.1
2 Initial Dye Sublimation Experimentation, Methods and Materials 3, 4 & 5
3 The Penetration Performance of Sublimation Dyes into Semi-crystalline
and Amorphous Polymers 3, 4 & 5
4 The Thermal Characteristics of Sublimation Dyes 3, 4 & 6
5 Visualisation of the Dye Penetration Depth using Matlab 7
6 Patent 1.3
7 Journal publication 1.3
8 Personal Profile n/a
6
2. OUTCOMES FROM THE LITERATURE REVIEW
Injection moulding of polymers is a common manufacturing technique used to create parts (Xanthos, 2002). These components sometimes require surface decoration to make them more appealing to consumers. A literature review of current practises was completed, to select a decoration technique which could be used to mass customise parts manufactured from polymers. Ideally the process should not have too many process stages, be environmentally friendly and low cost, whilst achieving an aesthetically pleasing surface. Dye sublimation, (Adams, 2007, Sherman, 2005) self-colouring of polymers (Margolis and Meyer, 1986) wet paint spraying, (Stoye and Freitag, 2007) granular injection paint technology, (Smith and Easterlow, 1996) pad printing, (Berins. M, 1991) in-mould decoration, (Love and Goodship, 2002) and hot foil stamping (Margolis and Meyer, 1986) technologies were explored. Details of the processes, material used, advantages and disadvantages are provided inportfolio submission 1. Direct inkjet printing is also possible but it has limitations when compared to dye sublimation. It has a low print resolution, the dyes sit on the surface of the polymer and do not penetrate into it and finally the decoration can only be completed on substrates with a flat geometry (Barrow 2010).
Dye sublimation was selected as the ideal surface decoration technology for plastic parts based on a number of criteria. The process needs no pre or post treatments, it is environmentally friendly and equipment costs are not prohibitive. It can achieve aesthetically pleasing surface decorations and allows the user to mass customise (Adams, 2007, Sherman, 2005). Dye sublimation achieves these criteria better than the other technologies explored.
7 The digital nature of the process is highly suitable for mass customisation enabling individual part decoration without incurring unnecessary set up or additional costs (Adams, 2007, Barrow, 2010). The state of the art systems can enable the process to be used on complex geometry components, by vacuum forming a TC around the substrate prior to the dyes being sublimated.
Figure 2 The IDT i-SDS transfer process
8
2.1. DYE SUBLIMATION KNOWLEDGE GAPS
Dye sublimation has very little published research available to review; it does appear to be a very “cottage” type of technology and would benefit with contribution to practise. Analysis of the literature highlights a number of knowledge gaps, which have been listed below. The objectives of this research are to address the knowledge gaps through experimentation and through analysis and insight provide innovations that IDT can exploit.
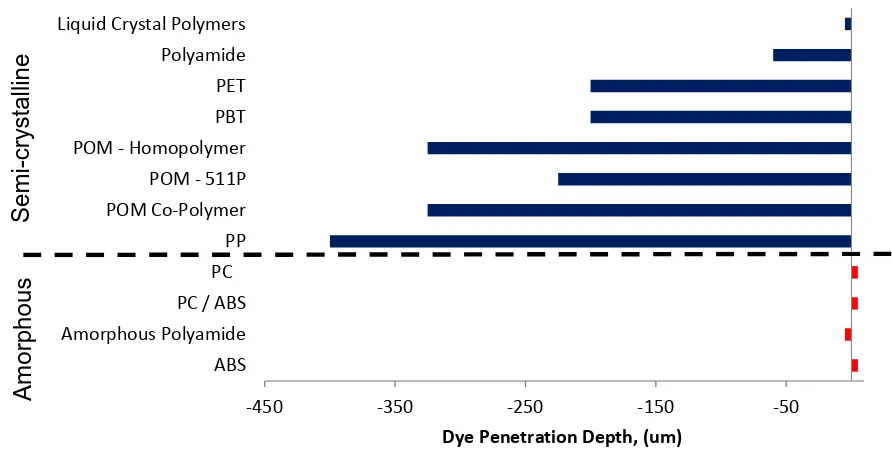
[image:19.595.79.525.313.540.2](1) Data presented by Adams (Adams, 2007) illustrated in Figure 3, show that the dyes sublimate into semi-crystalline polymers more than the amorphous polymers. No reason is given for this condition. The author will investigate by means of experimentation.
Figure 3 Dye penetration depths published by Adams (Adams, 2007)
(2) The data presented by Adams (Adams, 2007) does not describe how the CMYK colours perform in different polymers. This is another area of investigation undertaken.
-450 -350 -250 -150 -50
ABS Amorphous Polyamide PC / ABS PC
PP POM Co-Polymer POM - 511P POM - Homopolymer PBT PET Polyamide Liquid Crystal Polymers
Dye Penetration Depth, (um)
9 (3) No published information is available about the thermal characteristics of the
sublimation dyes and how these relate to the substrate polymers. Experimentation to characterise the sublimation dyes will provide this knowledge.
10
3. INTRODUCTION TO EXPERIMENTATION UNDERTAKEN IN THIS RESEARCH
The data generated and published by Adams (Adams, 2007) does not indicate either how the substrates were processed or how the dye penetration depths were measured, the author contacted both Larry Adams (Adams, 2010) the publication author and Christophe Chervin (Chervin, 2010) of DuPont Engineering polymers, the original source of data, but neither responded to the requests. This could have been for a number of personal reasons or that the data was industrially sensitive. It was decided by the author to design a series of experiments which would yield new data to further academic knowledge and industrial innovation. The materials, methods and testing are described within this section.
3.1. MATERIALS USED IN THE EXPERIMENTATION
This section describes the materials used in this research.
3.1.1. THE SUBSTRATE POLYMERS
[image:21.595.70.530.543.746.2]The polymeric materials used to create the experimental substrates are listed in Table 3. These materials were selected in order to gain knowledge of dye penetration behaviour in a range of commercially available amorphous and semi-crystalline materials.
Table 3 Experimental polymer substrates
Type Polymer Abbreviation Manufacturer Grade
A
m
or
ph
ou
s Polycarbonate PC Sabic ELX 1414
Acrylonitrile butadiene styrene ABS ABSCOM F350
Polystyrene PS Total Petrochemicals PS 1540
Acrylic PMMA LG Chem IF 850
Se
m
i-cr
ys
ta
lli
ne
Polypropylene PP Bassel HP551M
High density polyethylene HDPE BP HD802GA
11 The materials selected have a commercial interest to IDT as these could extend the range of materials available for customer projects (Barrow, 2010). The polymer materials were prepared by injection moulding into substrate plaques approximately 160 mm square and 3 mm thick. This was completed on a Battenfeld 110 T injection moulding machine; 10 parts were produced of each material type to ensure any variations occurring from the manufacturing process where kept to a minimum.
3.1.2. THE SUBLIMATION DYES
The commercially available dye materials used in these experiments were supplied by Sawgrass and were of the SubliJet IQ type, consisting of a standard CMYK colour profile. The composition for all colours was established from the material safety data sheet (Sawgrass, 2008). Sawgrass were kindly asked to supply further information regarding the dye materials; however they refused to do so, on propriety grounds (Cobb, 2010). The “dye material” is recognised to be all of the components shown in Table 4. The water component is used as a carrier in the inkjet system it quickly evaporates when printing has been completed (Meyer, 1975, Lee, 2005).
There are other commercially available sublimation dyes however as this work is to fully understand the process for IDT, only their preferred supplier was selected for this project. It is thought that different suppliers of dyes would produce similar results, this could be confirmed with further experimentation, as noted in section 10.
Table 4 Dye material composition
Number Component Quantity
1 Dye <5%
2 Organics <20%
3 Di-ethylene Glycol (DEG) <25%
4 Glycerine <25%
12
3.1.3. THE TRANSFER CARRIER
The TC supplied by IDT is an amorphous polyethylene terephthalate film 190 µm, thick +/-10%. It has two coatings applied onto one side the first is a metallic barrier and the second is a release coating. The metallic layer acts as a barrier to prevent the dye from penetrating the film. The release coating enables the dyes to be applied to the film prior to it being used in the transfer process. The TC was printed onto using an Epson 4400 printer at a resolution of 600 dots per inch, with the CMYK dyes, using a standard print image as shown in Figure 4, once printed the films were dried.
Figure 4 The CMYK test print
3.2. EXPERIMENTAL DESIGN AND EQUIPMENT USED
This section describes the experimentation methods undertaken in this research. First initial experiments were conducted to understand how much dye penetration was possible into a range of polymers. The result from the initial experimentation prompted the need for extended dye penetration depth experimentation using amorphous and semi-crystalline polymer substrates. Finally there was a need to characterise the sublimation dyes so that it could be used in-conjunction with the findings from the penetration experimentation.
13
3.2.1. THE DESIGN OF THE INITIAL DYE PENETRATION EXPERIMENTATION
Initially experiments were undertaken to understand how much the dyes penetrate amorphous and semi-crystalline polymers. The D6.3 transfer press, supplied by IDT was used to decorate the substrate materials listed in Table 3.
Figure 5 Schematic of the transfer press arrangement
The process was set up by firstly placing the substrate into the lower tray of the transfer press, the printed TC is placed directly above and held using a clamp frame. A schematic of the arrangement is shown in Figure 5.
For the purpose of these experiments the parameters, detailed in Table 5, were set to typical values considered for the decoration of polymer substrates. Tests detailed in
14
Table 5 Dye sublimation experimentation parameters
[image:25.595.73.238.475.670.2]An image of a decorated substrate is shown in Figure 6 and an illustration of the D6.3 transfer press is shown in Figure 7.
Figure 6 Photograph of the dye sublimation decorated component
Figure 7 IDT D6.3 transfer press
No Parameter Setting Description
1 Thermo Softening Point (oC) 70 Heat the TC to the “Thermo Softening Point” to enabling vacuum forming
2 Film Soften Time (seconds) 5 “Film Soften Time” enables an isothermal condition of the TC
3 Vacuum Dwell (seconds) 15 The “Vacuum Dwell” is the vacuum forming
time.
4 Temperature (oC) 175 Heat is applied until the “Temperature” is
reached where the dyes sublimate.
5 Time (seconds) 45 Heat is applied for the “Time” allowing dye
penetration into the substrate.
6 Cooling Temperature (oC) 65 The system is cooled to the “Cooling Temperature” enabling safe handling
15
3.2.2. DESIGN OF THE EXTENDED DYE PENETRATION EXPERIMENTATION
Literature analysis shows that the key parameters of the dye sublimation process are temperature and time. It is understood that these directly affect the level of dye penetration into the substrate. The literature identifies that the process temperature can range from 137.7-300oC (Adams, 2007, Slark and Hadgett, 1999) and the time from 0.12–10
minutes (Shearmur et al., 1996, Chandler, 2007) presenting a wide range of operation, for further details seeportfolio submission 3. What is unknown about these parameters is how they affect the level of dye penetration into the polymer substrate.
To better understand the effect of temperature and time on the level of dye penetration further experiments were designed and undertaken. This was completed using semi-crystalline PBT and amorphous PC substrates Table 3. For these experiments the
Temperature was set at 140, 160, 180 and 200oC. At each setting the Timewas set at 20, 40, 60 and 80 seconds, Table 5 parameters 4 and 5. All other settings and the equipment arrangement was as described in section 3.2.1.
3.2.3. THERMAL CHARACTERISATION OF THE SUBLIMATION DYES
The dye materials sublimate during the “Heat” phase of the dye sublimation process. Analysis of the literature revealed no information regarding the thermal characteristics of the dye materials and how they affect the level of dye penetration into the polymer. Therefore to characterise the dyes in a thermal condition, experimentation was completed using a Differential Scanning Calorimetry (DSC).
16 It is considered that during these experiments other volatiles in the dye composition may have evaporated however for this experimental work it is assumed that the weight loss is solely the result of water.
Figure 8 Image of a Mettler Toledo DSC1
The DSC experiments were completed using a Mettler Toledo DSC 1 with an auto sampler, located in the Physics Department, University of Warwick; as illustrated in Figure 8. All of the experiments were completed using a temperature range of 25–300 oC, this range was selected to establish the effect of thermal loads on the dye material at low and elevated temperatures. A 36 oC/min ramp rate was used for the primary experiments thereby emulating the D6.3 transfer press. These were repeated 3 times for the CMYK dye materials.
To establish the effect of heating ramp rates on the dye materials, additional experimentation was completed using the “Y” dye material. Only this dye was used at it was believed that all the CMYK dyes would behave similarly. The ramp rates used were 5, 10, 20, 30, 40, 50, 60, 70, 80 and 100 oC/min. Only one experiment was completed at each ramp rate.
All of the DSC experimentation was completed in a N2environment to eliminate the effect of
17 Visual confirmation of the thermal transitions of the dye was also completed. Initially a number of setup experiments were undertaken to establish a test methodology. Approximately 1 mg of the dye material was thinly laid onto aluminium foil, covering approximately 2 cm2. The specimens were individually heated in a small oven at a 36oC/min ramp rate, until the transition temperatures were reached as detailed in Table 8.
The specimen was allowed to become iso-thermal for 1 minute at the transition temperature before being inspected and photographed by the author. The enthalpy values were established using the Mettler Toledo Star software. Further details can be found in
portfolio submission 4.
3.3. THE OPTIMUM LEVEL OF DYE PENETRATION
A high level of dye penetration in a component is desirable so it can endure a harsh and abrasive environment ensuring it will survive its intended lifetime. Alternatively a low level of dye penetration can bring a level of obsolescence to the component, ensuring that the decoration wears and the article is replaced regularly thereby generating additional revenue for the manufacturer. This may be desirable with certain product types such as push on mobile phone covers, which are considered to be a sacrificial part of the mobile phone (White, 2010).
The ideal dye penetration depth is unknown at present as no literature exists where an acceptable level is proposed. Alternative plastic surface decoration technologies such as spray painting (Stoye and Freitag, 2007) and in-mould decoration (IMD) (Love and Goodship, 2002) provide a “protective layer” over the substrate. For spray painting this is 25-40 µm and for IMD it is 25-75 µm. This “protective layer” is considered to be the depth of material that could be initially worn away before the substrate material is revealed.
As a benchmark of acceptable dye penetration depth into the polymer substrate it is proposed by the
author:- <25 µm=unsuitable
25–75 µm=optimum
18 Following this research the author proposes a revised acceptable level of dye penetration of 15-75 µm, see section 9.1.
3.4. DYE PENETRATION MEASUREMENT METHODOLOGY
From each decorated substrate the CMYK colours were cut into individual samples approximately 5 mm x 5 mm and the surface was microtomed ready for optical microscopy.
Dye penetration was viewed using a Zeiss, Axio Scope A1, optical microscope at 5x magnification; dye penetration was established using Axio Vision software. Where possible a minimum of five dye penetration readings were taken for each of the decorated substrates. It is noted that on some of the decorated substrates there was insufficient dye penetration, making measurement extremely difficult. For these specimens a low number of readings were recorded.
Lack of variability in the dye penetration across the decorated substrate was established in
portfolio submission 2, therefore only one sample was required for optical microscopy for each of the decorated substrates. All of the specimens were prepared, measured and stored at a constant temperature of 21 oC. An illustration of the “Y” dye penetration into PBT, processed at 180oC, 60 seconds is shown in Figure 9.
19
4. EXPERIMENTAL RESULTS
This section details the experimental results from the experimentation described in section 3.
4.1. THE INITIAL DYE PENETRATION EXPERIMENTAL RESULTS
The average dye penetration values from the initial experiments described in section 3.2.1 are displayed Table 6, detailed results are available inportfolio submission 2.
Table 6 Average dye penetration depth measurements by material and colour
Dye penetration depth (µm)
Type Polymer C M Y K Average
Amorphous
PC 54 62 62 62 60
ABS 5 6 31 19 16
PS 62 62 77 38 60
PMMA 154 46 46 138 96
Semi-crystalline
PP 18 92 538 77 181
HDPE 278 194 333 278 271
PA 115 115 92 62 96
PBT 62 85 100 62 77
4.2. THE EXTENDED DYE PENETRATION EXPERIMENTAL RESULTS
20
Table 7 PC and PBT dye penetration results
Dye penetration depth (µm) Polymer Temperature Time (seconds)
(oC) 20 40 60 80
PC
140 0 7.54 16 10.29
160 14.6 17.51 20 19.51
180 43.31 48.24 58.02 61.52
200 65.72 88.06 107.09 115.97
PBT
140 2.21 4.78 5.52 6.99
160 10.83 14.57 18.92 26.64
180 28.26 37.07 60.31 86.86
200 131.96 150.05 157.43 179.37
4.3. THE THERMAL CHARACTERISATION EXPERIMENTAL RESULTS
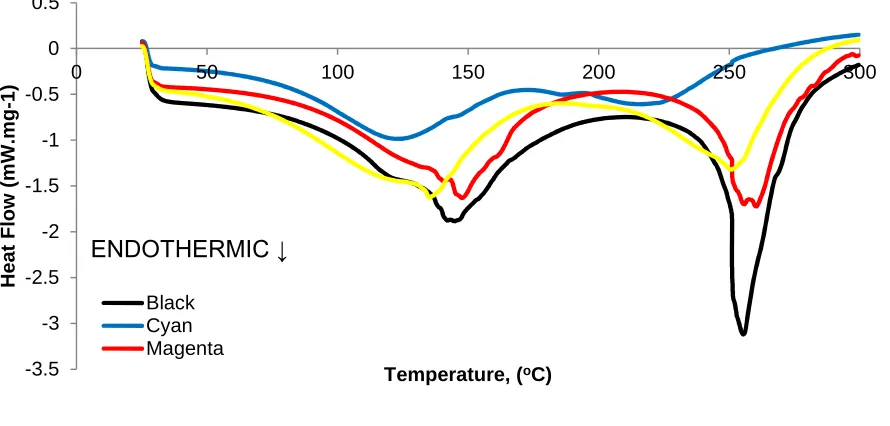
The DSC graphs from the experiments described in section 3.2.3 for the CMYK dye materials are shown in Figure 10. The results show the endothermic kinetic reaction of the dye materials, whereby the dye materials absorb thermal energy (Brown, 2001).
Figure 10 DSC results for all colours
-3.5 -3 -2.5 -2 -1.5 -1 -0.5 0 0.5
0 50 100 150 200 250 300
H e a t F lo w (m W .m g -1 )
Temperature, (oC) Black
Cyan Magenta
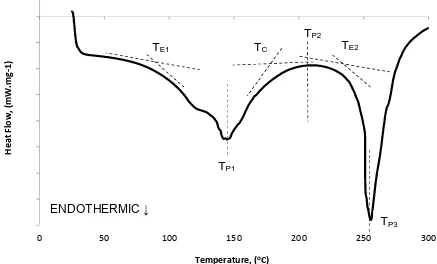
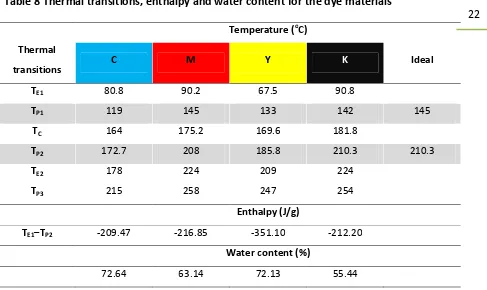
[image:31.595.79.524.478.691.2]21 Enthalpy is a measure of the total energy for a thermodynamic system (Hatakeyama and Quinn, 1999). The enthalpy values from the DSC experiments and the thermal transitions (Höhne et al., 2003) are shown in Table 8. Figure 11 illustrates the “K” DSC result, labelled with the thermal transitions.
Whereby:- TE1-1stextrapolated onset. TP1-1stpeak.
TC-extrapolated completion. TP2-2ndpeak.
[image:32.595.81.518.326.590.2] TE2-2ndextrapolated onset. TP3-3rdpeak.
Figure 11 ”K” dye material with the thermal transitions labelled -80
-70 -60 -50 -40 -30 -20 -10 0 10
0 50 100 150 200 250 300
H
ea
tF
lo
w
,(
m
W
.m
g-1)
Temperature, (oC)
TE1 TC
TP1
TP2
TE2
TP3
22
Table 8 Thermal transitions, enthalpy and water content for the dye materials
Temperature (oC)
Thermal
transitions C M Y K Ideal
TE1 80.8 90.2 67.5 90.8
TP1 119 145 133 142 145
TC 164 175.2 169.6 181.8
TP2 172.7 208 185.8 210.3 210.3
TE2 178 224 209 224
TP3 215 258 247 254
Enthalpy (J/g)
TE1–TP2 -209.47 -216.85 -351.10 -212.20
Water content (%)
72.64 63.14 72.13 55.44
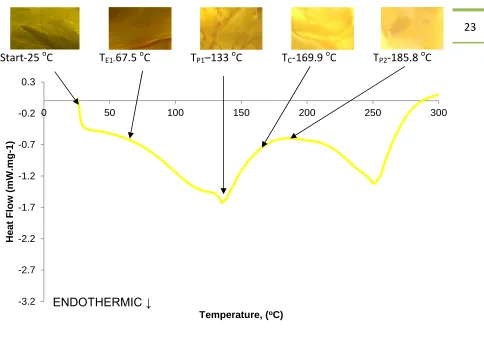
Figure 12 shows the DSC plot for the “Y” dye material with images of the tested specimens at the respective thermal transitions detailed in Table 8.
The results from the experimentation of the dyes detailed in section 3.2.3 show that at 25oC and at TE1 the colour remains visibly unchanged. At TP1 a slight level of colour fading is
evident. At TCthe dye colour has faded indicating that sublimation has occurred. At TP2only
a trace of the dye colour is evident. Examination of the dyes heated to TE2 and TP3 showed
23
Start-25oC T
[image:34.595.72.556.65.405.2]E1-67.5oC TP1–133oC TC-169.9oC TP2-185.8oC
Figure 12 “Y” DSC plot showing the visual effects of the thermal loading
-3.2 -2.7 -2.2 -1.7 -1.2 -0.7 -0.2 0.3
0 50 100 150 200 250 300
H
e
a
t
F
lo
w
(m
W
.m
g
-1
)
24
5. ANALYSIS AND DISCUSSION OF THE DYE PENETRATION EXPERIMENTATION
This section analyses and discusses the results of the experimentation outlined in sections 3.2.1 and 3.2.2. The level of CMYK dye penetration into the substrates is appraised as is the surface decoration and condition of the polymer surface. The free volume of polymers is discussed and further experimentation is undertaken to prove the relationship with dye penetration.
5.1. ANALYSIS AND DISCUSSION OF THE INITIAL EXPERIMENTATION
Table 9 contains the data from the dye penetration measurements for different polymer types presented by Adams (Adams, 2007) and the average values for each polymer type established by the author. These values are calculated by averaging the dye penetration measurements for each of the individual colours.
Table 9 Comparison of Adams and the author’s initial experimental data
In Table 9 the positive (+) value implies that the dye is adding to the specimen thickness, the negative (-) value is where the dye is penetrating into the polymer. From the authors experimental measurements, no increases to the thickness to the specimens were observed.
Dye penetration depth (µm)
Polymer Adams data
(Adams, 2007) Average authors data Difference
ABS +5 -16 21
PA -70 -96 26
PBT -200 -77 123
PC +5 -60 65
25 The two sets of data show disparate values when compared to each other. Considering amorphous PC as an example; Adams illustrates that the process adds 5 µm to the thickness of the substrate, the results from the initial experiments show a penetration of 60 µm equating to a difference of 65 µm. The semi-crystalline PP shows a 219 µm difference between the published and measured values; other disparities are also observed. At no point during this work was any sign of the surface addition as reported by Adams, (Adams, 2007) witnessed.
The differences between the data could be due to the lack of process parameter information and the measurement technique used, making direct comparisons impossible. As previously stated the author was unable to obtain this data from Adams and Chervin (Adams, 2010, Chervin, 2010).
Adams (Adams, 2007) shows negligible dye penetration into the surface of amorphous polymers, implying that the decorated surface would wear quickly. DuPont state that the “dye does not penetrate and can be scratched off easily, when using amorphous polymers such as PC and ABS” (Anon, 2005). The significance of this research is that when designers or manufacturers investigate this process, they may rule out this technique, if they base their decision on inappropriate data.
Whilst useful data has been generated from these initial experiments, it highlights the need for further rigorous experimentation to better understand the effect of time and temperature with respect to dye penetration into polymer substrates.
5.1.1. SECTION CONCLUSIONS
26 Experimentation was conducted by decorating general purpose polymer materials followed by optical microscopy. This established dye penetration measurements which differ greatly from those reported. Due to the lack of rigorous data no methodology was available until established by the author for specimen decoration and the measurement of dye penetration.
The previously published data indicated that the dyes barely penetrate amorphous polymers and in some cases an additive condition occurred. The experimental results from this study show that the dyes penetrate PC up to 65 µm more than previously reported. PP and HDPE show a considerable level of dye penetration, whilst the results suggest that amorphous substrates are comparable to semi-crystalline PBT and PA.
The work published by Adams does not contain any processing information which could have affected the level of dye penetration into the substrate polymers. The author attempted to gain this information but communication with the originator of the data and the author of the publication were unsuccessful.
This work concluded that amorphous polymers are suitable to be used in the process and an acceptable level of dye penetration can be achieved. Whilst meaningful data has been generated from the initial experimentation, it also highlights the need for further work to better understand the effect that process time and temperature have on the level of dye penetration, further details of this work can be found inportfolio submission 2.
5.2. ANALYSIS AND DISCUSSION OF THE EXTENDED EXPERIMENTATION
This section analyses and discusses the results from the extended experimentation described in section 4.2.
5.2.1. AMORPHOUS PC
27 The graph shows that an increase in time results in increased levels of dye penetration. The processing time of 0–20 seconds achieves a high level of dye penetration. At the settings of 140–180oC, 20–80 seconds the dye penetration has increased by 30–50%, however at 200
oC, 20–80 seconds the level of dye penetration almost doubles.
The results show that raising the temperature increases the dye penetration depth, which has increased by 112%, 194% and 78% when the process temperature has increased from 140–160, 160-180 and 180-200oC respectively. One important point is that the graph does not show the “additive” nature of the dye on the surface of the polymer as shown in Figure 3 (Adams, 2007).
Figure 13 PC Average dye penetration depths with error bars
Table 10 shows a visual chart of the CMYK colours which gave the deepest or shallowest dye penetration at the given experimental settings.
0 20 40 60 80 100 120 140 160 180 200
0 10 20 30 40 50 60 70 80
D
ye
D
ep
th
,(
m
ic
ro
ns
)
Time, (seconds) 200 oC
28
Table 10 PC Visual chart of deepest and shallowest dye penetration depths
Sublimation temperature (oC)
Deep Shallow
Time (seconds)
20 40 60 80 20 40 60 80
140 -
-160 180 200
The results show that at 140oC, 20 seconds there is no dye penetration, at 40–80 seconds
the “Y”, “M” and “K” colours show a high level of penetration at the different processing times. At 160 oC, the “C” dye gives the best level of penetration at 20-60 seconds, at 80
seconds the “C” is only 1.48 µm less than the “K” dye. At 180oC the “M” dye displays high
levels of penetration when processed for 40-80 seconds. The results also show that at 200
oC, for 60-80 seconds “M” provides the deepest level of penetration. Overall during the first
20 seconds the “C” dye gives the deepest level of penetration at 160-200oC.
Figure 14 PC Average dye penetration measurements for CMYK colours 0
5 10 15 20 25 30 35 40 45 50
Av
er
ag
e
D
ye
D
ep
th
,(
m
ic
ro
ns
)
29 Figure 14 shows the average dye penetration depth measurements in the PC for each of the CMYK colours, the data is taken from all of the process temperatures and times. The range between the highest and lowest average is 6 µm representing a variation of 13%, which could be deemed as significant if a constant dye penetration depth is required through all of the CMYK colours, “C” gives the highest average value and “K” gives the lowest.
There is no clear pattern as to which dye gives the shallowest results. However, At 160 oC the “Y” dye provides the shallowest penetration at 20-40 seconds. At 180 oC the “K” dye gives the lowest level of dye penetration across the range of different processing times.
5.2.2. SEMI-CRYSTALLINE PBT
The average dye penetration results are shown in Figure 15, the error bars are discussed in section 5.2.6. The graph illustrates that time increases lead to an improved dye penetration depth, the largest occurs in the first 20 seconds giving an average of 43 µm across the CMYK colours. Increasing the process duration to 40-60 seconds gives a further 9 µm increase per 20 seconds. Increasing the time from 60-80 seconds provides a further 15 µm of penetration.
Figure 15 PBT Average dye penetration depths with error bars 0 20 40 60 80 100 120 140 160 180 200
0 10 20 30 40 50 60 70 80
30 The results show that at 140oC the level of dye penetration is unacceptably low at 6.99 µm. At 160oC using 80 seconds of time and at all of the experiments conducted at 180–200 oC, dye penetration is recorded to be greater than 25 µm. The best level of dye penetration occurs at 200oC, providing an average depth of 123 µm, three times greater than at 180oC and nine times more than at 160oC.
Table 11 shows a visual chart of the CMYK colours which gave the deepest or shallowest dye penetration at the given experimental settings. At 140 oC, 0-40 seconds the “K” dye gives the deepest values, with “M” giving significantly increased value at 60 seconds. At 160 oC the “K” dye gives the deepest measurements at 60-80 seconds. At 200oC the “M” dye gives the best readings at the higher processing times.
Table 11 PBT Visual chart of deepest and shallowest dye penetration depths
Sublimation temperature (oC)
Deep Shallow
Time (seconds)
20 40 60 80 20 40 60 80
140
-160 180 200
31 At 140 oC the readings were taken with difficulty as very little dye had penetrated the polymer. At 160 oC the “C” colour penetrates the least at 20, 60 and 80 seconds signifying that at this temperature dye penetration ceases earlier than the other colours. At 180 oC there is no real pattern of which colour penetrates the least. At 200oC the “K” dye provides the least penetration illustrating that this colour ceases penetration the earliest. The results show three patterns
emerging:- 1st-“C” penetrating shallowest when processed at 160oC
2nd-“K” penetrates the shallowest when processed at 200oC
3rd-“C” gives the shallowest depth, 60 seconds at all temperatures.
The graph in Figure 16 shows the average dye penetration measurements for each colour across the range of temperatures and times using the PBT polymer. It shows that there is only 4 µm difference between the “M” and “K” dyes, which are the maximum and minimum level of dye penetration retrospectively. This is not envisaged to be a significant value as it only equates to 5-16% of the “target” dye penetration depth.
Figure 16 PBT Average CMYK dye penetration measurements 0
10 20 30 40 50 60
Av
er
ag
e
D
ye
D
ep
th
,(
m
ic
ro
ns
)
32
5.2.3. COMPARISON BETWEEN THE PC AND PBT RESULTS
Figure 17 displays a graph of the average dye penetration depth measurements for the PC and PBT by temperature. The graph shows a similarity in the results between the PC and PBT when processed at 140-180 oC. At 200 oC there is a large difference in measured dye
penetration depth where the PBT has 60 µm more than the PC.
Figure 17 PC and PBT Average dye penetration depth measurements
5.2.4. RATE OF DYE PENETRATION
Figure 18 illustrates the calculated average rate of dye penetration for the PC and PBT polymers. The graph shows that both polymers have a similar rate of penetration when processed at 140–180oC. At 200oC the rate of penetration for the PBT is 58% greater than the PC. For both materials the highest rate of penetration occurs when the process is operated at 200 oC during the first 20 seconds, further details can be found in portfolio submission 3.
0 20 40 60 80 100 120 140 160 180 200
140 oC 160 oC 180 oC 200 oC
D
ye
pe
ne
tr
at
io
n
D
ep
th
,(
m
ic
ro
ns
)
Temperature, (oC) PBT - Average
33
Figure 18 PC and PBT average rate of penetration
5.2.5. FREE VOLUME WITHIN POLYMERS
Free volume theory states that there are varying holes present between the polymer molecules. The free volume quantity is the difference between the actual volume and the excluded volume at a specified temperature and pressure (Simha and Carri, 1994). If the proportion of free volume is increased it becomes interconnected in such a way that the polymer takes on the characteristics of a micro-porous material.
Such polymer types are considered and used for molecular separation and sieving applications (Budd et al., 2005a, Budd et al., 2005b, Budd and McKeown, 2010). E.g. hydrogen, nitrogen and oxygen are successfully separated from the atmosphere by the use of polymeric membrane technology (Veith, 1991).
The transport properties of small molecules in and through polymers are important because of the effect a molecular penetrant can have on the properties of a polymer. Barrier polymers are used when the aim of the material is to inhibit transport of the penetrating molecule. Controlled release polymers are used when transport of an active molecular agent is required to migrate out of the polymer in a prearranged method. Membrane polymers are used where a preferential transport of one molecular component is required. The permeability of a small molecule through an amorphous polymer membrane while in a glassy state is usually low (Budd et al., 2005a).
0 0.5 1 1.5 2 2.5
140 oC 160 oC 180 oC 200 oC
34 When the polymer is in a rubbery state the permeability is much higher. Polymers in the rubbery state have an increased free volume which enables high diffusion coefficients, but their ability to be selective as to which molecules can penetrate through the polymer is low. Rubbery polymers are most commonly used for their ability to separate large organic vapour molecules from smaller gas molecules, because of their high solubility selectivity (Budd et al., 2005a). Research suggests that diffusion in a rubbery polymer is the result of redistribution of free volumes within a matrix and migration of the penetrant among these free volumes. Diffusion can therefore only occur if a hole exists that is large enough for a penetrate molecule to enter (Rezac and John, 1998) restated by Lutzow and Willmore (Lutzow et al., 1999, Willmore et al., 2006).
The free volume is constant while the polymer is in the glassy state and is calculated to be 2.5% (Budd et al., 2005a). However there is change in the expansion coefficient at glass transition temperature (Tg) which corresponds to the increase of the free volume.
[image:45.595.75.479.466.668.2]Figure 19 is illustrated in many texts (Budd et al., 2005a) re-iterated by Ward and Seitz (Ward and Sweeney, 2004, Seitz, 1993). The graph illustrates that the occupied volume increases with temperature rises, throughout the glassy and rubbery states.
Figure 19 Graph to show free volume of polymers below and above Tg Tg
Volume ↑
Total Volume
Actual Volume
Free Volume
Temperature Rubbery State
Glassy State
35 Large increases of the free volume are present in the polymer if it is in the rubbery state at and above the Tg(Budd and McKeown, 2010). There appears to be a lack of consensus to the
definition of free volume, but this concept has proved to be very useful in the explanation of the theory (Budd et al., 2005a, Ward and Sweeney, 2004, Seitz, 1993).
Thermal expansion is described as the expansion of the free volume in the polymer lattice when heat is applied. At atmospheric pressure, it is found that an empirical volume
temperature relationship exists as shown in Equation 1, over a pressure range of 0.95 ≤ ṽ ≤
1.40 quoted by Simha (Simha, 1977) reconfirmed by Rodgers and Consolati (Rodgers, 1993, Consolati, 2007).
Equation 1 Simha volume temperature relationship
Inv ṽ = A + B ~T3/2
Whereby:- ~T-temperature.
A-0.10335 constant.
B-23.8345 constant.
ṽ-volume.
Calculating the fractional free volume of a polymer in the glassy state is shown in Equation 2. Applying this equation the fractional free volume for amorphous polymers at the Tg is
2.5% (0.025 +/- 0.003) (Budd et al., 2005a, Ward and Sweeney, 2004).
Equation 2 Ward fractional free volume
36
Whereby:- f-fractional free volume.
T-temperature.
Fg-is the fractional free volume at Tg.
f-is the coefficient of expansion of the free volume, typically 4.8 x 10⁻⁴.
A substantially larger free volume at or above Tgcan be calculated from Simha and Boyer’s
relationship, as shown in Equation 3 (Simha and Boyer, 1962) and restated by Budd (Budd et al., 2005a).
Equation 3 Simha and Boyer’s free volume
(R-G)Tg= 0.113 (11.3%)
Whereby:- R-rubbery coefficient of thermal expansion. G-glassy coefficient of thermal expansion.
Table 12 shows experimental densities and free volumes of a range of different polymer types (Yampolskii et al., 2006).
Table 12 List of different polymers types with densities and free volume
Polymer Density (g/cc) Free Volume (%)
Poly trimethylsilyl propyne 0.75 27.7
Poly dimethyl phenylene oxide 1.066 7.4
Tetramethylhexafluorobisphenol PC 1.289 6.5
37 Figure 20 shows an adapted graph of the free volume in PC which has a Tgof 147oC (Bohlen
and Kirchheim, 2001) measured using positron annihilation lifetime spectroscopy (PALS). The free volume is the difference between the total volume (solid plot) and the actual solid volume (dotted plot). As the temperature increases the graph displays a constant free volume until Tgafter which the free and specific volumes increase dramatically (Bohlen and
Kirchheim, 2001).
Figure 20 Graph of free volume in PC measured using PALS
The pressure, volume and temperature studies completed for PC establish a free volume content of 8-10% with an average hole size of 110A3at 37oC. Studies by Arnold and Bohlen,
using PALS have found that PC has a free volume of 7-9% (Bohlen and Kirchheim, 2001, Arnold, 2010).
Dlubeck discovered by using PALS that PE has a free volume of 4.2% at Tgand 13.2% above
Tg. The same study concluded that polytetrafluoroethylene has a free volume of 5.7% at Tg
with a 13% free volume above Tg(Dlubek et al., 1998).
Semi-crystalline polymers such as polyethylene have amorphous and crystalline phases co-existing as a result free volume theories are not applicable. In these materials penetrants are considered to be insoluble in the crystallite regions of the polymer and diffusion only occurs in the amorphous phase (Lutzow et al., 1999).
90 100 110 120 130 140 150 160
-15 35 85 135 185
H
o
le
v
o
lu
m
e
,
V0
(A
3 )
Temperature, (oC)
38 In a semi-crystalline material it is believed that the amorphous regions supply the growing spherulites with polymer. This results in a permanent entanglement with the spherulites which leads to reduced movement of the polymer chains and eventually the crystal growth stops. Consequently the amorphous phase is presumed to be retarded, causing a reduction of free volume in this phase (Lutzow et al., 1999).
It can be assumed that the amorphous PC polymer has a free volume of 2.5% below Tgand
11.3% above (Budd et al., 2005a). The semi-crystalline PBT has a respective free volume of 1.5–1.6% below Tgand 6.78–7.34% above.
From the experiments it is evident that with both polymeric materials the free volume is
sufficiently large enough when the material and process temperature is ≥Tg,facilitating dye penetration.
There are alternative methods in which the dye penetration can be explained, such as, Ficks law, osmosis and Brownian motion.
Ficks law (Fick 1855, Crank and Park 1968) illustrated in Equation 4, deals with the diffusion of permanent gases into and through polymers. There are two types of penetrant behaviour. The first is a low solubility of gas and concentration independent diffusion coefficients and a temperature and concentration independent energy (Crank and Park 1968). The second is with larger vapour molecules characterised by non dilute penetration polymer mixture, marked concentration dependant diffusion coefficients and temperature dependant energies of activation (Crank and Park 1968).
Equation 4 Ficks law
J=-D*(ΔC/Δx)
Whereby:- J= flux
C=concentration
x=distance
39 Osmosis is when two solutions of different concentration types and are separated by a membrane which is permeable by the smaller solvent molecules but not to the larger ones, then the solvent will tend to diffuse through the membrane from the less concentrated to a more concentrated solution (Cheryan 1998).
Brownian motion can be described by the motion of a particle suspended in a viscous fluid resulting from fluctuating forces which are the consequence of collisions with adjacent molecules of the fluid. The details of Brownian movement cannot be predicted exactly however it is assumed that collisions and displacements are random. Therefore even though the precise details of the phenomenon are unknown, the average behaviour can be determined. In a suspension all the particles undergo Brownian motion and therefore particles will tend to flow from regions of high concentration to ones with low concentration. This flow is termed diffusion and it causes the concentration of a suspension to become uniform (Brown, 1827, Brinkman, 1956).
These three established principles are relevant to the diffusion of gasses into polymers but cannot be readily applied to the dye sublimation process. The dyes used in the process are considered not to be permanent gases, they are only in gas form when heat is applied and when cooled they condensate back into a solid material. Therefore these principles are not considered to be the mechanism whereby the dye penetrates the polymer surface.
5.2.5.1. FURTHER EXPERIMENTATION USING FREE VOLUME
40
Table 13 PBT Free volume dye penetration experimentation
Temperature (oC) Average dye penetration depth (µm)
C M Y K Average
Starting dye penetration - - - - 28.27
69 47.71 53.63 54.18 46.49 50.50
114 305.86 315.48 307.84 289.2 304.60
159 372.02 572.9 490.72 594.71 507.59
The experiment was undertaken on three specimens of pre-decorated PBT, processed at 180oC, 20 seconds, this specimen had a level of dye penetration measured to be 28.27 µm. Three different temperatures were used for these experiments 69oC (Tg+20 oC) 159oC (Tg
+110oC) and a midpoint of 114oC, all of the specimens were exposed to these heats for 240 minutes. Five dye penetration measurements were taken for each colour, the average results are shown in Table 13 further details can be found inportfolio submission 3.
The results illustrate that by increasing the temperature to 69 oC, the free volume has increased sufficiently enabling the dyes to migrate further into the polymer by a factor of 1.8. By exposing the specimen to 159 oC, the dye penetration depth has increased by a factor of 18. The improved level of dye penetration is three times more than previously recorded during any of the original dye sublimation experimentation.
The experiments described in section 3.2.3 and the results in section 4.3 highlight that the dyes sublimate between 119-210 oC. Therefore at the experimental temperatures, 69 and 114 oC the dyes are not sublimating and the increase in the dye penetration depth is solely the result of the free volume increasing and interconnecting sufficiently enabling improved dye penetration. It is not thought or has been reported that the dyes are re-sublimating at 159oC during the experimentation (Cobb, 2010).
41
5.2.6. THE DYE DEPTH PENETRATION MEASUREMENT ERRORS
As discussed in sections 5.2.1 and 5.2.2 there were errors in the measurement results from the experimentation completed in section 3.2.2. This section discusses how the author believes the errors came about. The variation noted in the dye penetration measurements was more evident at the higher processing temperatures. The measurement errors were due to manual error and the difficulty in establishing where the level of dye penetration finished in the polymer.
Figure 21 PBT with “M” dye displaying the measurement difficulty
Figure 21 shows an image from the optical microscopy of PBT decorated using the “M” dye three possible measurement points are shown as A, B and C. These three end points vary approximately 10 µm. This demonstrates the difficulty in trying to establish where the dye ceases penetration. Measurements were taken using a consistent approach to gain a level of reliability with the data. In all cases the author used point B.
At the lower temperatures the level of measurement error was far less as the dye had penetrated to a more defined end point, as seen in Figure 22. In this case any variations present are more likely to be the result of dye penetration variability and less so measurement error. The author proposes an investigation to find an alternative and more reliable method of measuring the dye penetration depth in a polymer substrate, in section 10.
B C
42
Figure 22 PBT with “M” dye at 160oC
5.2.7. VISUAL APPRAISAL OF THE SUBSTRATE DECORATION
The following section appraises the decorated image quality of the PC and PBT substrates, the decorated specimens objectively appraised by the author; the results are shown in Table 14.
Table 14 Visual appraisals of PC and PBT decorated substrates
Polymer Temperature Time (seconds)
(oC) 20 40 60 80
PC
140 F F F F
160 F F F OK
180 OK OK OK B
200 OK B B B
PBT
140 F F F F
160 F F F OK
180 OK OK OK OK
200 OK OK OK B
43 Figure 23 displays photographs of the decorated PC substrates at the different temperatures with the time shown from left to right, 20-80 seconds. The faint images recorded in Table 14 are the result of insufficient transfer of the dyes into the surface of the PC. It is noted that at 140oC there is insufficient coverage of the dyes on the surface of the substrate.
Figure 23 PC Photographs of the decorated substrates at 140 - 200oC
Figure 24 shows an image of the surface of the decorated PC, it shows a very faint background with spots of colour which are more prominent where dye transfer has started to occur. This could be very similar to the condition as report by DuPont (Anon, 2005) where the dye is reported to scratch off easily.
140 ºC 160 ºC
44
Figure 24 PC Photograph of the surface showing a “faint” decoration
Figure 25 PC Photograph of the surface showing a “blurry” decoration
Figure 25 shows a photograph of the decorated PC surface, a high level of blurriness is witnessed instead of a defined intersection between the two colours. This is the result of the substrates being processed at 180oC, 80 seconds and 200oC, 40-80 seconds.
Figure 26 PBT Photographs of the decorated substrates at 140 -200oC
Figure 26 shows photographs of the PBT printed substrates. The process times run from 20-80 seconds, from left to right. The results in Table 14 show that at 140 oC, 20-80 seconds and 160oC, 20-60 seconds the decorated surfaces were too faint, as shown in Figure 27.
140 ºC 160 ºC
45
Figure 27 PBT Photograph of a faint decorated surface
At 180 oC, 20-80 seconds and 200 oC, 20-60 seconds all of the decorated surfaces were acceptable. At 200 oC, 80 seconds the image was too blurry, this was due to an excessive amount of free volume in the PBT causing the different coloured dyes to diffuse into each other using the polymer as a transport medium.
It must be considered that the dyes penetrate the polymer in “all directions”. As revealed dye penetration occurs into the polymer substrate as a result of the free volume. This enables the dyes to move across boundaries causing the image to blur when compared to the original condition.