1
Response Patterns during the Sing-a-Song Stress Test
Vera E.M. van Eijs
University of Twente
First reviewer: Matthijs L. Noordzij
Second reviewer: Erika van Wijk
Faculty of Behavioural, Management and Social Sciences
2
Abstract
The aim of this study is to investigate the relationship between psychophysiological and
subjective stress responses, and individual differences in these responses. Previous studies
have found mixed results when examining coherence between the different response types.
A few variables are thought to influence this coherence. Some researchers have found
distinct patterns of psychophysiological responses to stress. These patterns divide
individuals in groups with their own typical responses to stress. The Sing a Song Stress Test
(SSST) was used to invoke social stress in 154 participants. Heart rate, skin conductance
response and subjective stress were measured during five intervals. Firstly, coherence within
the automatic system (psychophysiological measurements) but not between the automatic
and reflective (or subjective) system was found. Secondly, two distinct response patterns
were found when examining skin conductance response. No distinct patterns were found for
the other variables. Assuming the two systems are qualitatively different, interventions and
training for dealing with stress or high-stress occupations should be aimed at one of both
systems. The second finding is of importance to research: examining responses to a certain
stressor should take into account the profiles different participants belong to. One stress
3
Glossary
Abstract... 2
Introduction 1. General introduction... 4
2. Individual differences in stress response ... 4
3. Inducing and measuring stress ... 6
4. Coherence within and between systems ... 7
5. Present study ... 9
Methods 1. Participants ... 11
2. Materials ... 12
3. Procedure ... 14
4. Data analysis ... 17
Results 1. Variables, descriptives and normality testing ... 21
2. Hypothesis 1 ... 23
3. Hypothesis 2 ... 26
Discussion ... 32
References ... 36
Appendix A ... 38
4
Introduction
In this paper, the relationship between physiological and experienced stress responses is
examined. The construct of stress is hard to accurately define. According to Van der Vijgh,
Beun, Van Rood & Werkhoven (2014):
“Stress is the state resulting from the ensemble of responses that are aimed at
(facilitating) restoration and/or maintenance of (psychological) homeostasis to internal or external stimuli that present (perceived) challenges to this (psychological) homeostasis.”
Stress is hereby defined as the collection of responses resulting from exposure to a
stressor. These responses can present themselves in three ways. First, stress can be felt as
subjective discomfort. In this case an individual would feel unpleasantly ‘stressed’. Second,
greater activation of the autonomic nervous system can be caused. This can be increased
heart rate or sin conductance, or increased production of cortisol. Lastly, stress can cause
certain behavioural responses. Usually these behaviours are aimed at decreasing subjective
discomfort and/or increased autonomic nervous system activation.
A stressor can also take different forms. It can be mental (like a difficult cognitive task),
social (like singing a song in front of strangers), or physical (like extreme heat or cold).
Furthermore, a distinction can be made between acute and chronic stress. An acute stressor
itself exists for a very limited time, while chronic stress is caused by a lasting stressor or
combination of stressors. This study focuses on the immediate physiological and experiential
effects of an acute social stressor, and how these two types of effects relate to each other.
This study is aimed at examining the relation between two of the mentioned stress response
systems: the automatic (or physiological) system, and the reflective (or subjective, or
experiential) system. First a short overview of individual differences in stress response will be
given, and second the relationship between the two systems will be examined.
Individual Differences in Stress Response
Stress responses tend to differ between situations and individuals, both
physiologically and subjectively. Differences exist for example in heart rate reactivity, as well
as in emotional and behavioural response. One such difference has been found in memory
of threatening information: some people actively repress threatening information
(repressors), while others actively rehearse this information (sensitizers) (Peters, Hock and
Krohne, 2012). These distinct styles influence later memory of stressors. This is an example
5 different stress responses, the same individual reacts differently to different stressors. One
stressor might cause increased heart rate, where another does not.
To study the effects of a particular stressor, it is useful to have some idea of the
variables that can cause individual differences in stress response. Several specific variables
have been linked with individual differences in both subjective discomfort and autonomic
nervous system activation when confronted with a stressor, a few examples of which will be
discussed below.
It has been hypothesized that different personality profiles influence and explain
variations of stress experience and coping. In the masterthesis by Nijboer (2015), however, it
is reported that no significant connection was found between any of the Big Five personality
traits and stress response, whether physiological or subjective. The question arises whether
other factors influence the relation between physiological and subjective stress responses.
A stressor can cause different responses in different people. A study by
Ruiz-Robledillo, Bellosta-Batalla and Moya-Albiol (2015) found that caregivers of autistic
individuals show lower cardiovascular reactivity to mental load than individuals who are not
caregivers of autistic individuals. Hardy and Smith (1988) found a connection between trait
hostility and greater anger proneness as well as greater blood pressure reactivity. These
studies both show that different individuals can show different physiological responses to the
same (cognitive) stressor.
A study by Johannes and Gaillard (2014) found some differences in physiological
response between hypertension patients, rheumatoid patients and the ‘healthy’ population.
Since these conditions have physiological symptoms, it is possible these as well as other
clinical conditions have some influence on individuals’ physiological response to stress. For
example, hypertension patients have higher blood pressure than the healthy population, and
possibly their heart rate measurements are affected by this. Another possibility is that not the
clinical condition, but the medication used to treat it is what causes any found differences. An
older study by Jacobs et al. (1994) provides evidence that beta blockers (used to reduce
hypertension) have no significant effect on skin conductance response in mental stress
research.
Apparently, both internal and external variables can increase or decrease stress
response. An external variable like caring for an autistic individual can lower a particular
6 stress. It is useful to further examine the individual differences in stress responses. As
illustrated by mentioned studies, individual differences exist in different psychophysiological
variables. How these differences coexist remains unclear. The question arises whether
different patterns can be discerned in different individuals. Possibly, an individual with a
certain pattern and intensity of heart rate response has a different pattern of skin
conductance response than an individual with a different heart rate patterns and/or intensity.
Indeed, Johannes and Gaillard (2013) found five typical response patterns. Their study
assessed seven different psychophysiological variables. Perhaps some specific patterns of
heart rate often co-occur with specific skin conductance patterns. This leads to a research
question that will be examined in the present study.
Inducing and Measuring Stress
Different methods of both inducing and measuring stress responses exist. Responses
to a stressor can be measured with self-report questionnaires, by observing behaviour or by
measuring autonomic physiological responses (Bali & Jaggi, 2015).
To be able to measure stress, it must first be induced. Besides that, stress is often
measured indirectly. Physiological arousal, measurable as autonomic nervous system
activation, can be used as an indicator of stress. To be able to measure stress and/or
arousal, either must first be induced. A number of paradigms to do so currently exist.
Negative emotions, and with them a level of stress, can be induced by exposing respondents
to film clips, pictures, or sounds. More refined paradigms for inducing stress have been
developed or are under development. One example is the Trier Social Stress Test
(Kirschbaum et al., 1993; Hellhammer & Schubert, 2012), in which participants are required
to perform mental and cognitive tasks in front of a three person committee.
Physiological response can be measured by heart rate, electrodermal activity, cortisol
levels, etc. Measuring heart rate is most useful in experiments that take a bit longer. since
the most meaningful data is contained in heart rate variability (Föhr et al., 2015; Kim,
Yuhnwan & Salahuddin, 2008). The greater the stress a person is exposed to, the more
rythmic this person's heart rate becomes, i.e. the smaller this person's heart rate variability.
Electrodermal activity is another often-used indicator of autonomic activation, for two main
reasons. First, it has a stable baseline. This means it does not fluctuate much while the
person is at rest. Second, electro-dermal activity increases quickly in response to mental
stress (Jacobs et al., 1994). Because of these two characteristics, most changes in
7 It is recommended to use more than one measure of physiology to examine
responses to stress. Using two or more measures improves reliability of results. However,
using too many can be impractical and, worse, applying too many sensors and equipment
may influence responses, thereby decreasing validity. Johannes & Gaillard (2014) used
seven different psychophysiological measures, which they consider a proper reduction of the
original 22 measures used (Johannes & Salnitski, 2004). Results were found to be equally
reliable. In this case using seven measures would be preferred over using 22. For the current
study two different physiological measures are used: Skin conductance response and heart
rate.
For the present study data will be used which have been acquired using the
Sing-a-Song Stress Test (further referred to as the ‘SSST’) as developed by Brouwer & Hogervorst
(2014). The SSST first requires participants to read a series of neutral sentences in order to
establish their arousal baseline, after which they are required to prepare and then sing a
song in front of a researcher and a stranger. This test has been shown to reliably invoke a
stress response in nearly all participants, when faced with the prospect of having to sing in
front of strangers. Advantages of the SSST are the short time it takes to complete, as well as
requiring participants to remain seated throughout the procedure which removes confounding
bodily movement. Initial testing of the SSST showed that the measured changes in heart rate
as well as SCR across one minute were very similar to those measured in the SSST across
ten minutes. The SSST has been shown to be useful for inducing stress, and can reliably be
used with measurements of heart rate and skin conductance responses.
Coherence Within and Between Response Systems
Many theories of emotion imply some level of response coherence. For example, if
someone becomes unpleasantly stressed following exposure to a stimulus, this will be
reflected in both their subjective experience and autonomic nervous system response(s).
Mauss, Levenson, McCarter, Wilhelm and Gross (2005) as well as Evers et al. (2014)
mention the importance of response coherence to many theories of emotion. According to
them, two conclusions can be drawn based on this. First, they assume strong emotions elicit
greater response coherence than weak emotions. Response coherence increases as the
intensity of an emotion increases (Davidson, 1992). Second, they assume different emotions
elicit different patterns of responding between the three response systems. One emotion
might trigger much autonomic nervous system activation, yet little experiential and
behavioural changes. These different response patterns can each be suited to a more or less
8 study is aimed at finding different response patterns when comparing individuals, since only
one experimental condition is used.
The article by Mauss et al. further lists results from several previous studies of
response coherence. Most of these studies found low to moderate correlations between
experiential, behavioural and physiological response systems. Important to note is that
results vary rather wildly. It is possible some variables exist which increase or decrease
response coherence, which have not been identified in previous studies. What variables
these are, remains up for debate.
A possible relationship between the reflective and automatic system has been
proposed by Jamieson, Mendes and Nock (2013). They propose that physiological
responses have some causal influence on subjective experience. An elaboration of this is
found in 'Conceptual Act Theory'. This theory argues that emotions are formed by an
interplay of physiological changes, external sensory information and knowledge of the
situation (Barrett, 2006). In other words, physiological responses to a stressor help shape the
subjective experience of this stressor. This implies the existence of at least some level of
coherence between physiological and experiential systems.
Another possibility is suggested by Evers et al. (2014). They propose a dual-process
framework: This framework distinguishes the automatic system, which consists of involuntary
physiological reactions, and the reflective system, which consists of subjective experience
and behavioural reactions. Evers et al. tested their hypotheses with 36 participants, who
were exposed to anger-inducing stimuli, and found some coherence within the two systems,
but not between them. It is possible this finding from a study inducing anger can be extended
to a study inducing social stress.
Kin, Yuhnwan and Salahuddin (2008) found a connection between heart rate
variability and self-reported stress. Individuals high in self-reported chronic stress showed
greater variations in HRV across five measurements over one day. Using the SSST, Brouwer
and Hogervorst found a correlation of r = .5 between skin conductance response and
self-reported stress. Both these studies provide evidence for the idea that the different response
systems are, in fact, somewhat related.
In a study by Johannes & Gaillard (2014) difficulties are reported concerning the
interpretation of correlations between subjective measures and performance results. It is
9 mechanisms. They propose a dual systems model to explain variations in stress response. A
clear distinction is made between subjective experience and memory of a stressor on the
one hand, and direct physiological responses on the other hand. They argue that reported
subjective experience can be distorted by memory bias. The greater the temporal distance
between stressor and time of reporting, the greater the bias. This theory is supported by a
study by Hellhammer and Schubert (2012), who found a strong correlation between
autonomic response and self-reported stress during the presence of the stressor, but not
before or after the stressor’s presence.
Another interesting variable influencing response coherence between systems was
found in a study by Mauss, Levenson, McCarter, Wilhelm and Gross (2005). They examined
the possible connections between experiential, physiological and behavioural responses to a
film which induced sadness and amusement. They found a stronger coherence between
behavioural and physiological responses when the intensity of the amusement experience
was greater. This effect was not found for sadness intensity. Intuitively, one can reason that
sadness does not induce much autonomic nervous system activation. A lack of physiological
response could explain a lack of response coherence between physiological, experiential
and behavioural systems.
Although differing results have been found, it would appear that there is some
connection between experiential and physiological responses to stress. Most notably Mauss
et al. (2005) found some coherence between systems, while Evers et al. (2014) found no
such coherence whatsoever. Time between actual stress response and measurement seems
to be a confounding variable as proposed by Johannes & Gaillard (2014) and Hellhammer &
Schubert (2012). Further, studies of chronic stress show a stronger coherence between
systems than do studies using acute stressors.
Present Study
The present study is aimed at examining two related research questions. The first
concerns the possible coherence within and between the reflective and the automatic
system. It is of interest to examine whether the aforementioned dual-systems framework is
supported by the current data. If it does, it is expected coherence within systems will be
significantly higher than coherence between systems. This possible coherence will be
examined by performing factor analyses of two types of variables: First, on the simple
physiological and self-report values found. Second, on the difference scores which are
obtained as described in the data-analysis subsection. These scores more reliably reflect
10 participants may consistently score higher or lower than average). Factor analysis groups
similar variables together, thus providing an overview of which sets of variables are coherent
and which are not.
Research question 1.
a) Does coherence exist within the automatic system?
b) Does coherence exist between both systems?
The dependent variables for hypothesis 1a are heart rate and skin conductance
response. The dependent variables for hypothesis 1b are heart rate, skin conductance and
self-reported stress.
Hypothesis 2 is based on within-system coherence. The study by Johannes and
Gaillard (2014) found five significantly different physiological response patterns. Though less
comprehensive than the suggestion by Mauss et al. (2005), which entails patterns containing
variables from three systems (physiological, experiential and behavioural), this is a possibility
that can be examined with the current study. Although the present study examines only two
physiological variables as opposed to seven, the question remains whether a limited number
of physiological response patterns can be distinguished. Furthermore, it will be examined
whether different patterns exist in the reflective system as well. Lastly the possibility exists
that the two systems combined provide a limited number of response patterns. These
possible patterns will be examined using hierarchical cluster analysis. This type of analysis
groups similar participants together, as long as the differences between the groups are big
enough.
Research question 2.
a) Does a limited number of typical physiological response patterns exist?
b) Does a limited number of typical reflective response patterns exist?
11
Methods
Participants
A total number of 154 individuals participated in this study. Each of them completed
the same experimental condition. The age of participants ranged from 18 to 55 with a mean
of 22.23 and a standard deviation of 4.18. Of these participants, 57 were male and 97 were
female, 91 were Dutch, 62 were German and one was Belgian. Before analysis, 14
participants were excluded due to missing skin conductance data caused by technical
reasons.
Participants were recruited through the University of Twente's research participant
pool (Sona Systems), or were personally recruited by the researchers. Students of the faculty
of behavioural sciences are given course credit for participating in various studies.
Participants were not given any other reward beyond this course credit. Since all participants
were volunteers, this is a convenience sample and not strictly a random sample.
The majority of participants were students of behavioural sciences at the University of
Twente. All were either native Dutch speakers or had acquired a certification in the Dutch
language (NT2, which is necessary for German students to start education at the University
of Twente).
People with diabetes and/or heart disease were excluded from the study, because
their medications might affect physiological measurements. One participant with diabetes
and one participant with a congenital heart deficiency were excluded.
Participants were told the study’s aim was to examine personality traits and physical
fitness, while in fact it was about personality and stress: to avoid pre-selection of those who
do or do not want to sing, and to prevent the possibility for participants to prepare themselves
beforehand and thereby ruin the surprise effect essential to this study. Before participating
they were asked to read and sign an informed consent form, as well as a physical contact
form. The latter is standard protocol at the University of Twente when physical contact
between researcher and participant is necessary for the study. In this case the researcher
needs to place sensors on the participant's body. Both of these forms can be found in
12
Materials
During the trials questionnaires and physiological measurement apparatus were
used. Both are described below, in their own subsection.
Questionnaires.
The experimental trials were presented on a personal computer running Windows
lean mode. This mode enables basic functionality, without internet access. A 60 Hz flat
screen with 1280x720 resolution was placed approximately 60 centimetres from the
participant. The script showing the instructions was written in PsychoPy by dr. M. Noordzij.
The questionnaires were presented on a laptop, also running Windows lean mode. All
were displayed in Google Chrome in separate tabs, and were written in Dutch. The auto-fill
function was disabled, so participants would not see any answers submitted by previous
participants. Non-Dutch participants were allowed to use a translation website of their own
choice. All participants completed the NEO-FFI and a demographic questionnaire. The first
102 participants also completed the IRS. Participants 103 to 154 completed the UCL
(Utrechtse Coping-Lijst) instead of the IRS.
The demographic questionnaire contained questions relating to smoking and drug
use, exercise frequency and intensity, medicine use, and experience with singing or other
public performance. This questionnaire was constructed using the website 'Thesistools'.
The NEO Five Factor Inventory assesses five personality traits; Openness to
experience, conscientiousness, extraversion, agreeableness and neuroticism. These traits
are measured by 60 questions using a 5 point scale. The NEO-FFI was provided by TNO.
For the first 102 participants, the IRS was used to assess coping skills and strategies.
For the last 52 participants the UCL was used for the same purpose. The latter contains 47
questions using a 4 point scale, and identifies 7 different coping styles.
To measure self-reported stress, a program written in Python was used. At two
different moments participants were asked to rate their subjective stress on a scale from 1 to
9. The first moment was just prior to starting the experimental trial, to establish a baseline.
The second moment was after singing. At this second moment, participants were asked to
rate their stress during 'preparing', 'singing', right after singing and at the moment of rating.
13
Measurement apparatus.
Two sets of apparatus were used: one to measure heart rate and another to measure
skin conductance response.
Heart rate
To measure the heart rate of participants, the EKG package from Biograph Infiniti was
used. This package includes sensors, a voltage isolator, amplifier and cables, and three
detachable silver ionized (Ag-AgCl) button sensors; one black, one blue and one yellow.
Lastly the package also contains two re-usable medical grade non-latex tourniquets. The
black sensor is a ground which is attached to the radiant side of the left arm. The blue sensor
is secured to the same tourniquet as the black sensor, and is attached to the centre of the
left wrist. The yellow sensor is secured with the second tourniquet, and makes contact with
the centre of the right wrist. The recording frequency was 256 Hz and the sensor supply
voltage was 7,3 mV.
Skin conductance
To measure the skin conductance response of participants, the SCR package from
Biograph Infiniti was used. This package consists of two wearable finger sensors. Also used
was the EDA wrist sensor, not part of the Biograph Infiniti package. The two finger sensors
are to be worn on the same hand; attached with velcro strip on the ring and index finger of
the left hand. The sensors make contact on the palm side of the middle phalanges. The
recording frequency was 256 Hz, and the sensor supply voltage was 7,3 mV.
The EDA wrist sensor was synchronised with the computer to be able to later match
the starting time with the assignment windows. The wrist sensor is not a part of the Biograph
Infiniti package and the segments are not marked by the voltage isolator pulses. Segments
are still easily identified based on the start time, logged on the same computer the wrist
sensor is synchronized with.
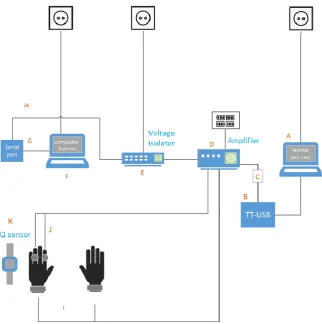
The SCR and HR sensors converge in two cables that are inserted in the amplifier in port C
(SCR) and port E (HR). The voltage isolator is inserted in port (H). Sensors attach to the
ProComp Infiniti 8 channel amplifier in ports measuring at 256Hz (C through G) and provide
anti-aliasing filter (5th order Butterworth, 30dB typical rejection). The amplifier is connected
to the same laptop featuring the personality tests via the TT-USB-T7700 that transforms the
fibre optic signal to USB. This laptop is loaded with BioGraph Infiniti Software used to store
the data in a comma separated values format and monitor the signal in real time to check for
14
[image:14.595.72.395.142.467.2]Set-up.
Figure 1 shows how the sensors were attached to each participant.
Figure 1. Symbolic representation of sensor placement.
Infiniti laptop (A), TT-USB (B), Optic fibreglass cable (C), Amplifier + 4x 1,5V batteries (D), Voltage isolator (E), Python computer (F), Serial port (G), Custom db15 to serial port cable (H), Wrist HR sensors (I), SC finger sensors (J), Q sensor (K). The hands show the orientation of the participant towards the computer.
Procedure
Since all participants completed the same trials once, this study uses a
between-subjects design. The independent variable in this study is unexpected pressure to sing in
front of two other people. This is achieved by introducing the confederate, who poses as
another participant who has arrived early. Participants are then prompted to sing a song,
which they were not informed about beforehand. This produces physiological and subjective
stress in participants. Thus it becomes possible to compare participants with different
15
Introductions.
Participants were instructed to be at the University of Twente research lab at the
allotted time. The experiment was conducted in one of the rooms of the lab. Upon arrival,
participants were allotted their number to ensure anonymity when analysing the data. This
number is linked to all questionnaires and measurements of this participant. Participants
were told they were participating in a study of physical fitness and personality factors.
Informed consent form + physical contact form (because of the placement of sensors
on the body by a researcher, standard procedure at UTwente: reason for physical contact,
researchers contact info, complaint procedure). Both forms in appendix.
Questionnaires.
Participant is instructed to take place at laptop. Instructions on how to open/fill in
questionnaires previously described in this paper. Takes about 30 minutes. Participants are
left in the lab room, instructed to knock on door in case of questions or when finished.
Researcher monitors participant through closed video camera system.
Experimental trial.
Confederate is let inside the lab room, takes place at laptop while participant moves
to computer. Confederate is given the same instructions as participant, and then appears to
be filling in the same questionnaires. Sensors are placed on participant as explained under
the materials subsection, most jewellery and/or accessories need to be removed to provide
room for these sensors. EDA is attached first, since this needs the most time to make
adequate contact, next heart rate sensors are attached, and lastly, the SCR sensors are
attached.
After all the sensors are placed, the confederate asks about his/her participant
number to provide the researcher with an opportunity to look at the Biograph screen to check
whether all the sensors are functioning. Participant is instructed to find a comfortable sitting
position and not move for the duration of the trial (approximately eight minutes). Confederate
is instructed to pause filling in the questionnaires and be silent for the duration of the trial.
Researcher and confederate are both in the room during the trial.
Trial prompts.
The experimental trial shows eight instructions in fixed order. It starts with the simple
16 assignments are prompted, each during an interval of 30 seconds. An example of a neutral
assignment is to think of as many animals as possible starting with the letter ‘p’. The sixth
prompt is to think of a song you can sing for 30 seconds. The following instruction is to
actually sing this song, and the final instruction is identical to the first (relax and focus on
breathing).
During ‘preparing’ and ‘singing’ the researcher may be required to encourage
participants to remain sitting still, confirm that the assignment of singing is serious, or lightly
encourage participants to sing. During this part of the trial, the confederate acts surprised
when learning he will (supposedly) have to sing later on.
The last task the participant has to complete is filling in the second part of the
subjective stress questionnaire. Measurements are stored on the computer automatically.
The researcher then removes the sensors and thanks the participant for his or her
cooperation. The confederate stores the physiological measurements on the laptop, under
the participant’s assigned number.
Debriefing.
After finishing the entire trial, the participant is informed of the deception and the true
purpose of the study. They are asked whether or not they believed the confederate was
another participant, and are given the opportunity to leave their contact information in case
they wish to learn of the outcomes of the study. During this debriefing the confederate stores
information on whether the participant sang, sang too early or too late, and whether the
participant believed the confederate was another participant. These data can be used for
further analysis, or as selection criteria in further analysis.
Confederate.
The confederate is required to perform certain actions during the trial, to keep up the
appearance that he is another participant. Upon entry into the lab room, he or she is seated
at the laptop. To maintain the illusion that he is filling in the questionnaires while he is
actually just browsing the internet, frequent clicking and scrolling is required. Next, after all
the sensors are attached, the confederate provides the researcher with an opportunity to
check the functionality of the sensors. During the trial, he should act surprised or anxious
about discovering he will have to sing later on.
Only one experimental trial means little possibilities for control features
17 discussion/recommendations; a slightly different grouping principle could make control
features more feasible (especially when a larger sample is available?).
Data Analysis
To analyze the gathered data, IBM SPSS Statistics version 21 was used. Before
analysis, some variables were transformed. This is explained in the next subsection. Next,
normality tests were performed on the resulting variables. Lastly, and most importantly, how
the three hypotheses were tested will be explained per hypothesis.
Transformation of variables.
To be able to make valid comparisons between the different measurement types
(heart rate, sin conductance and self-reported stress), data on concurring timeframes is
needed. The physiological variables are measured in timeframes of 30 seconds each, while
self-reported stress is measured in timeframes of one or two minutes each. The variables are
made comparable by calculating the mean of the four pre-baseline measurements (of heart
rate and skin conductance, separately), the four neutral prompts measurements, the first two
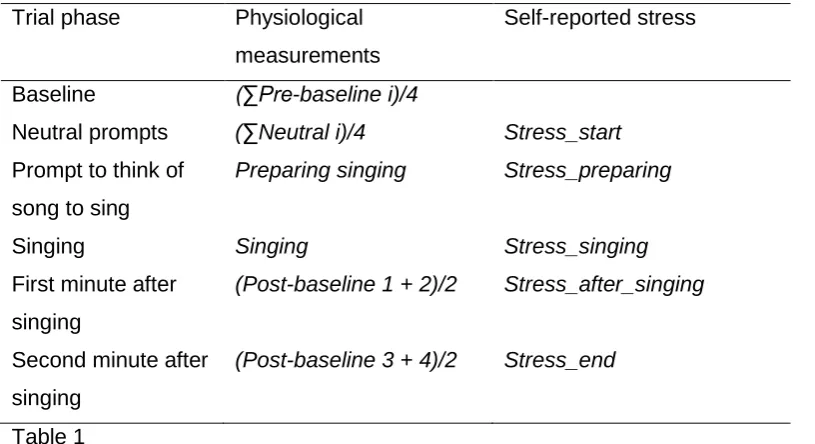
post-baseline measurements and the last two post-baseline measurements. Table 1 shows
the functions used to calculate these means as well as the self-reported stress
measurements, ordered by the trial phase in which they occur.
Transformation of 'raw' variables
Trial phase Physiological
measurements
Self-reported stress
Baseline (∑Pre-baseline i)/4
Neutral prompts (∑Neutral i)/4 Stress_start
Prompt to think of
song to sing
Preparing singing Stress_preparing
Singing Singing Stress_singing
First minute after
singing
(Post-baseline 1 + 2)/2 Stress_after_singing
Second minute after
singing
[image:17.595.65.473.485.707.2](Post-baseline 3 + 4)/2 Stress_end
Table 1
Next, the resulting values were used to calculate difference scores to limit the
18 and their reaction to the social stressor. By determining the change between measuring
moments, the resting score is removed and individual reactivity can be examined. The
difference scores were calculated by calculating the difference between one measurement
and the measurement immediately following. Tables 2, 3 and 4 provide an exact overview of
the functions used to calculate these scores and the names of the resulting variables.
Calculation of difference scores: Heart rate
HR_change_0 HR_neutral - HR_prebase
HR_change_1 HR_prep - HR_neutral
HR_change_2 HR_sing - HR_prep
HR_change_3 HR_post1 - HR_sing
HR_change_4 HR_post2 - HR_post1
Table 2
Calculation of difference scores: Skin conductance
SCR_change_0 SCR_neutral - SCR_prebase
SCR_change_1 SCR_prep - SCR_neutral
SCR_change_2 SCR_sing - SCR_prep
SCR_change_3 SCR_post1 - SCR_sing
SCR_change_4 SCR_post2 - SCR_post2
Table 3
Calculation of difference scores: Self-report
Selfreport_change_1 Stress_preparing - stress_start
Selfreport_change_2 Stress_singing - Stress_preparing
Selfreport_change_3 Stress_after_singing - Stress_singing
Selfreport_change_4 Stress_end - Stress_after_singing
Table 4
As shown in the above tables, three sets of difference scores were the result: Five
heart rate difference scores, five skin conductance difference scores and four self-report
difference scores. The added numbers indicate the timeframe on which they contain
19
Normality testing.
Both the transformed raw variables and the difference scores are subjected to
normality testing. Because the sample size is relatively small (n < 2000), the Shapiro-Wilk
test will be performed. This will provide a statistic W and its significance for each tested
variable. If W is or could be equal to 1, normality can be assumed. If it is not equal to 1,
normality cannot be assumed.
Hypothesis 1.
The first hypothesis states that there is coherence within the automatic system, and
that there is no coherence between the automatic and reflective system. To test this
hypothesis, factor analysis was performed. In factor analysis no distinction is made between
dependent or independent variables. For this study varimax rotation was used. Eigenvalues
and scree plots were examined. How many factors were considered present was based on
how many factors had eigenvalues above 1, as well as at what number of components the
scree plot shows a sudden 'break', if at all. When only one factor was found, the analyzed
variables were considered coherent. When more than one factor was found, coherence could
not so easily be assumed. When variables from the same timeframe (for example, heart rate
change and self-reported stress change between the preparation phase and the singing
phase) were loaded onto the same factor, these particular variables would be considered
more or less coherent.
To determine whether coherence within the automatic system exists in the current
dataset, factor analysis was performed twice: First on the raw scores of heart rate and skin
conductance, and second on the difference scores of heart rate and skin conductance.
To determine whether coherence between the automatic and reflective system exists
in the current dataset, factor analysis was performed on:
1. the 'raw' scores of self-reported stress and heart rate;
2. the 'raw' scores of self-reported stress and skin conductance;
3. the difference scores of self-reported stress and heart rate;
4. the difference scores of self-reported stress and skin conductance.
Hypothesis 2.
The second hypothesis states that different typical response patterns can be
distinguished. Using the difference scores, three different possibilities were examined:
20 Combined profiles of self-reported stress, heart rate and skin conductance.
To examine whether typical response patterns exist in the current dataset, and of
what values these possible patterns exist, two-step cluster analysis was performed using
each above-mentioned set of variables. Schwarz' Bayesian Criterion was used as the
clustering criterion. For the distance measure first Euclidian distance was used, and second
log-likelihood was used. New variables were created to show which clusters each participant
was a member of. If more than one cluster was found the quality of these clusters was
determined. Quality is automatically ranked by SPSS as either 'poor', 'fair' or 'good'. Clusters
that were ranked 'poor' were excluded from further analysis.
Whenever more than one cluster was found and the quality was rated as either 'fair'
or 'good', the response patterns of each cluster were examined using the minimum value,
median and maximum value. The medians were plotted for each interval to graphically
represent the found patterns. The graphs that were created this way show the amplitude of
21
Results
Transformed Variables and Descriptives
Calculating the means of the variables as explained in the data analysis subsection
resulted in six heart rate variables and six skin conductance variables. Calculating the
difference scores resulted in five heart rate variables, five skin conductance variables and
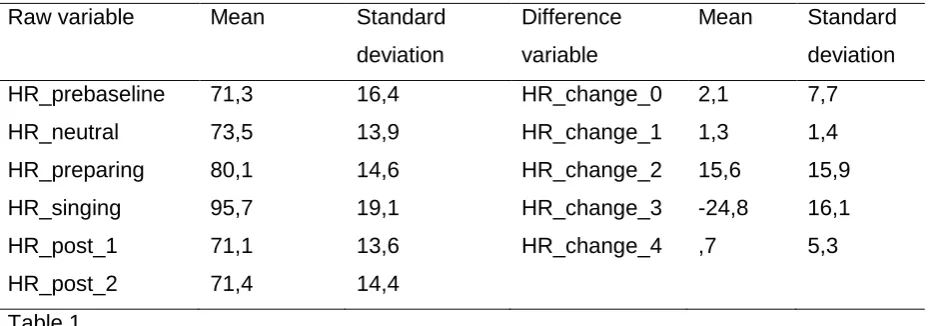
four self-report variables. Tables 1, 2 and 3 list the means and standard deviations of all
resulting variables. To recap, change_0 is the change in measured value between the
baseline measurement and the neutral prompts. Change_1 is the change between the
neutral prompts and the preparation phase, which was an increase in nearly all cases.
Change_2 is the change between the preparation phase and the singing phase. Change_3 is
the change between the singing phase and the first minute after singing, which was a
decrease in nearly all cases. Lastly, change_4 is the change between the first and second
minute after singing.
Heart rate variables after transformation
Raw variable Mean Standard
deviation
Difference
variable
Mean Standard
deviation
HR_prebaseline 71,3 16,4 HR_change_0 2,1 7,7
HR_neutral 73,5 13,9 HR_change_1 1,3 1,4
HR_preparing 80,1 14,6 HR_change_2 15,6 15,9
HR_singing 95,7 19,1 HR_change_3 -24,8 16,1
HR_post_1 71,1 13,6 HR_change_4 ,7 5,3
[image:21.595.67.532.373.536.2]HR_post_2 71,4 14,4
Table 1
Considering the raw scores, the highest values were shown during the singing phase,
and the second highest values during the preparation phase. When looking at the difference
scores, the most notable findings were the highly positive value at change_2 (preparing -
22
Skin conductance variables after transformation
Raw variable Mean Standard
deviation
Difference
variable
Mean Standard
deviation
SCR_prebaseline 2,1 1,5 SCR_change_0 -,8 ,9
SCR_neutral 1,2 1,3 SCR_change_1 1,3 1,4
SCR_preparing 2,6 1,9 SCR_change_2 ,6 1,7
SCR_singing 3,2 2,0 SCR_change_3 -1,1 1,7
SCR_post_1 2,1 1,7 SCR_change_4 -,5 ,9
[image:22.595.65.539.88.249.2]SCR_post_2 1,7 1,5
Table 2
Somewhat similar to the heart rate descriptives, skin conductance response was
highest during the singing timeframe and second highest during the preparation timeframe.
This effect seemed more clear when looking at the difference scores: Increases in skin
conductance response were shown at timeframes change_1 and change_2. However, at
timeframe change_2 the standard deviation was considerably greater than the mean.
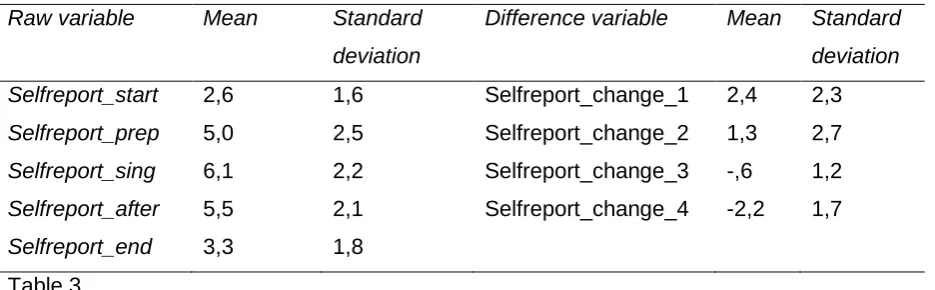
Self-report variables after transformation Raw variable Mean Standard
deviation
Difference variable Mean Standard deviation Selfreport_start 2,6 1,6 Selfreport_change_1 2,4 2,3
Selfreport_prep 5,0 2,5 Selfreport_change_2 1,3 2,7
Selfreport_sing 6,1 2,2 Selfreport_change_3 -,6 1,2
Selfreport_after 5,5 2,1 Selfreport_change_4 -2,2 1,7
Selfreport_end 3,3 1,8 Table 3
Besides the recurring high values during the preparation and singing phases,
self-reported stress was also high right after the singing phase. The difference scores showed a
more nuanced picture, as there was apparently an increase at change_1 (start - preparing)
and change_2 (preparing - singing), but a small decrease at change_3 (singing - after
singing). However, change_3 again was found to have a greater standard deviation than
mean. A more telling decrease was found at change_4 (after singing - end).
Normality testing.
After performing the Shapiro-Wilk test on all variables contained in tables 1, 2 and 3,
[image:22.595.67.535.412.557.2]23 distributed. This was the difference score of skin conductance 3 (SCR_change_3). Most of
the other variables were shown to have a relatively high statistic for this test (W > ,90), but
this statistic was also statistically significant (p < ,01) in nearly all cases. Therefore it could
not be assumed that these variables are normally distributed. The results can be found in
tabular form in appendix B.
Hypothesis 1
The first hypothesis states that there is coherence within the automatic system, and
that there is no coherence between the automatic and reflective system. First was examined
whether coherence could be found within the automatic system. This was done by analyzing
heart rate and skin conductance. Second was examined whether coherence could be found
between the automatic and reflective system. To do this, first heart rate and self-reported
stress were analyzed together, and second skin conductance and self-reported stress were
analyzed together.
Coherence within the automatic system (HR - SCR). Raw scores.
Performing a factor analysis on heart rate and skin conductance resulted in two
components with eigenvalue greater than one. Together, these two components explained
almost 74% of the found variance. In slight disagreement with the found eigenvalues, the
scree plot strongly inclined at three components. The found loadings quite clearly matched
heart rate to factor 1 and skin conductance to factor 2.
Difference scores
By performing factor analysis on the difference scores of heart rate and skin
conductance, four factors were found which had an eigenvalue greater than 1. Together
these factors explained about 70% of the found variance. The accompanying scree plot did
not show any clear 'breaks', and therefore did not add much interpretative value.
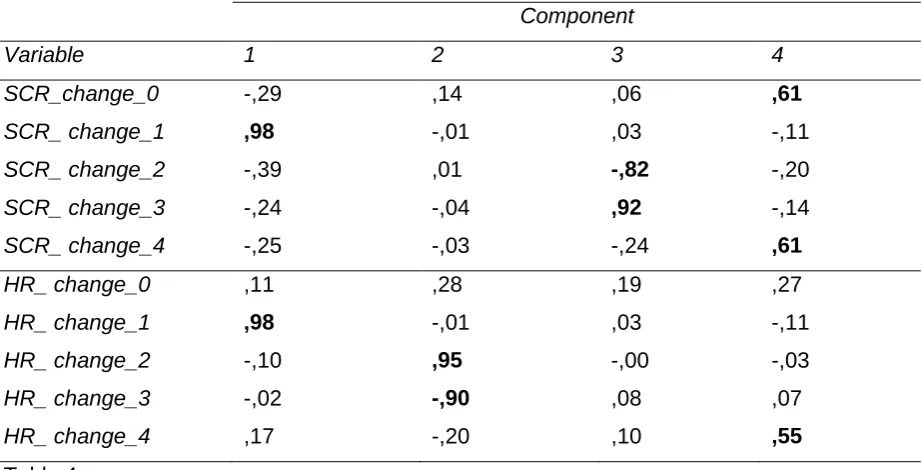
As shown in table 4, the pattern of factor loadings was quite different when analyzing
24
Factor loadings of physiological difference scores
Component
Variable 1 2 3 4
SCR_change_0 -,29 ,14 ,06 ,61
SCR_ change_1 ,98 -,01 ,03 -,11
SCR_ change_2 -,39 ,01 -,82 -,20
SCR_ change_3 -,24 -,04 ,92 -,14
SCR_ change_4 -,25 -,03 -,24 ,61
HR_ change_0 ,11 ,28 ,19 ,27
HR_ change_1 ,98 -,01 ,03 -,11
HR_ change_2 -,10 ,95 -,00 -,03
HR_ change_3 -,02 -,90 ,08 ,07
[image:24.595.69.530.89.324.2]HR_ change_4 ,17 -,20 ,10 ,55
Table 4
Components 2 and 3 match with variables from either heart rate or skin conductance,
not both. Component 1 contains the SCR and HR difference scores from timeframe
change_1.
Coherence between the automatic and reflective systems (HR - self-report and SCR - self-report).
Heart rate and self-report: Raw scores
Performing a factor analysis on the raw scores of heart rate and self-reported stress
resulted in two components with an eigenvalue greater than 1, which together explained
about 70,9% of found variance. The accompanying scree plot showed a clear incline at three
components, however. Again, the found components exactly matched the two systems:
Heart rate was placed under component 1 and self-reported stress was placed under
component 2.
Heart rate and self-report: Difference scores
Factor analysis of the difference scores of heart rate and self-reported stress resulted
in double the number of components: four, together explaining 67,8% of variance. The
accompanying scree plot did not show any clear inclines, and was therefore deemed
inconclusive. These results explained a lower percentage of observed variance than the
other results so far; less than 70%. Table 6 shows the distribution of variables across
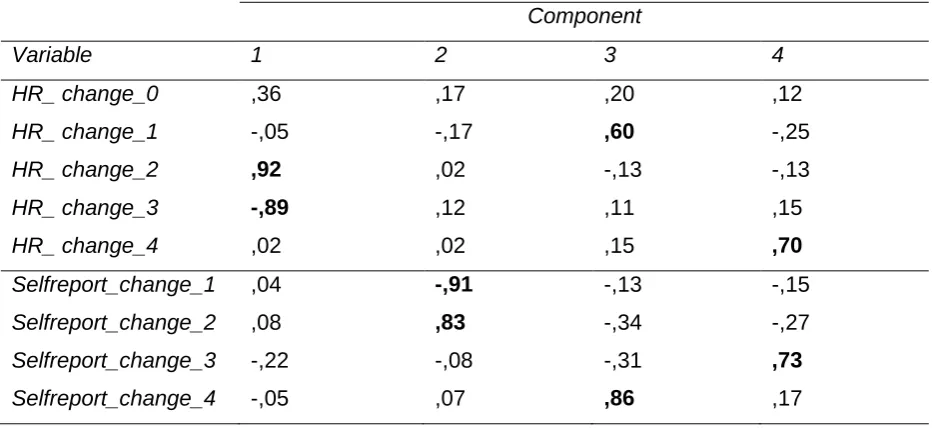
25
Factor loadings of difference scores: Self-report and heart rate Component
Variable 1 2 3 4
HR_ change_0 ,36 ,17 ,20 ,12
HR_ change_1 -,05 -,17 ,60 -,25
HR_ change_2 ,92 ,02 -,13 -,13
HR_ change_3 -,89 ,12 ,11 ,15
HR_ change_4 ,02 ,02 ,15 ,70
Selfreport_change_1 ,04 -,91 -,13 -,15
Selfreport_change_2 ,08 ,83 -,34 -,27
Selfreport_change_3 -,22 -,08 -,31 ,73
[image:25.595.65.534.89.303.2]Selfreport_change_4 -,05 ,07 ,86 ,17 Table 6
Components 1 and 2 contain either heart rate variables or self-report variables, not
both. Components 3 and 4 are mixed: they contain both a heart rate variable and a
self-report variable, though none from the same timeframe.
Skin conductance and self-report: Raw scores
Factor analysis resulted in two components with eigenvalue greater than 1, but with
only moderate explanatory value. About 66,7% of the observed variance was explained by
these two components. Similar to results presented earlier, the scree plot suggests there was
one more component. Also similar to results presented earlier, the raw scores were divided
neatly into two components matching the two systems. All skin conductance variables were
placed under component 1, and all self-reported stress variables were placed under
component 2.
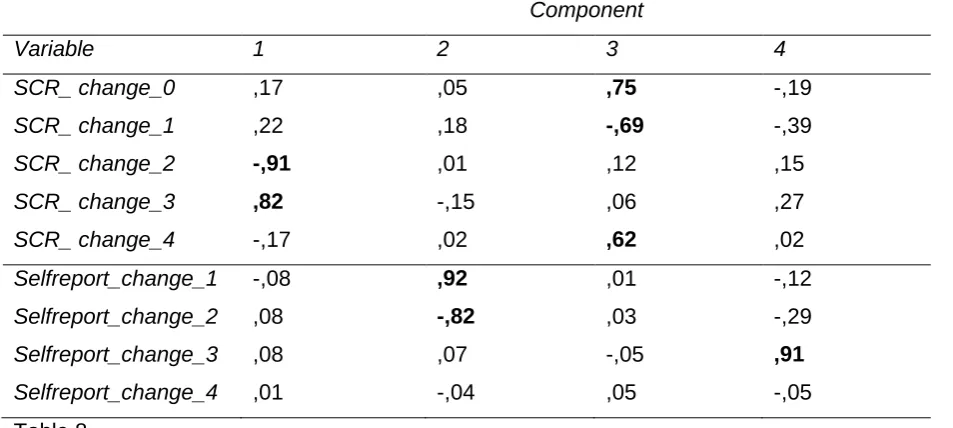
Skin conductance and self-report: Difference scores
When analyzing the difference scores, a very different pattern emerged. Five
components were found, which together explained about 80,7% of the observed variance.
Their eigenvalues did not differ much. The accompanying scree plot showed no obvious
'breaks', and therefore did not add much interpretative value. Table 8 provides an overview
26
Factor loadings of difference scores: Self-report and SCR
Component
Variable 1 2 3 4
SCR_ change_0 ,17 ,05 ,75 -,19
SCR_ change_1 ,22 ,18 -,69 -,39
SCR_ change_2 -,91 ,01 ,12 ,15
SCR_ change_3 ,82 -,15 ,06 ,27
SCR_ change_4 -,17 ,02 ,62 ,02
Selfreport_change_1 -,08 ,92 ,01 -,12
Selfreport_change_2 ,08 -,82 ,03 -,29
Selfreport_change_3 ,08 ,07 -,05 ,91
[image:26.595.64.541.92.306.2]Selfreport_change_4 ,01 -,04 ,05 -,05 Table 8
Not a single component contained both self-report and SCR variables. What stood
out somewhat, was that component 1, 2 and 3 all contained two variables of adjacent
timeframes.
Hypothesis 2
The second hypothesis stated that different typical response patterns can be
distinguished. Only difference scores were analyzed. The following three possibilities for
finding patterns were examined using two-step cluster analysis:
Physiological profiles of heart rate and skin conductance; Self-reported stress profiles;
Combined profiles of self-reported stress, heart rate and skin conductance .
Physiological profiles.
First Euclidian distance was used as distance measure because log-likelihood
assumes variables are independent and have a normal distribution. Standardized values
were used for this analysis. Using all physiological variables, only one cluster was found.
Using log-likelihood to cluster all physiological variables found two clusters, the
quality of which was rated as 'fair'. Of all participants, 32 were deemed outliers, and were
therefore not assigned to a cluster. A new variable for cluster membership was created, with
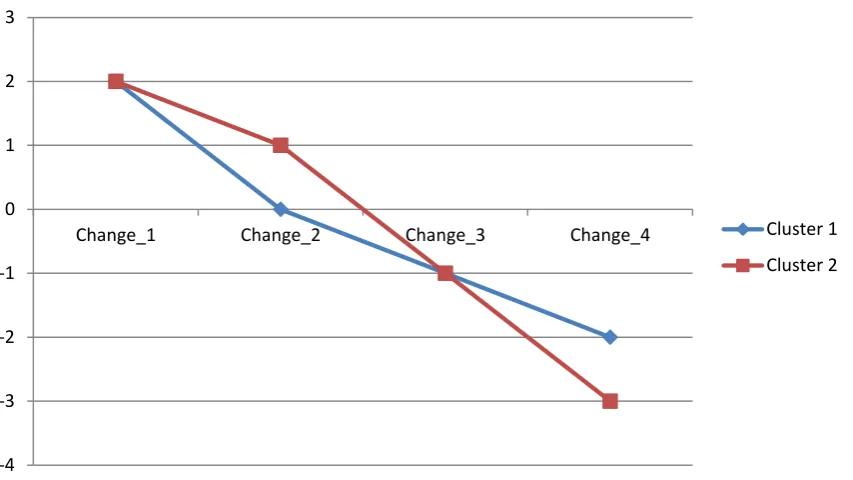
27 To compare the two physiological clusters, some descriptives were gathered and the
medians were plotted. First, self-reported variables were examined. Minimum value, median
and maximum value are shown in table 9, as well as number of participants in each cluster.
The spread between minimum and maximum values was quite large. To provide a
clearer image of the pattern, a plot was created. The found medians were plotted for each
timeframe. Cluster 2 shows greater response intensity, but the overall pattern of both clusters
[image:27.595.78.505.260.500.2]is similar.
Figure 2. Medians of self-reported stress for both physiological clusters.
Next, heart rate patterns were examined. Again, the data were graphically
represented, as shown in figure 3. Both clusters showed a very similar pattern. Average
intensity did not differ much either.
-4 -3 -2 -1 0 1 2 3
Change_1 Change_2 Change_3 Change_4 Cluster 1
28 Figure 3. Medians of heart rate for both physiological clusters.
Thirdly, skin conductance response was examined. The same descriptives are
graphically represented in figure 4. The plot showed distinctive patterns of skin conductance
response. Cluster 1 was characterized by a steep rise at change_1, followed by no change at
change_2. Cluster 2 showed a much weaker increase at change_1, and a slightly greater
increase at change_2. The pattern seemed similar at change_3 and change_4.
Skin conductance patterns when comparing physiological profiles:
Figure 4. Medians of skin conductance response for both physiological clusters.
-35 -30 -25 -20 -15 -10 -5 0 5 10 15 20
Change_0 Change_1 Change_2 Change_3 Change_4
Cluster 1 Cluster 2
-2 -1,5 -1 -0,5 0 0,5 1 1,5 2 2,5 3
Change_0 Change_1 Change_2 Change_3 Change_4
Cluster 1
[image:28.595.80.437.496.735.2]29
Self-report profiles.
When analyzing all variables with Euclidian distance as distance measure, only one
cluster was found. Using log-likelihood however, three clusters were found. The quality of
these clusters was rated as 'fair'. Using these clusters, further analysis was possible. Same
as before, patterns of self-report, heart rate and skin conductance were examined.
First self-reported stress was examined. The medians were plotted, as shown in
figure 5. The plot in figure 5 shows the differences between the three clusters. Clusters 1 and
2 had the same starting point. Cluster 2 rose steeply at the following timeframe and then
dropped steeply, whereas the plot for cluster 1 was nearly a horizontal line. Cluster 3 started
[image:29.595.78.506.322.564.2]at the highest observed point, but has no other positive values (except 0 at change_2).
Figure 5. Medians of self-reported stress clusters.
Second, heart rate was examined. Some differences between the found medians
were observed, but when plotted, these differences did not lead to different patterns. The
only difference between the clusters was the intensity.
-4 -3 -2 -1 0 1 2 3 4 5 6
Change_1 Change_2 Change_3 Change_4
30 Figure 6. Medians of heart rate for each self-report cluster.
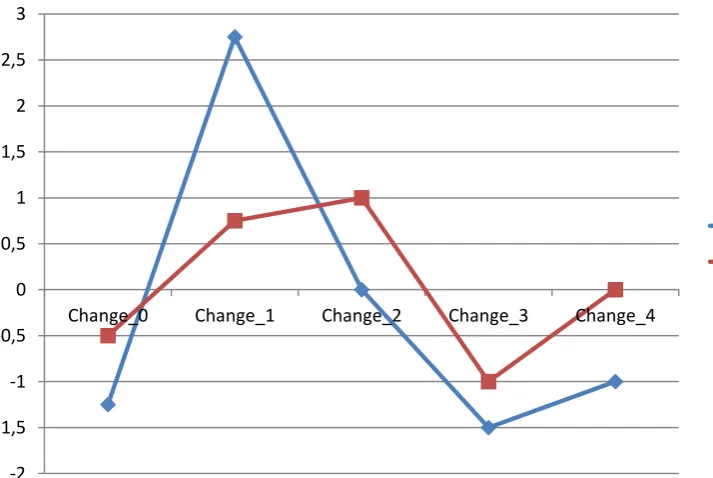
Thirdly, skin conductance response was examined. Two different patterns became
evident after plotting the medians. Cluster 1 and cluster 3 were very similar, but cluster 2 was
a horizontal line of value 0 at change_2 to change_4.
Figure 7. Medians of skin conductance response for each self-report cluster.
-30 -20 -10 0 10 20 30
Change_0 Change_1 Change_2 Change_3 Change_4
Cluster 1 Cluster 2 Cluster 3
-1,5 -1 -0,5 0 0,5 1 1,5
Change_0 Change_1 Change_2 Change_3 Change_4
Cluster 1
[image:30.595.77.500.442.680.2]31
Combined profiles.
When analyzing all variables (self-report, heart rate and skin conductance) using
Euclidian distance as the distance measure, only one cluster was found. Using log-likelihood,
again only one cluster was found. Further analysis was therefore not useful for the present
32
Discussion
The present study was aimed at answering two research questions. The first was
whether coherence exists within and/or between the reflective and the automatic system.
According to Evers et al. (2014) the reflective system consists of an individual's subjective
experience and behaviour, while the automatic system consists of involuntary physiological
responses. Coherence between heart rate and skin conductance response was found during
the presence of the social stressor, which is evidence for coherence within the automatic
system. No coherence was found between self-reported stress and either heart rate or skin
conductance. The second research question was whether distinct response patterns could
be distinguished when comparing groups of individuals, as was found by Johannes and
Gaillard (2014). Two patterns of skin conductance response were found, and three patterns
of self-reported stress. Both research questions will be further discussed in their own
subsections, as well as the implications of the present findings for possible interventions,
training and further research.
Research question 1
The core of the first hypothesis is the possible coherence within and between the
different systems.
Coherence within the automatic system.
It was expected some coherence would be found within the automatic system. This
was a clear prediction from the studies by Evers et al. (2014) and Mauss et al. (2005). In the
present study this would present as heart rate and skin conductance measures being
factored together. Analyzing the raw scores, no coherence was found at all: all heart rate
variables were placed under one factor, and all skin conductance variables were placed
under another. Since the two are distinctly different measurements, this was to be expected.
When analyzing the difference scores however, the image was not so clear. What stood out
was that the variable on the difference between neutral prompts and the preparation phase
was placed under factor 1: This is evidence for the idea that, during this particular timeframe
of increasing stress and/or anticipation, heart rate and skin conductance are coherent.
Coherence between the reflective and the automatic system.
A 'raw score' factor analysis again neatly and clearly divided the different
measurement types into their own categories. Factoring the difference scores again
presented a quite different pattern. Some variables within one measurement type were
33 scores from timeframe 2 and 3). No coherence was found between any variables of different
measurement types.
The answer to this research question is the same as was predicted by Mauss et al.
(2005) and found by Evers et al. (2014). During the presence of a stressor (a social stressor
in the case of the present study), the two variables of the automatic system were coherent.
No coherence was found between the reflective and the automatic system. Within-system
coherence was found, whereas between-systems coherence was not.
A confounding variable in this study might be the time passed between the
experimental trial and the measurement of subjective stress. Hellhammer and Schubert
(2012) measured psychological stress during and after their experimental trial (the Trier
Social Stress Test, which has similar effects as the SSST), and found a modest covariance
when comparing directly measured subjective stress with physiological measurements, but
not when comparing subjective stress measured after the trial. Results for this study might be
different if subjective stress can be measured during the trial.
Gaining a clearer image of the different aspects of stress response and how they
interact, can aid in constructing better interventions and training for dealing with certain
stressors. From the present study it seems the reflective and automatic system are quite
separate constructs. Therefore it logically follows interventions and training should be aimed
at either one of the systems, or at both while respecting the differences between them.
Research question 2
The second hypothesis entails the possible response patterns of participants.
Examined was whether a specific number of profiles could be distinguished within the
present study's dataset.
Two different physiological clusters were found by performing two-step cluster
analysis. When plotting the self-reported stress, heart rate and skin conductance response it
became clear that only skin conductance response contained clearly different patterns. The
two plots for the heart rate data were very similar.
Three different self-reported stress profiles were found. The plots of the medians of
these three profiles indeed showed three distinct response patterns. Plotting the heart rate of
34 were however two different skin conductance patterns. Two clusters were very similar, but
another stood out.
Apparently, most participants had the same pattern of heart rate change during the
trial. Two different patterns of self-reported stress were distinguished, and three different
patterns of skin conductance response. One of the self-reported stress patterns occurred
together with a distinct skin conductance response pattern. Apparently, a high increase in
subjective stress when having to sing somewhat predicts steady skin conductance response
after singing. This connection hardly approaches the five 'Autonomic Response Patterns'
found by Johannes and Gaillard (2014), but it provides evidence for a non-linear coherence
between the automatic and reflective systems.
An important difference between this study and the study by Johannes and Gaillard is
the number of psychophysiological measures. The present study used two (heart rate and
skin conductance response), while the other study used five. Presently no pattern differences
were found in the heart rate measurements. All participants showed the same response
pattern, although intensity varied slightly. Different patterns were only found when comparing
skin conductance response. The Johannes and Gaillard study did find significantly different
patterns in all psychophysiological measurements. Perhaps this is due to the nature of the
stressor used: a cognitive/mental stressor versus a social stressor (present). It is possible
that most or all individuals show the same pattern of heart rate response when faced with
social stress.
The finding of different response patterns is important for one main reason. When
determining the stress response to a certain stressor, using the mean of all participants might
provide a biased view. The profile to which participants belong needs to be taken into
account: a certain stress response might be unusual for one profile, but not another. Piling
the different profiles together does not validly represent reality. This same point was made by
Johannes and Gaillard (2014). Analysis should focus on deviance from the baseline of the
profile to which a participant belongs.
Recommendations
One possible confounding variable in the present study was the time elapsed
between the stress response and the reporting of the experience of stress. Participants were
asked to rate their subjective stress only after the anticipation of singing and the singing itself
35 Hellhammer and Schubert (2012), memory is of influence on the reporting of subjective
stress. It is possible that results would have been different, and perhaps more valid, had
participants rated their subjective stress at the very moment of experiencing this stress. It is
therefore recommended to incorporate a rating system into the experimental trial, through
which participants can rate their subjective stress while completing the trials.
Another recommendation concerns sample size. When searching for clusters, a
minimum cluster size should be determined beforehand. Each cluster is, in a way, treated as
a sample on its own. In the present study, each cluster contained about 40 participants. To
consistently achieve statistical significance, a larger number of participants is recommended.
Conclusion
This study has provided evidence for two hypotheses. Firstly, results found by Evers
et al. were replicated with a different type of stimulus. Coherence was found within but not
between response systems, which, when taken into account, can make interventions for
coping with stress (or other unpleasant emotions such as anger) more effective. Secondly,
different response patterns were found in self-reported stress and skin conductance
response. Correcting research data for these profiles can make results more nuanced and
36
References
Bali, A. & Jaggi, A. S. (2015). Clinical experimental stress studies: methods and assessment.
Reviews in the Neurosciences 26(5), 555-579.
Brouwer, A.M. & Hogervorst, M.A. (2014). A new paradigm to induce mental stress: The
Sing-a-Song Stress Test (SSST). Frontiers in Neuroscience 8(224).
Evers, C., Hopp, H., Gross, J.J., Fischer, A.H., Manstead, A.S. & Mauss, I.B. (2014).
Emotion response coherence: a dual-process perspective. Biological Psychology 98, 43-49.
Föhr, T., Tolvanen, A., Myllymäki, T., Järvelä-Reijonen, E., Rantala, S., Korpela, R.,
Peuhkuri, K., Kolehmainen, M., Puttonen, S., Lappalainen, R., Rusko, H. & Kujala, U.
M. (2015). Subjective stress, objective heart rate variability-based stress, and
recovery on workdays among overweight and psychologically distressed individuals:
a cross-sectional study. Journal of Occupational Medicine and Toxicology 10(39). Hardy, J. D. & Smith, T. W. (1988). Cynical hostility and vulnerability to disease: Social
support, life stress, and physiological response to conflict. Health Psychology 7(5), 447-459.
Hellhammer, J. & Schubert, M. (2012). The physiological response to Trier Social Stress
Test relates to subjective measures of stress during but not before or after the test.
Psychoneuroendocrinology 37(1), 119-124.
Jacobs, S. C., Friedman, R., Parker, J. D., Tofler, G. H., Jimenez, A. H., Muller, J. E.,
Benson, H. & Stone, P. H. (1994). Use of skin conductance changes during mental
stress testing as an index of autonomic arousal in cardiovascular research. American Heart Journal 128(6), 1170-1177.
Jamieson, J. P., Mendes, W. B. & Nock, M. K. (2013). Improving acute stress responses:
The power of reappraisal. Current Directions in Psychological Science 22(1), 51-56. Kim, D., Yuhnwan, S. & Salahuddin, L. (2008). Decreased long term variations of heart rate
variability in subjects with higher self-reporting stress scores. Second International Conference on Pervasive Computing Technologies in Healthcare, 289-292.
Kirschbaum, C., Pirke, K. M. & Hellhammer, D. H. (1993). The ‘Trier Social Stress Test’- A
tool for investigating psychobiological stress responses in a laboratory setting.
Neuropsychobiology 28(1-2), 76-81.
Robinson, M.D. & Clore, G.L. (2002). Belief and Feeling: Evidence for an Accessibility Model
of Emotional Self-Report. Psychological Bulletin 128(6), 934-90.
Ruiz-Robledillo, N., Bellosta-Batalla, M. & Moya-Albiol, L. (2015). Lower cardiovascular
37 disorder than in non-caregivers: Implications for health outcomes. International
Journal of Psychophysiology 98(1), 143-150.
Van der Vijgh, B., Beun, R. J., Van Rood, M. & Werkhoven, P. (2014). GASICA: generic
automated stress induction and control application design of an application for
38
Appendix A Procedure wegens persoonlijk contact.
Gedurende dit experiment wordt u aangesloten op apparatuur om hartslag en huidgeleiding
te meten. Deze apparatuur bestaat uit twee polsbanden met sensoren en twee sensoren
voor de wijs en ringvinger van uw linkerhand. Daarnaast wordt er een EDA meter
aangesloten. Deze worden door de onderzoeker bij u aangebracht. Hier hoort geen risico of
ongemak uit voort te vloeien. De apparatuur draagt u ongeveer 15 minuten terwijl u
instructies op een scherm opvolgt. Het gehele experiment duurt maximaal 1 uur.
Wegens persoonlijk contact is het gebruikelijk de gegevens van de onderzoekers mee te
geven aan de deelnemers van het experiment. Tevens staan hieronder de gegevens
vermeldt waar eventuele klachten kunnen worden ingediend waarover u van mening bent dat
dit niet bij de onderzoekers achtergelaten dient te worden.
Het experiment wordt uitgevoerd door;
E-mail Telefoonnummer Adres
Lars
Nijboer
[email protected] 06 22321286 Maanstraat 29, 7521 TE
Enschede
Luc Derikx L.W.J.Derikx@student.
utwente.nl
06 22852357 Richtersweg 18, 7521 BW
Enschede
Bij klachten over de onderzoekers of over de procedure kunt u deze indienen bij de secretaris van de ethische commissie te bereiken op het mailadres;