University of Warwick institutional repository: http://go.warwick.ac.uk/wrap
This paper is made available online in accordance with publisher policies. Please scroll down to view the document itself. Please refer to the repository record for this item and our policy information available from the repository home page for further information.
To see the final version of this paper please visit the publisher’s website. Access to the published version may require a subscription.
Author(s): PE Anderson and JQ Smith
Article Title: Bayesian Representations Using Chain Event Graphs Year of publication: 2006
Link to published article:
http://www2.warwick.ac.uk/fac/sci/statistics/crism/research/2006/paper 06-08
Bayesian Representations Using Chain Event
Graphs
Paul E. Anderson and Jim Q. Smith
∗Department of Statistics and
Centre for Systems Biology
University of Warwick
Coventry, UK
CV4 7AL
Abstract
Bayesian networks (BNs) are useful for coding conditional inde-pendence statements between a given set of measurement variables. On the other hand, event trees (ETs) are convenient for represent-ing asymmetric structure and how situations unfold. In this paper we report the development of a new graphical framework for discrete probability models called the Chain Event Graph (CEG). The class of CEG models contains finite BNs as a special case. Unlike the BN, the CEG is equally appropriate for representing conditional independen-cies in asymmetric systems and does not need dependent variables to be specified in advance. As with the BN, it also provides a framework for learning relevant conditional probabilities and propagation. Fur-thermore, being a function of an ET, the CEG is a more flexible way of representing various causal hypotheses than the BN. This new frame-work is illustrated throughout by a biological regulatory netframe-work: the tryptophan metabolic pathway in the bacterium E. coli.
1
Introduction
Chain Event Graphs (CEGs) offer a way of combining the advantages of event trees (ETs) and Bayesian networks (BNs). Like an event tree, the CEG can represent all possible events in asymmetric and symmetric sys-tems and describe how situations unfold. This is particularly pertinent for biological regulatory systems, where sequential processes such as activation and repression need to be handled. However, unlike ETs, CEGs have the additional benefit that conditional independencies can be read off the graph directly from its mixture of directed and undirected edges. The CEG has the same number of directed paths as the equivalent ET, but far fewer vertices. It has long been recognised (see e.g. [6]) that BNs are very expressive of certain types of conditional independence statements where qualitative implications of a model can be interrogated before the elaboration of a full probability model takes place. This is where theorems like d-separation play a role.
However, they are not so good for models with symmetries that are not just sets of conditional independence statements, sparse probability tables or a sample space structure which is not a product space. This has encouraged other researchers to develop more expressive dependencies classes, see for example [1, 10, 13]. Unfortunately these new, richer classes are typically not graphical. Hence, the original appeal of the elicited BN — a graph whose consequences could be read by the client and whose consequences could be examined through d-separation — has largely been lost.
In contrast, the CEG (like the BN) represents models by a single graph from which the qualitative implications of a client’s qualitative assertions can be formally deduced. These can be fed back to the client for verifica-tion before the distribuverifica-tional elaboraverifica-tion of the model takes place. We will demonstrate below that the CEG explicitly represents unusual symmetries and asymmetries in the qualitative model structure and so can allow strong deductions to be made when none would be possible in the BN. Furthermore, it can be shown that if an elicited CEG is formulated that happens to respect a BN, then that BN can be fully retrieved from the topology of the CEG. Thus, the class of finite discrete BNs is a particular subclass of the CEG.
might be expected to exhibit interesting conditional independence structure. The topology of the CEG informs us how to construct such functions and is illustrated in section 3.2. In BNs of course, it is assumed that such random variables are given, so this issue is never addressed.
Because the CEG encodes conditional independence structure, making certain collections of its vertices exchangeable, it is straightforward to es-timate, see section 4. In particular, using an analogue of local and global independence and complete random sampling (so that the likelihoods sepa-rate), conditional probabilities in the graph can be estimated in a conjugate way.
Shafer [17] has argued that causal hypotheses are much better framed in ETs than BNs; contra e.g. [12, 21]. This is especially true when the underlying model structure is intrinsically asymmetric. CEGs can provide a half-way house between the ET and the BN, allowing causal conjectures about equivalence classes of situations to be expressed succinctly. Further-more, as demonstrated below, results such as the backdoor theorem [12], which deduces the identifiability of a cause in a partially observed system through examination of the topology of a BN, also have their analogues in CEGs: see section 5.
In the next section, we shall describe a biological system — the regulation of an important amino acid, tryptophan, in bacteria — and use it to illustrate the definition and construction of an ET and then a CEG. Later, we consider the elicitation of conditional independence statements, estimation from real data and explore manipulation and causation within this model.
2
The ET for Tryptophan Regulation
The CEG is useful for expressing models that are most naturally described in terms of processes rather than cross-sectional interdependencies. Biological regulatory mechanisms are one domain where this feature may be exploited. We shall now detail a running example of such a process.
many biological systems, the underlying mechanisms are complicated, act at different time-scales and depend on several contingencies. However, with some simplifying assumptions, we can describe this system in terms of the probabilities of certain events occurring. (See [7] for one of the original de-scriptions of tryptophan regulation in the biological literature and [19] for a recent review.) For simplicity, we have focused on two regulatory mecha-nisms: feedback enzyme inhibition and gene repression.
When a bacterium receives an increased level of tryptophan, the first pro-cess that acts is chemical: feedback enzyme inhibition, FEI. Essentially, there are a series of enzymes that catalyse successive steps in a metabolic path-way culminating in the production of tryptophan. However tryptophan, the end-product of this pathway, inhibits the first enzyme. Thus if tryptophan is plentiful, there is a greater chance that the first enzyme is inhibited, cutting the chain of enzyme catalysis and resulting in a decrease in the production of tryptophan. Similarly, if the level of tryptophan is reduced, then there is a smaller chance that the first enzyme is inhibited, so tryptophan produc-tion can increase. FEI takes place immediately in response to a change in exogenous tryptophan levels.
The second control process, gene repression, GR, works over longer time-scales. In the presence of tryptophan, expression of the genes encoding tryp-tophan synthetic enzymes — trp genes — is unnecessary and wasteful. To counteract this, the trp genes are repressed by the tryptophan dependent repressor protein, TrpR, which is produced by the bacterium at a constant rate. These proteins then bind to the DNA and stop transcription of the
trp genes. When the bacterium is starved of tryptophan, less tryptophan is available to bind to and activate TrpR, relieving repression and allowing expression of the trp genes, and hence increasing tryptophan production.
The ET of this simplified version of the tryptophan regulation model is shown in figure 1 and constructed below. Recall that an event tree, T, consists of a set of vertices V(T) and a set of edges E(T) with one root vertex, w0. The members of the set of non-leaf vertices (i.e. those vertices that do not terminate a branch), S(T)⊂V(T), are called situations. Every situation is a precursor of future developments, so each situation v ∈ S(T) has an associated random variable X(v) whose event space labels the edges (v, v0) emanating from v.
High temp Tenv↑ FEI√ GR√ SG EG BG GR× SG EG BG FEI× GR√ SG EG BG GR× SG EG BG Tenv↓ FEI√ SG G FEI× GR√ SG G GR× SG G
Low temp Tenv↑
[image:6.595.116.482.132.605.2]FEI√ GR√ SG EG BG GR× SG EG BG FEI× GR√ SG EG BG GR× SG EG BG Tenv↓ FEI√ SG G FEI× GR√ SG G GR× SG G
is, they are supplied with the bare essentials needed to survive. Our model describes the events that affect a bacterium. Different bacteria may follow different root-to-leaf paths. The chemostat can be kept at two temperatures: high and low. The potential subsequent events will not be affected by this condition, but the probabilities that certain molecules bind and stay bound will differ, as will the growth rate and tryptophan requirements of the bac-terium. Therefore the branches from these two situations will look the same, although the probabilities on the edges will vary.
An experimenter can use the chemostat to manipulate the level of envi-ronmental tryptophan up, represented by the event Tenv ↑, or down, Tenv ↓.
After this change, we want to see how the bacterium responds. Under the first response, FEI either takes place, FEI√, resulting in a drop in the amount of tryptophan produced, or not, FEI×, leading to a rise. Over a longer period, GR will either occur, GR√, meaning less tryptophan is manufactured, or not, GR×, so that more is made. Depending on the events that have already taken place, the growth state will be different. We permit four possibilities:
• SG: synthesised tryptophan is the main contributor to growth.
• EG: environmental tryptophan is the main contributor to growth.
• BG: synthesised and environmental tryptophan contribute equally to
growth.
• G: the bacterium does not grow.
Contingent on previous events, these states can be seen as efficient (for ex-ample, SG if there is little tryptophan in the environment) or inefficient (SG
if tryptophan is abundant). Of course, in reality there would be a spectrum of intermediate events at all levels of the ET. These could be included by adding more edges. As our example is intended to be illustrative rather than comprehensive, for visual clarity we have limited the number of possibilities. The unfolding of these processes can be read from the tree. For example, when starving theE. coli of tryptophan, no external supply is available, so we can simply exclude the edges for EG and BG in this case. When tryptophan
The point to notice here is that a BN could never fully express the qual-itative structure of the events graphically, and the more complicated the regulatory model, the more that is lost. On the other hand, we demonstrate below that the CEG — a function of the ET along with collections of ex-changeability statements — can often represent all the elicited qualitative structure; sometimes fully. Therefore, within these contexts, the CEG pro-vides a much more expressive framework than the BN for interrogating the model’s implicit conditional independencies, and embellishing an unmanip-ulated model with causal structure. It captures conditional independence statements through making the assertion that certain random variables at particular collections of situations X(v) are identically distributed.
Note that since its edges represent dependency, events with zero probabil-ity cannot be represented in a BN. However, being derived from an ET, these can be incorporated in the CEG by simply not including the relevant edge. As illustrated by our example, in many problem descriptions elicited using a tree, the length of root-to-leaf paths associated with various sequences of situations are often different. Whilst this is handled naturally in the CEG, this type of structure can only be represented in a BN by artificially adding more deterministic relationships to the system.
3
The Chain Event Graph
3.1
Definitions
Once drawn, an ET like the one illustrated above can be used as a framework for further elicited qualitative information associated with the exchangeabil-ity of some of its situations. Let Ev denote the set of edges emanating from
the situation v ∈ S(T). Then for each pair of situations v, v0 ∈ S(T) we can ask whether, having reached situation v, the distribution of the random variable X(v) whose probabilities lie on the edges Ev is identical (under an
appropriate mapping of edges ϕ : Ev → Ev0) to X(v0). If this is so we say
that v and v0 are in the samestage,u.
The set of stagesL(T) clearly forms a partition of S(T). When v, v0 ∈u,
we allocate a particular colour to the edges e ∈ Ev and e0 = ϕ(e) ∈ Ev0
statements. Thus it is easy to check that situations are in the same stage if and only if they arise from the same sub-sequence of random variables
{X1, X2, . . . , Xr} and their parent configurations agree. Note that, for each u ∈ L(T), we can let X(u) denote a random variable whose distribution is shared by {X(v) : v ∈ u}. We use this observation in the discussion of learning algorithms given in section 4.
In figure 1, each situation is in a different stage except for the vertices shaded in the same direction and the two solid vertices. In these cases we expect biologically that the probability of the next event is represented by the same random variable, hence they are in the same stage.
Another partition {w : w ∈ K(T)} of S(T) — a refinement of {u : u ∈ L(T)}— is useful. The elements w of this partition are called positions and can be read directly from the staged tree. Two situations v and v0
are in the same position w if the subtrees T(v) and T(v0) of the staged treeT are colour isomorphic. This will mean that, with the appropriate labelling of the edges, the distribution of the future unfolding starting from situation v
is believed to be identical to the one starting at v0. Therefore two units at
v and v0
that lie in the same position w will have exchangeable futures. We note that, unlike our simple running example, typically the partitions are quite coarse (see the examples in [18]).
In our example, the shaded vertices are in the same position since the leaves v, v0
are terminal situations: T(v) and T(v0
) contain no other situa-tions other than v and v0. The solid situations are not in the same position however, since whilst the topology of their associated subtrees is the same, their corresponding situations are not in the same stage.
We can now define the chain event graph (CEG),C(T), of a staged treeT. This is a mixed coloured graph, whose set of vertices V(C) =K(T)∪ {w∞}
has a single root vertex w0 = {v0} — the root vertex of T — and a sink vertex w∞ corresponding to the set of terminal vertices of the tree. Two
vertices in V(C) are connected by an undirected edge if and only if they are distinct and in the same stage. Directed edges of C(T) are constructed as follows. For each positionw∈K(T) identify a single representative situation
v(w) ∈ w. Then, for each edge e = (v(w), v0) in Ev(w) draw a directed edge
from w to w0
where w0
= w∞ if v is a terminal vertex in T and a directed
w0
1
2
4
16
99
17
5
10
18
19 High temp
Tenv↑
Tenv↓
w∞
BG EG SG
BG EG SG
3
6
20
99
21
7
14
22
23 Low temp
Tenv↑
Tenv↓
SG
G SG
[image:10.595.117.481.129.563.2]G
Figure 2: Chain event graph skeleton for tryptophan regulation in E. coli. Edge labels are explained in the text and the nodes are numbered consistently with figure 3. w0 is the root node, w∞ the leaf vertex. Only some terminal
2
4
8 16
9
17
Tenv↑
FEI√
FEI×
GR√
GR× GR√ GR×
w∞
BG EG SG
BG EG SG
5
10
11
18
19 Tenv↓
FEI√
FEI×
GR√
GR×
SG
G
SG
G
SG
[image:11.595.113.477.149.589.2]G
The CEG so defined contains all the information expressed in the ET since its to-sink paths are in a one-to-one correspondence with the root-to-sink paths of its ET. On the other hand, all the stages and positions can be read from its topology. This gives a graphical depiction of conditional independence implicit from the model description akin to the BN. In [18] it is proved that, unlike probability graphs [2, 3, 11] and probability decision graphs [8], in the special case when a qualitative model can be fully described by a finite discrete BN, it can also be fully described by a CEG. Thus for discrete problems, the CEG is a genuine generalisation of the BN. It also generalises the discrete MDAG [22].
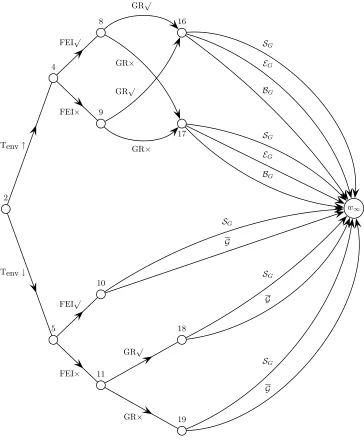
With the CEG defined, we can now draw the CEG for our example. So that all the features can be seen, figure 2 gives a skeleton outlining the start and end of the CEG, whilst figure 3 shows a part of the CEG in close-up. Firstly, we join all the leaves of the tree to one sink vertex, w∞. Having
elicited the stages from the expert, we next identify the positions: in our example, the penultimate situations that are in the same stage. Finally, we connect all the positions in the same stage by an undirected edge. Here these are the situations associated with high and low temperatures.
3.2
Conditional Independence in a CEG
As for the BN, various conditional independence statements implied from an elicited CEG can be read directly from the topology of its graph. In this paper we restrict ourselves to the discussion of one result linking the topology of the graph to conditional independence statements: many others are given in [18]. First, we need two concepts. We call a collection of positions, Ω, a fine cut if all paths from w0 to w∞ have to pass through exactly one
member of Ω. For the tryptophan regulation example, the set of vertices Ωeg ={3,10,11,16,17}shown in figures 2 and 3 constitute a particular fine
cut. Aseparator Q(Ω) is a random variable taking different valuesqi for each
of the paths in the path event space that pass through a different element ωi
of the cut Ω.
to prove [18] that
X(Ω)aZ(Ω)|Q(Ω) (1)
The meanings of all the variables can be deduced from the topology ofC and, unlike for the BN, do not necessarily just concern disjoint subsets of a given set of random variables, but can be functions of these.
To illustrate equation (1), consider again the cut Ωeg defined above.
As-sume you learn the values of a function Q(Ωeg). The value of the
vari-able Z(Ωeg) gives additional information about whether a sequence passed
through situation 8 or 9. Note that this is not learned from Q(Ωeg). The
random variable X(Ωeg) reveals the unfolding of events after observing a low
temperature, and also whether or not GR occurred after observing a high temperature, Tenv↓ and FEI×. Equation (1) tells us that whether an
obser-vation passes through 8 or 9 is irrelevant to predictions about X(Ωeg) once
we learn the value of Q(Ωeg).
Note that this conditional independence statement does not simply con-cern the original variables Tenv, etc, but functions of them. It is not always
possible to read this type of implication from a BN on the original vari-ables. As with the BN, suitably interpreted subsets of these implications, read directly from the graph, can be fed back to the expert for validation.
4
Estimation of CEGs From Data
We now move to the problem of estimating probabilities on a CEG, C, from data. Note that the probabilities needed to fully specify C are the densities
p(πu) of the primitive probabilities {πu ∈ Πu :u ∈L(C)}. These correspond
to the random variables {X(v) : v ∈ K(C)} at the different positions of C. For BNs, under ancestral sampling, it is well known that if all the condi-tional probability simplices specifying the process are a priori independent of one another — that is, there is local and global independence — then this property is also true posterior to sampling. Furthermore, if each of the sim-plices of probabilities has a Dirichlet distribution a priori then the posterior distribution of each of the independent simplices will be Dirichlet (see, for example, [20]) after complete sampling. Consequently, it is straightforward to build fast algorithms to learn which of a class of BNs best explains a given data set.
an event tree which represent the data generating process: one for each posi-tion. Imagine a computer experiment in which random, independent draws are made from simulators lying along a path in C starting at the root vertex,
w0. As with BNs, nothing is lost if we assume that the CEG is generated in this way [14].
Now assume that the vectors of primitive probabilities{p(πu) :πu ∈Πu}
are all independent of each other. When we have a complete sample of n
observations, we sample n root to sink paths{λi : 1≤i≤n}: each λi being
an instantiation of the underlying event spaceXofC. In the simulator world, observing a root-to-sink pathλof lengthN(λ) just corresponds to a sequence of independent realisations of the N(λ) random variables X(v) lying along that path. So, given {πu ∈ Πu : u ∈ L(C)}, the probability of λ occurring
is simply the product of the probabilities πu on this path: a monomial in {πu ∈ Πu : u ∈ L(C)}. Since we observe n such paths independently, it is
therefore easy to check that the likelihood of this sample can be written
L(π|λ1, . . . , λn) = Y u∈L(T)
nY(u)
i=1
πi(u)ri(u)
where ri(u) is the number of times theith edge from a position v ∈u is
tra-versed in the observed paths {λ1, . . . , λn}. The vectorπ has as components
all the primitive probabilities and n(u) is the size of the state space ofX(u). The product form of this likelihood means that if{p(πu) :πu ∈Πu}are all
a priori independent — so that their densities also respect the same product form — then Bayes’ theorem ensures that the product form is respected a posteriori. That is, the vectors of primitives are a posteriori independent. Further, suppose that for each u ∈ L(C), p(πu) is a priori independently
Dirichlet distributed α = (α1, α2, .., αn(u)), D(α(u)), so that its density is
given by
p(πu) =
Γ(Pni=1(u)αi(u)) nQ(u)
i=1
Γ(αi(u)) nY(u)
i=1
πi(u)αi(u) −1
Then Bayes’ theorem also allows us to show that each of these densities is Dirichlet a posteriori.
To illustrate this, suppose we observe two paths (λ1, λ2) associated with
GR√, EG} and λ2 = {High temp, Tenv ↑, FEI×, GR√, EG}. It follows
that the likelihood is given byπ1:22 π2:42 π4:8π4:9π8:16π9:16π16:2 EG, whereπa:b is the
probability that the next situation is vertexbgiven that the current situation isa. So, for example, the posterior distribution of the situation 2 is given by
D(α∗(2)) where α∗
1(2) = α1(2) + 2 and α2∗(2) = α2(2), whilst for situation
16 we have α∗1(16) = α1(16), α2∗(16) = α2(16) + 2 and α3∗(16) = α3(16).
Thus, prior to posterior conjugacy is not unique to discrete BNs. It is also a property under ancestral sampling of the more general class of CEGs, see [14] for more details.
In applications like the tryptophan pathway, we have two complications. First, the sample counts ri(u) may not be available without measurement
error and may be dependent. Second, observations of many of the situations may be hidden. For example, microarray analysis and polymerase chain reac-tion (PCR) experiments may be able to tell us the rate of gene transcripreac-tion (and thus we may be able to infer whether gene repression has occurred), and other techniques can measure enzyme activity. However, this data may not always be available or accurate. Such problems mean that conjugacy (and sometimes identifiability) is lost. We then need to resort to approxi-mate methods (e.g. [5]) that retain the algebraic product form or use more time consuming numerical algorithms. But exactly the same issues are faced when modelling with BNs. Hence, these issues are intrinsic to missing data problems in general: they are not an artifact of the CEG.
5
Causal Structures and CEGs
5.1
The Causal CEG
Shafer argue cogently in [17] that definitions associated with causality are much more generally expressed in terms of an ET than a BN. Lying between the ET and the BN, the CEG retains many of the expressive advantages of the ET. However, the richness of its topology permits the development of strictly graphical criteria to resolve issues such as whether or not an effect of a manipulation is identifiable in the light of a partially observed system — assuming the CEG is causal. Here we outline how to construct causal CEGs and state an analogue of Pearl’s backdoor criterion applicable to such causal CEGs.
a causal BN, [12] implicitly assumes that a model is fully described by a network of simulators. A simulator takes the value of its parents as input. Thus its output is conditional on the particular configuration of its parents. The effect of a manipulation X →xb of a variable X is then to simply turn off the simulator associated with X and set it to bxwith probability one, and to rewire all simulators in the system that take x as an input and set this input to the value bx, before running the network. This appears the obvious definition for the causal effect of manipulating the value of X toxb.
This analogy extends to the CEG in a very natural way. Recall that each position w has a simulator, or random variable, X(w) associated with it. A
positioned manipulation of the position w simply replaces any random vari-able X(w), labelled by its position w, by its manipulated value bx(w) with probability one. bx(w) is then used as an input for a subsequent simulator.
Non-atomic positioned manipulation {X(w) =bx(w) :w∈W} of a set of po-sitions simply performs this substitution for allw∈W.For example, we may decide to concentrate on how the bacterium responds at high temperatures only. In this case, we set X(w0) = High temp. The result of this (causal)
manipulation on the distribution of a second random variable Y can now be calculated by making the appropriate substitution into the factorisation of the elementary path events.
Shafer rightly points out in [17] that not all causal hypotheses need to be thought of in terms of manipulations and not all causal manipulations are necessarily positioned. However, in many situations we meet in practice, we want to consider positioned manipulations and certainly many authors [12, 21] restrict their attention to subsets of these types of manipulations. For example, in the study of treatment response, positioned manipulations are those where patients with identical prognoses will be treated exchangeably. Note that manipulations of this type (gene, cell, environmental) are common in experiments on regulatory networks [16]. A full discussion of such issues is given in [14].
5.2
The Backdoor Theorem
We end the paper by illustrating how the topology of a CEG can be used to answer questions about the identifiability of a cause. The topology of the BN has of course been used for such purposes, see [12], albeit for a much more restricted class of possible manipulations.
If M is a random vector, whose sample space is a subspace of X, then
for each value mofM, let Λ(m) denote the set of pathsλ(m)∈Xthat are
consistent with the event {M =m}.
Our result concerns three fine cuts in a CEGC
Ωa = {w:w=wj(a,λ)for some λ∈X}
Ωb = {w:w=wj(b,λ)for some λ∈X}
Ωc = {w:w=wj(c,λ)for some λ∈X}
where j(a, λ) denotes the (integer) distance from w0 to a position in Ωa on a
root-to-sink path λ. For each λ of X, we now specify that
j(a, λ)< j(b, λ)≤j(c, λ)
In this sense it can be asserted that the fine cut Ωa lies before Ωb which in
turn lies before Ωc. Let the fine cut
Ωb(−) ={w:w=wj(b(−),λ)for some λ∈X}
be the set of all positions that are a parent of a position Ωb in C. Clearly,
j(a, λ)≤j(b(−), λ)< j(b, λ)≤j(c, λ)
To find a CEG analogue of Pearl’s backdoor theorem (BDT) we need to find a graphical property of a CEG that ensures that a random variable
M = (Z, X, Y) identifies the total cause (redefined for the extended
envi-ronments defined by the CEG). The random variables X and Y are given and an appropriate random variableZ can be constructed from the topology of C using the BDT. Suppose Z is measurable with respect to Ωa and X is
measurable with respect to Ωb. For the BDT, attention is restricted to the
case where Z happens before X and Y.
For a CEG, this means thatZ can be expressed as a coarsening Ωz(whose
intersecting paths are {Λ(z) : z ∈ Ωz}) of a fine cut Ωa “before” the fine
separates the events{Y =y}from{Z =z, X =x}in the sense that all paths consistent with {Z =z, X =x, Y =y}pass through a position c(z, x)∈Ωc.
That is, cdepends on z and xbut not y. Finally, letB(−, z, x) be the set of all positions b∈Ωb(−) consistent with the event {Z =x, X =x}.
It is now possible to search for appropriate fine cuts Ωa and Ωc with
reference to a given fine cut Ωb, with a topological property given in the
theorem below. In this way, we can find an appropriate random variable Z
such that (Z, X, Y) identifies a given total cause.
TheoremIf for any given value z ∈Ωz of Z either:
1. all root-to-sink paths in C in Λ(z, x) pass through a single position
c(z, x), or
2. all root-to-sink paths inCin Λ(z, x) are such that all positionsb(−, z, x)∈
B(−, z, x) lie in the same stage
then the total cause, p(y||x), on y∈Ωy for a given x∈Ωx is identified from
(x, Y, Z) and is given by the equation
p(y||x) = X
z∈Ωz
p(z)p(y|z, x)
where
p(z) = X
λ∈Λ(z) π(λ)
p(y|z, x) = X
λb∈Λ(z,x,y)
π(λb)
and p(y||x) denotes the probability that y occurs given that X has been manipulated to x, [9].
6
Discussion
The Chain Event Graph (CEG) is a powerful graphical construction for asym-metric and symasym-metric models that can be used to answer inferential questions in analogous ways to the Bayesian network. In this paper, we have not dis-cussed propagation algorithms based on CEGs. Initial results on this are encouraging: for a recent report see [23].
The CEG appears especially promising as a framework for propagation in dynamic structures that are not Markov. Unlike dynamic forms of BNs, as well as elaborating over time, the CEG sequentially simplifies as observations are collected. Thus any paths in the CEG that are inconsistent with the current set of observations can be sequentially pruned away, offsetting the necessary elaboration of the model into future time steps. We have also proved various Markov equivalences of subclasses of CEGs (although this classification is currently incomplete) and have recently found a d-separation property that allows us to answer any conditional independence query from the graph. These results will be reported in future papers. So whilst the elicitation and subsequent elaboration of Bayesian probabilistic models using the framework of the CEG is in its infancy, we are confident that the structure will form a useful addition to the toolbox of Bayesian model representations.
Acknowledgements
We are very grateful to Dave Whitworth for providing expert knowledge and helping us to clarify and improve the event tree and CEG for the tryptophan pathway. Paul E. Anderson is funded by EPSRC and BBSRC as part of the Interdisciplinary Program for Cellular Regulation (IPCR) and BioSim.
References
[1] C. Boutilier, N. Friedman, M. Goldszmidt, and D. Koller. Context-Specific Independence in Bayesian Networks. In Proceedings of the 12th Annual Conference on Uncertainty in Artificial Intelligence (UAI-96), pages 115–123, San Francisco, CA, 1996. Morgan Kaufmann Publishers.
[3] H. J. Call and W. A. Miller. A Comparison of Approaches and Imple-mentations for Automating Decision Analysis. Reliability Engineering and System Safety, 30:115–162, 1990.
[4] N. A. Campbell and J. B. Reece. Biology. Addison Wesley Student Series. Benjamin Cummings, 6th edition, 2002.
[5] R. G. Cowell, A. P. Dawid, S. L. Laurtizen, and D. J. Spiegelhalter.
Probabilistic Networks and Expert Systems. Springer-Verlag, 1999.
[6] D. Geiger, D. Heckerman, and C. Meek. Asymptotic model selection for directed networks with hidden variables. In Proceedings of the 12th Annual Conference on Uncertainty in Artificial Intelligence (UAI-96), pages 283–290, Portland, OR, 1996. Morgan Kaufmann Publishers.
[7] J. Ito and I. P. Crawford. Regulation of the Enzymes of the Tryptophan Pathway in Escherichia Coli. Genetics, 52:1303–1316, 1965.
[8] M. Jaeger. Probabilistic decision graphs — combining verification and AI techniques for probabilistic inference. Int. J. of Uncertainty, Fuzzi-ness and Knowledge-based Systems, 12:19–42, 2004.
[9] S. L. Lauritzen. Causal inference from graphical models. In O. E. Barndorff-Nielsen, D. R. Cox, and C. Kluppelberg, editors, Complex Stochastic Systems, pages 63–108. London: Chapman and Hall, 2001.
[10] David McAllester, Michael Collins, and Fernando Pereira. Case-Factor Diagrams for Structured Probability Modelling. In Proceedings of the 20th Annual Conference on Uncertainty in Artificial Intelligence (UAI-04), pages 382–391, 2004.
[11] S. M. Olmsted. On representing and solving decision problems. PhD thesis, Engineering-Economic Systems, Stanford University, 1983.
[12] J. Pearl. Causality, models, reasoning and inference. Cambridge Uni-versity Press, 2000.
[14] E. Riccomagno and J. Q. Smith. Chain Event Graphs to Represent Bayesian Causal Hypotheses. CRiSM paper, Department of Statistics, University of Warwick, 2006.
[15] M. Santill´an and M. C. Mackey. Dynamic regulation of the trypto-phan operon: A modeling study and comparison with experimental data.
PNAS, 98(4):1364–1369, 2001.
[16] J. W. Schimd, K. Mauch, M. Reuss, E. D. Gilles, and A. Kremling. Metabolic design based on a coupled gene expression — metabolic net-work model of tryptophan production in Escherichia coli. Metabolic Engineering, 6:364–377, 2004.
[17] G. Shafer. The Art of Causal Conjecture. Cambridge, MA, MIT Press, 1996.
[18] Jim Q. Smith and Paul E. Anderson. Conditional independence and chain event graphs. Artificial Intelligence, 2006. Accepted, subject to revision.
[19] R. Somerville. The trp repressor, a ligand-activated regulatory protein.
Prog. Nucleic Acids Res. Mol. Biol., 42:1–38, 1992.
[20] D. J. Spiegelhalter, A. P. Dawid, S. L. Lauritzen, and R. G. Cowell. Bayesian analysis in expert systems (with discussion). Statistical Sci-ence, 8:219–83, 1993.
[21] P. Spirtes, C. Glymour, and R. Scheines. Causation, Prediction, and Search. Springer-Verlag, New York, 1993.
[22] B. Thiesson, C. Meek, D. M. Chickering, and D. Heckerman. Compu-tationally Efficient Methods for Selecting Among Mixtures of Graphical Models. In Bayesian Statistics, volume 6, pages 631–656. Oxford Uni-versity Press, 1999.