University of Warwick institutional repository: http://go.warwick.ac.uk/wrap
A Thesis Submitted for the Degree of PhD at the University of Warwick
http://go.warwick.ac.uk/wrap/36289
This thesis is made available online and is protected by original copyright. Please scroll down to view the document itself.
A STUDY OF TIN OXIDES IN
SILICATE BASED GLASSES
by
MOHD MUSTAMAM ABD KARIM
A thesis submitted to the University of Warwick, England for admission to the degree of
DOCTOR OF PHILOSOPHY
CONTENTS
List of Figures List of Tables
List of Abbreviations Acknowledgement Declaration
Abstract
Chapter 1: General
1.1 Introduction 1
1.2 Aims of the Research 4
1.3 Choice of Systems 5
1.4 Thesis Plan 6
References
Chapter 2 - Glass Structure and The Role of Tin
2.1 Definition of Glass 9
2.2 Models of Glass Structure 10
2.2.1 Random Network Model 10
2.2.2 The Modified Random Network Model 18
2.2.3 Crystallite Model 19
2.2.4 Strained Mixed Cluster Random Network Model 20
2.2.5 Conclusion 23
2.3 Review of Tin in Various Glass Systems 24
2.3.1 Borate Glass 24
2.3.1.1 Binary SnO-B203 Glass 24
2.3.1.2 Alkali Tin Borate Glass 25
2.3.2 Germanate Glass 26
2.3.3 Phosphate Glass 27
2.3.3.1 Binary SnF2-P205 Glass 27
2.3.3.2 Ternary SnO-SnF2-P205 Glass 28
2.3.4 Silicate Glass 29
2.3.4.1 Binary SnO-Si02 Glass 29
2.3.4.2 Sodium Tin Silicate Glass 31
2.3.4.3 Tin in Soda-Lime-Silica (Float) Glass 32
2.3.5 Conclusion 36
2.4 The Structure of The Oxides of Tin 37
2.4.1 The Structure of Sn02 39
2.4.2 The Structure of SnO 39
References
Chapter 3 - Theoretical Background
3.1 Nuclear Magnetic Resonance 45
3.1.1 Basic Principles of NMR 47
3.1.2 Chemical Shift Interaction 51
3.1.3 Magnetic Dipolar Interaction 56
3.1.4 Quadrupole Interaction 57
3.1.5 Magic Angle Spinning ( MAS ) NMR in Solids 60
3.2 MOssbauer Spectroscopy 61
3.2.1 The MOssbauer Effect 62
3.2.1.1 Resonance Absorption of Radiation by Free Atoms 64 3.2.1.2 Resonance Absorption of Radiation by Atoms Bound
in a Solid 66
3.2.2 The MOssbauer Spectrum 68
3.2.2.1 The Chemical Isomer shift 71
3.3 Viscosity 76
3.3.1 Definition of Viscosity 76
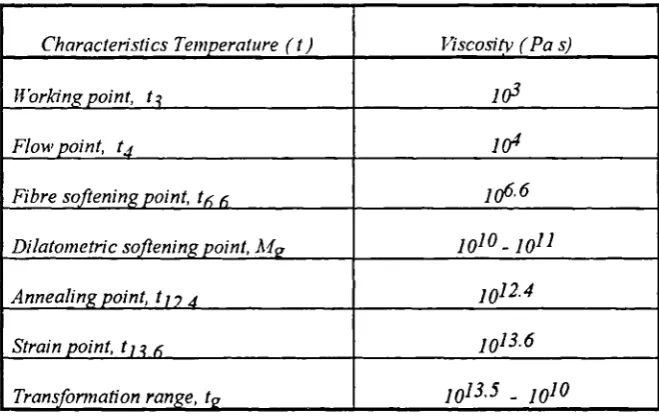
3.3.2 Reference Points Viscosity for Glass 78
3.3.3 Viscosity Equations 79
3.3.4 Methods of Viscosity Measurement 80
3.3.4.1 Rotating Cylinder Viscometer 80
3.3.4.2 Parallel Plate Viscometer 81
3.3.4.3 Penetration Viscometer 81
References
Chapter 4 - Experimental Materials and Techniques
4.1 Glass Preparation 86
4.1.1 Binary SnO-Si02 Glass 86
4.1.2 Tin-doped Float Glass 90
4.2 Compositional Analysis of Glass 93
4.2.1 Binary SnO-Si02 Glass 93
4.2.2 Tin-doped Float Glass 93
4.3 Structural Techniques 94
4.3.1 Nuclear Magnetic Resonance 94
4.3.2 Môssbauer Spectroscopy 98
4.4 Viscosity Measurements 101
4.4.1 Sample Preparation 101
4.4.2 Penetration Viscometer 101
4.5 Thermal Techniques 103
4.5.1 Differential Thermal Analysis 103
4.5.2 Dilatometry 105
4.6 Crystallization Studies 106
4.6.1 X-Ray Diffraction ()MD) 106
4.7 Density and Molar Volume 107
4.8 Refractive Index and Molar Refractivity 108
4.9 Microhardness Test 109
References
Chapter 5 - The Binary SnO-Si02 Glass System
5.1 Introduction 112
5.2 Glass Preparation and Problems 112
5.3 Composition and Glass Stability 115
5.4 119 5n Nuclear Magnetic Resonance Spectra 118
5.5 Static 29 Si Nuclear Magnetic Resonance Spectra 121
5.6 29 Si Magic Angle Spinning Nuclear Magnetic Resonance Spectra 124
5.6.1 Chemical Shift 126
5.6.2 Full Width At Half Maximum (FWHM) And Peak Shape 129
5.6.3 Distribution of Q n Species 131
5.6.3.1 Computer Fitting of 29 Si MAS MAR Spectra 134 5.6.3.2 Summary of The Results of Computer Fitting of
29 5i MAS NMR Spectra 141
5.7 1 19 Sn MOssbauer Spectra 143
5.7.1 The Isomer Shift of Sn24. 145
5.7.2 The Quadrupole Splitting of Sn 2+ 148 5.7.3 Relation Between The Isomer Shift and
Quadrupole Splitting of 5n2+ 150
5.7.4 The Linewidth 152
5.8 Dependence of Mässbauer Spectra on Temperature 152
5.8.1 The Debye Temperature and The f Factor 154
5.8.2 The Temperature Dependence of The Isomer Shift 156
5.9 Physical Properties of SnO-Si02 Glasses 160
5.9.2 Density and Molar Volume 165
5.9.3 Thermal Expansion 167
5.9.4 Refractive Index and Molar Refractivity 171
5.10 Conclusions 173
References
Chapter 6 - Differential Thermal Analysis and Devitrification of SnO-Si02 Glasses
6.1 Differential Thermal Analysis 178
6.2 Heat Treated SnO-Si02 Glasses 182
6.2.1 Heat Treatment in Air 182
6.2.2 Heat Treatment in Argon 184
6.2.3 Summary of the Results of Both Heat Treatments 186
6.3 119 Sn MOssbauer Spectra of Heat Treated Glasses 188
6.4 29 Si MAS NMR of Heat Treated Glasses 194
6.5 Conclusions 195
References
Chapter 7 - Tin-Doped Float Glass
7.1 Introduction 198
7.2 Glass Composition 202
7.3 119 Sn MOssbauer Spectra 205
7.3.1 Isomer Shift, Quadrupole Splitting and Linewidth 207 7.3.1.1 The Isomer Shift and Quadrupole Splitting of Sn2+ 208 7.3.1.2 The Isomer Shift and Quadrupole Splitting of SO+ 208
7.3.1.3 Linewidth 211
7.4 Variable Temperature MOssbauer Spectra 212
7.4.1 Measurement of the f Factor 212
7.4.1.2 Recoil Free Fraction of Sn2+ and SO+ 217
7.5 Viscosity Measurement 220
7.6 Some Other Physical Properties of Tin-Doped Float Glasses 226
7.6.1 Thermal Expansion 227
7.6.2 Density 227
7.6.3 Refractive Index 227
7.6.4 Knoop Hardness 228
7.7 Conclusions 228
References
Chapter 8 - Conclusions and Future Work
8.1 SnO-Si02 Glass System 236
8.2 Devitrification of SnO-Si02 Glasses 238
8.3 Tin-Doped Float Glass 239
LIST OF FIGURES Page
Chapter 2 - Glass Structure and The Role of Tin
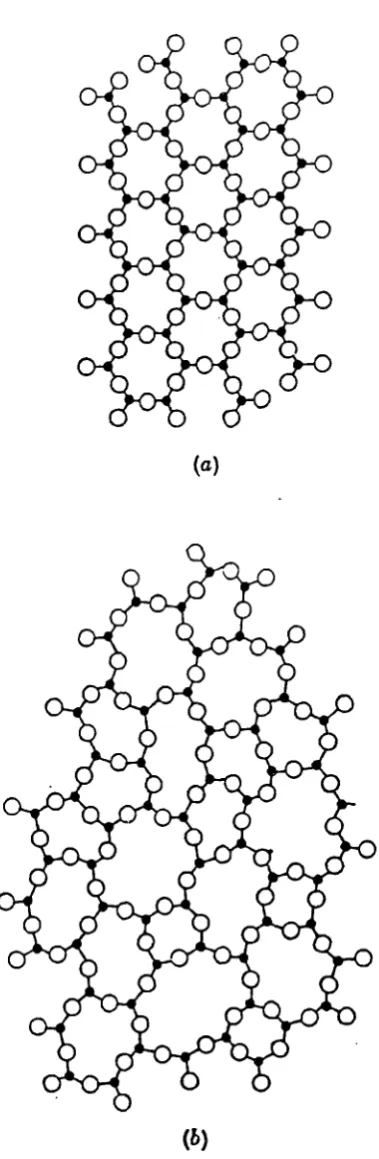
Figure 2.1 : Schematic two-dimensional representation of the structure of 12 (a) a hypothetical crystalline compound M203 (b) the glassy
form of the same compound. Illustration taken from reference [5].
Figure 2.2 : Two-dimensional illustration of: (a) Reaction between sodium 14 oxide and silica tetrahedra. The addition of one molecule of sodium oxide
produces two non-bridging oxygens. (b) The structure of soda-silica glass. The sodium ions are accommodated in the holes or interstices in the network structure. Illustrations taken from [2].
Figure 2.3 : A schematic representation of the different Cr SiO4 species 16 as defined by Lippmaa et al [13].
Figure 2.4 : Al203 in silicate network. For charge neutrality purposes one 16 one alkali metal ion or half an alkaline earth ion per A104 tetrahedron is located close to the A104 tetrahedron, which has a delocalised single negative charge.
Figure 2.5 : A modified random network for a two dimensional oxide glass; 22 M203 (G203), where M are modifier cations and G network forming cations.
Covalent bonds are represented by solid lines, ionic bonds by dotted lines. Illustration taken from reference [32].
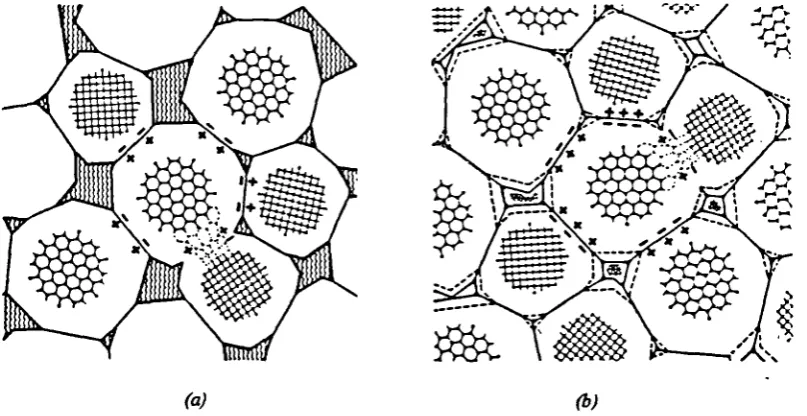
Figure 2.6: Goodman's illustration of a two-polymorph strained mixed cluster 22 model. Interfacial strain is indicated by + and - symbols [42]. (a) Fully formed
space-filling strained mixed cluster random network, at T g . (b) Strained mixed random network glass at temperature below Tg when residual liquid has frozen out.
Figure 2.8: Structural model of the ternary SnO-SnF2-P205 glass 29
Figure 2.9 : Typical tin diffusion profiles in the underside of float glass 33 specimens taken from reference [77]. The in-depth and near-surface tin profiles
for three different 6 mm clear float glasses; by EPMA (upper) and by SIMS (below). For simplicity the tin oxide concentration is expressed in wt.% Sn02 even though it has been shown that tin in both valence states of +2 and +4 coexist in the glass. All the three specimens exhibit what Sieger [72] described as an anomalous 'hump' or satellite peak at about half the effective depth of penetration.
Figure 2.10 : Rutile crystal structure of Sn0 2, showing the unit cell [84]. 41
Figure 2.11 : The crystal structure of SnO [83-84]: (a) The arrangement 41 of bonds from a tin atom to oxygen atoms, where the two dots represent the
'inert pair' of electrons. (b) The tetragonal layered structure. (c) Unit cell of SnO.
Chapter 3 - Theoretical Background
Figure 3.1 : Zeeman splitting of nuclear energy levels (a) I = 1/2 48 (b) I = 1, the quadrupole splitting is not shown
Figure 3.2: (a) The spinning positively charged nucleus produces spin 50 angular momentum p and an associated magnetic moment p. (b) The Lannor
precession of the nuclear spin axis about the direction of the static field Bo. (c) If a magnetic field ( B1 ) of frequency equal to the Larmor frequency ( coo ) is placed at right angle to Bo ; resonance is triggered by the absorption of energy into the nuclear spin system.
Figure 3.4: The reported shift for 29 Si in minerals and glasses. 55 White ranges are for glasses [12] and dark ranges are for 'solid' silicates [24-25].
Figure 3.5 : Two neighbouring nuclei i and j separated by internuclear 59 vector rii.
Figure 3.6: I = 3/2 energy splitting due to quadrupole interactions. 59
Figure 3.7 : Macroscopic rotation of a powder sample about an axis 60 at angle (3 r-zi 54.7° to the applied field B 0 , showing the geometric
relationships involved.
Figure 3.8 : The statistical distribution of the 'y-ray energy : (a) Emission 70 (b) Absorption (c) The resonant overlap for successive emission and absorption.
Illustration taken from [46].
Figure 3.9 : The basic setup for a Mässbauer experiment and a typical 70 transmission spectrum.
Figure 3.10: Origin of isomer shift; s-electron density greater in absorber. 75
Figure 3.11 : Quadrupole splitting in 57Fe. 75
Figure 3.12 : Viscosity. More viscous materials require a higher 77 shear stress per unit flow rate.
Chapter 4 - Experimental Materials and Techniques
Figure 4.1 : The phase relation for the SnO-Si02 glass system [6]. 88
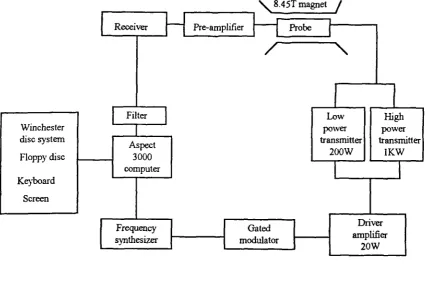
Figure 4.3: A schematic diagram of the Mbssbauer spectrometer 98
Figure 4.4 : The decay scheme for 119 Sn. 100
Figure 4.5 : The essential parts of a penetration viscometer 103
Figure 4.6: A typical DTA curve showing the transformation temperature. 104 T is the transition temperature, Tx is the crystallization temperature and
T 1 is the melting temperature.
Figure 4.7: Cross-section of the inside of the quartz dilatometer. 105
Figures 4.8 Hardness indentation shapes. 110
Chapter 5 - The Binary SnO-Si02 Glass System
Figure 5.1 : (a) Glass formed in the middle of the crucible, 114 globules of tin metal at the bottom and undissolved Sn0 2 at the top.
(b) Cross section of the crucible, showing how glass with low SnO ( 20 mol.% ) content formed.
Figure 5.2 : Modified phase relationship for the SnO-Si02 glass system 116 based on reference [5].
Figure 5.3: 119 5n static NMR spectrum of a SnO-Si02 glass 119 superimposed on the 119 Sn static NMR spectra of crystalline SnO and Sn02.
Figure 5.4: A 119 Sn MAS NMR spectrum of a SnO-Si02 glass that 120 clearly shows the presence of both oxidation states of Sn 2+ and SO+ in the glass.
Figure 5.6: Some 29 Si MAS NMR spectra of SnO-Si02 glasses. 125
Figure 5.7 : Position of peak maxima for 29 Si MAS NMR spectra 128 in various silicate glasses.
Figure 5.8 : Full width at half-maximum versus SnO/Pb0 contents for 130 29 Si MAS NMR spectra of SnO-Si02 and Pb0-Si02 glasses.
Figure 5.9 : Qn distribution as predicted by the binary (a) and statistical (b) 132 models taken from reference [17].
Figure 5.10: Some examples of simulations of 29 Si MAS NMR spectra 140 of SnO-Si02 glasses. The dots are observed intensities and the solid lines are
computer fit with the individual Gaussians placed below. (a) Two Gaussians fit of 16.8 mol.% SnO (b) Three Gaussians fit of 64.0 mol.% SnO
(c) Four Gaussians fit of 49.4 mol.% SnO.
Figure 5.11 : Chemical shift ranges of different Q n species for SnO-Si02 142 glasses generated from the simulated spectra.
Figure 5.12: Some of the 77 K MOssbauer spectra of the SnO-Si02 144 glasses studied, showing the presence of small amounts of dissolved SO+.
Figure 5.13 : Variation of 119 Sn MOssbauer chemical isomer shift with 145 Sn 5s electron density.
Figure 5.14 : Variation of the isomer shift of Sn 2+ at 77 K in SnO-Si02 147 glasses as a function of SnO content. The isomer shifts are relative to a-tin.
Figure 5.15: Variation of the quadrupole splitting of Sn 2+ at 77 K 149 in SnO-Si02 glasses as a function of SnO content. ( Errors are within the dimension of the symbol used ).
Figure 5.16 : Isomer shifts and number of 5p electrons against quadrupole 151 splitting for Sn( II) compounds and SnO-Si02 glass. The symbol 0 and + are for Sn ( II ) compounds and SnO-Si02 glass respectively. The isomer shifts are
relative to a-Sn. The original graph is by Lees and Flinn [28].
Figure 5.17 : Variation of the linewidth of Sn2+ Môssbauer spectra of 153 SnO-Si02 glasses as a function of SnO content. ( Errors are within the
dimension of the symbol used).
Figure 5.18 : Variation of the total shift of 5n2+ Mtissbauer spectra of some 157 SnO-Si02 glasses as a function of temperature. The shifts are relative to SnO.
( Errors are within the dimension of the symbol used ).
Figure 5.19: Log i o ri versus temperature of some SnO-Si02 glasses. 161
Figure 5.20 : Log ic, 11 versus the reciprocal of absolute temperature 162 of some SnO-Si02 glasses.
Figure 5.21 : Activation energy of viscous flow (En) as a function of metal 164 oxides content for binary silicate glasses. The original graph and the data
for Pb(II) are taken from reference [34] and [37] respectively.
Figure 5.22: Variation of density ( p) and molar volume (Vm) as a function 166 of SnO content.
Figure 5.24: Glass transition temperature ( Tg ) and dilatometric softening 170 point ( Mg ) versus SnO content.
Figure 5.25 : Refractive index ( TID ) and molar refractivity ( Rm ) 172 versus SnO content.
Chapter 6 - Differential Thermal Analysis and Devitrification of SnO-Si02 Glasses
Figure 6.1 : Glass transition temperatures of SnO-Si02 glasses obtained 179 by DTA and Dilometric experiments
Figure 6.2 : DTA traces of SnO-Si0 2 glasses. The symbol * is the 180 reference peak of a —> 13 quartz transition.
Figure 6.3 : X-ray powder diffiaction patterns for heat treated TS9 glasses. 185 Lines indicate the positions of the main peak of the various phases present.
The symbol # indicates the peaks from aluminium sample holder.
Figure 6.4 : X-ray powder diffraction patterns for heat treated TS6 glasses. 187 Lines indicate the positions of the main peak of the various phases present.
The symbol # indicates the peaks from aluminium sample holder.
Figure 6.5: SEM micrographs of heat treated TS6 glasses. 189 (a) Heat treated at 600°C for 5 hours in air. (b) Heat treated at 600°C for hours in
argon. The morphology of the crystal is lamellar for both grown in air and argon.
Figure 6.7 119 Sn MOssbauer spectra of TS9 glass 192 and air heat treated TS9 glasses.
Figure 6.8: 119 Sn Mossbauer spectra of glass TS6 and TS9 193 after heat treatment in argon.
Figure 6.9: Schematic diagram of the mechanism of 196
devitrification of SnO-Si02 glasses.
Chapter 7 - Tin-Doped Float Glass
Figure 7.1 : Typical tin diffusion profiles in the underside of float glass 200 produced by Pilkington Glass Plc.
Figure 7.2 : Variation of tin oxidation state with total tin content 204 ( Errors are within the dimension of the symbol used ).
Figure 7.3 : Môssbauer spectra of tin-doped float glass taken at 77 K. 206 Samples PK2.5S and PK5S appear to contain only SO+.
Figure 7.4 : Variation of isomer shift and quadrupole splitting of Sn 2+ 209 in tin-doped float glasses, as a function of SnO content, compared to the
isomer shift and quadrupole splitting of Sn2+ in crystalline amorphous SnO.
The shift are relative to a-tin. ( Errors are within the dimension of the symbol used ).
Figure 7.5: Variation of isomer shift and quadrupole splitting of SO + 210 in tin-doped float glasses, as a function of Sn02 content, compared to the
isomer shift and quadrupole splitting of Sn 4+ in crystalline amorphous Sn02.
The shift are relative to a-tin. ( Errors are within the dimension of the symbol used ).
Figure 7.7 : Variation of the f factors of Sn2+ and SO+ in tin-doped float 218 glass as a function of temperature between 14.2K and 900K.
Figure 7.8 : Log i o versus reciprocal temperature of tin-doped float glasses, 221 fitted by a 1st order polynomial.
Figure 7.9: Activation energy for viscous flow ( ) versus tin content. 223
Figure 7.10 : Variation of Log i o versus temperature for undoped 225 and tin-doped float glasses. The annealing and softening points correspond
to Log iori values of 12.4 and 6.6 respectively.
Figure 7.11 : Coefficient of linear thermal expansion versus tin content 229 of tin-doped float glasses.
Figure 7.12: Transition temperature ( 1 .2 ) and dilatometric softening 230 temperature ( Mg ) versus tin content of tin-doped float glasses.
Figure 7.13 : Density variation with tin content of tin-doped float glasses. 231 ( Errors are within the dimension of the symbol used ).
Figure 7.14 : Refractive index as a function of tin content of tin-doped 232 float glasses. ( Errors are within the dimension of the symbol used ).
LIST OF TABLES Page
Chapter 2 - Glass Structure and The Role of Tin
Table 1.1 : The ionic radius, coordination number with respect to oxygen, 38 field strength, ionic potential and ionic refraction of tin, lead and sodium.
Chapter 3 - Theoretical Background
Table 3.1 : Energies and linewidths of various transitions [47]. 64 Table 3.2 : Typical energies of nuclear and chemical interactions [ 46 & 48]. 64 Table 3.3 : Chemical Shift of some 119 Sn compound [48]. 73 Table 3.4 : Characteristic temperatures with corresponding viscosities for glasses. 78
Chapter 4 - Experimental Materials and Techniques
Table 4.1 : Nominal composition, melting temperature and time, 89 optical quality and amorphicity of SnO-Si02 glasses.
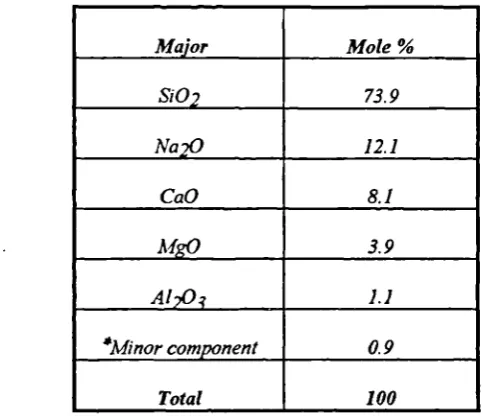
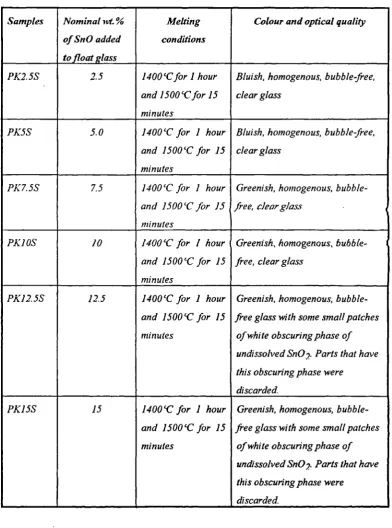
Table 4.2: Analyzed composition of the powdered float glass called PKO. 91 Table 4.3 : Preparation conditions and optical quality of tin-doped float glasses. 92
Chapter 5 - The Binary SnO-Si02 Glass System
Table 5.1 : The nominal and analyzed composition of SnO-Si02 glasses. 115 Table 5.2 : 29 Si static NMR data for SnO-Si02 glasses. ' 123
Table 5.3: 29 Si MAS NMR data for SnO-Si02 glasses. 126
Table 5.4: Comparison of 29Si MAS NMR chemical shift range 126 in SnO-Si02, Pb0-Si02 and Na20-Si02 glass systems.
Table 5.6: Qn distributions and Gaussian fits for SnO-Si02 glass 135 containing 32.6 mol.% SnO.
Table 5.7: Qn distributions and Gaussian fits for SnO-Si02 glass 136 containing 39.7 mol.% SnO.
Table 5.8: Qn distributions and Gaussian fits for SnO-Si02 glass 137 containing 49.5 mol.% SnO.
Table 5.9: Qn distributions and Gaussian fits for SnO-Si02 glass 138 containing 55.4 mol.% SnO.
Table 5.10: Qn distributions and Gaussian fits for SnO-Si02 glass 139 containing 64.0 mol.% SnO.
Table 5.11 : Qn distributions and Gaussian fits for SnO-Si02 glass 139 containing 71.5 mol.% SnO.
Table 5.12 : Composition and Môssbauer parameters of SnO-Si02 143 glasses taken at 77 K.
Table 5.13 : Debye temperature of Sn2+ in SnO-Si02 glasses 155 as compared to amorphous and crystalline SnO.
Table 5.14 : The R = f77 / f300 factor. 156
Table 5.15 : The values of a8I / aT. 159
Table 5.16: Activation energy of viscous flow of SnO-Si02 glasses. 163 Table 5.17: The nominal and analyzed composition, density and 167 molar volume of SnO-Si02 glasses.
Table 5.18: Coefficient of linear thermal expansion ( a ), oxygen molar 168 volume (V0 ), transformation temperature ( Tg ) and dilatometric
softening point ( Mg ) of SnO-Si02 glasses.
Chapter 6 - Differential Thermal Analysis and Devitrification of SnO-Si02 Glasses
Table 6.1: Glass transition ( T ) and position of exothermic 181 peak maximum obtained from the DTA experiment.
Table 6.2: Summary of the results of heat treatment of some SnO-Si02 188 glasses.
Table 6.3 : Mässbauer parameters of the Sn2+ site in SnSiO3, 191 in the parent glass and in crystalline SnO.
Table 6.4: Summary of 29 Si MAS NMR spectra for glass 195
TS6 ( 40.9 mol.% SnO ).
Chapter 7 - Tin-doped Float Glass
Table 7.1 : Summary of some of the previous studies of tin in float glass. 199 Table 7.2 : Analyzed composition of float glass and tin-doped float glass. 201
Table 7.3 : Tin contents of tin-doped float glasses. 202
Table 7.4 : The parameters of 119 Sn MOssbauer spectra of tin-doped 205 float glasses.
Table 7.5 : Composition and MOssbauer parameters of tin-doped float 207 glasses as compared to Mässbauer parameters of SnO and Sn02
( crystalline and amorphous ).
Table 7.6 : Miissbauer parameters of PK15S at temperature between 215 17.5K and 900K.
Table 7.7 : Debye temperatures of Sn 2+ and SO+ in tin-doped 216 float glass and corresponding tin oxides.
Table 7.8 : The f factors of Sn2+ and SO+ in tin-doped float glass. 217
Table 7.9: The f factor at absolute 0 K. 219
Table 7.11 : Composition of tin oxidation states in tin-doped float glass. 220 Table 7.12: Activation energy of viscous flow of tin-doped 222 float glass ( 5500 - 800°C).
Table 7.13 : Parameters of the equation log rl = A +—B +—C T T2 for the viscosity of tin-doped float glasses, valid for temperature range between 500° to 850°C.
Table 7.14 : Annealing and softening temperatures determined by
viscosity measurements of tin-doped float glasses compared to some soda-lime-silica glasses.
Table 7.15 : Coefficient of linear thermal expansion (a),
transition temperature ( Tg ), dilatometric softening temperature ( Mg ), density, refractive index (rn ) and Knoop microhardness ( Hk )
of tin-doped float glasses.
224
226
LIST OF ABBREVIATIONS
DTA - Differential Thermal Analysis
JCPDS - Joint Committee For Powder Diffraction Standards XRD - X-ray Diffraction
SEM - Scanning Electron Microscopy XPS - X-ray Photo Electron Spectroscopy
ESCA - Electron Spectroscopy For Chemical Analysis NMR - Nuclear Magnetic Resonance
NQR - Nuclear Quadrupole Resonance
MAS NMR - Magic Angle Spinning Nuclear Magnetic Resonance EPMA - Electron Probe Microanalysis
EDX - Energy Dispersive X-ray Analysis EPR - Electron Spin Resonance
TEM - Transmission Electron Microscopy SIMS - Secondary Ion Mass Spectrometry
CEMS - Conversion Electron MOssbauer Spectroscopy EXAFS - Extended X-ray Absorption Fine Structure NWF - Network Former
NWM - Network Modifier
ACKNOWLEDGEMENT
I would like to record my thanks to my supervisor, Dr. Diane Holland for her excellent guidance, interest and inspiration that made this study a rewarding experience. My special thanks go to Professor C.E. Johnson and Miss K.F.E. Williams ( University of Liverpool ) and Dr. J.A. Johnson ( Liverpool John Moores University ) for collaboration work on Môssbauer Spectroscopy. Also my thanks to B.Tilley and J.Greengrass of Pilkington Group Research for float glass samples, silica crucibles and help with the chemical analysis. I am indebted to Dr. A. Howes for helping with the NMR experiments, Dr. S. Kitchin for computer simulation of 29 Si NMR spectra and Professor R. Dupree for some discussion of NMR spectra.
My thanks also to the University Technology of Malaysia and The Public Services Department of Malaysia who jointly provided financial support.
DECLARATION
The work presented here was carried out in the Department of Physics, University of Warwick from November 1991 to October 1994 under the supervision of Dr. D. Holland. The results are the outcome of my own independent research except where specifically referenced in the text and have not previously been submitted for any
other degree.
Some parts of this thesis have been published or accepted for publication as follows:
(1) ' The structure of tin silicate glasses' D. Holland & M.M. Abd Karim.
Topical Issues in Glass, Volume 1 , April 1993, Society of Glass Technology, Sheffield, England.
(2) ' Tin silicate glasses'
D. Holland, M. M. Karim, C.E. Johnson, K.Williams & J.A. Johnson.
Rivista della Stazione Sperimentale del Vetro 23, 223 (1993). European Society of Glass Science and Technology, Venice.
(3). ' Môssbauer spectra of tin in float glass'
J.A.Johnson, C.E. Johnson, K.F.E.Williams, D.Holland & M.M.Karim Hyperfine Interactions 00 (1995) 575 - To be published.
(4) ' Physical properties of glasses in the system SnO-Si02 ' M.M.Karim & D.Holland
Physics and Chemistry of Glasses - To be published, October 1995.
It is anticipated that other parts of this thesis will be submitted for publication in the future.
ABSTRACT
The roles of tin in two silicate based glass systems have been investigated by NMR and Môssbauer spectroscopies and by physical property measurements of the glasses.
The first glass system investigated was the stannous silicate (binary SnO-Si02) glass. Glasses with SnO contents ranging from 17 to 72 mol.% have been made by melting pelleted powder in an alumina crucible. It was found that alumina crucibles are unsuitable for making glass with <20 mol.% SnO because of attack on the crucible at the high melting temperature (_>_1600°C). Silica crucibles will not withstand such high temperature and tin will attack a platinum crucible. The ability of this system to form glass past the orthosilicate composition has been discussed in terms of the polarizing power of Sn2+ and the structure of SnO. The 119 Sn NMR results did not give much structural information due to the high chemical shift anisotropy of Sn 2+ site but they showed that the glass also contains trace amounts of Sn 4+species. The 29 Si MAS NMR results showed that SnO does not depolymerise the silicate network to the same extent as Na20 or even Pb0. Computer simulations of the 29 Si MAS NMR spectra showed that, for SnO <-30 mol.%, the disposition of Qn species is consistent with the binary model, which means that SnO is acting the role of modifier. For compositions > 30 mol.% SnO, the Qn distribution follows the statistical model and this has been interpreted as SnO now acting as an intermediate. The 119Sn MOssbauer results confirmed this interpretation. The Sn2+ isomer shift decreases with increase of SnO which is indicative of increasing covalent character of the Sn—O bonds while the larger quadrupole splitting suggests distortion of the SnO polyhedral structure in the glass. The relation of the Sn 2+ isomer shift to the
quadrupole splitting and the temperature dependence of the isomer shift of Sn 2+ indicate the formation of Si—O—Sn linkages at high SnO contents. The decrease of the viscosity of the glass with increasing SnO is small when compared to the decrease of the viscosity in alkali metal and alkaline-earth oxides silicates when the respective modifier oxide is increased in those glasses. The variation of the density, thermal expansion and refractive index with SnO content showed discontinuities in the region of 30-45 mol.% SnO. This has been interpreted as being the point where SnO changes its role from that of modifier to intermediate.
The results of differential thermal analysis and devitrification of SnO-Si02 glasses showed that glass with 40 mol.% SnO can be heat treated in the temperature range of 570° to 680 °C to produce metastable SnSiO3 crystals. SnSiO 3 decomposed to SnO + Si02 at temperatures above —700°C and, at temperatures greater than 720°C, oxidation of SnO to Sn02 and Si02(glass) to Si02 (cristobalite) took place.
Chapter 1 - General
1.1 INTRODUCTION
In this condition, tin from the float bath diffuses into the float contact surface and to a lesser extent into the non-contact surface by chemical adsorption of tin vapour. It is found that the tin contact surface has a high concentration of tin in different oxidation states to a depth of 5 - 30 iirn [6 - 10]. Therefore the float contact surface has chemical characteristics different in some respects from those of the bulk glass. Although this compositional modification does not extend far into the surface, it does cause the physical and chemical behaviour to differ from that of the bulk glass and the upper surface. For general uses, such as window glass, this is not critical. However, for specialized uses such as very thin glass discs used as substrates for optical and magnetic recording, this will affect the planarity of the disc. in addition, the stoichiometry of the tin oxide at the surface affects the tendency of the surface quality
to deteriorate (blooming) when the glass is reheated for tempering to produce curved articles like car windscreens [6]. Past studies on the float glass were confined only to the examination of the tin profiles [6 - 10] i.e. to quantify the various tin oxidation states as a function of depth in the glass. There have not been many studies of the effect of tin concentration on the physical properties of float glass. Minko [11,12] studied the synthesis of soda-lime-silica glass containing tin of different valencies as a means of simulating the float contact side of industrial float glass and measuring its physical and chemical properties. They found that the relative amounts of SO + and Sn2+ in the glass depend on the melting conditions and SO + is assimilated in the glass melt in an amount not exceeding the alkali content of the glass, whereas this is not the limit for Sn2+. The optical, thermal and chemical properties of the glass also improve significantly with the presence of tin in various valence states. The variation of these properties with tin content seems to depend on the relative amount of SO + and Sn2+ in the glass. This shows that SO + and Sn2+ play different roles in the glass structure.
Thus we see that glass can form with a high SnO content in stannous germanate, stannous borate and stannous silicate systems. But, why can high SnO content glasses form in these systems? Past studies have not answered this question. The structural role of tin in these glasses, particularly the stannous silicate glasses has yet to be studied. By analogy with Pb0( Pb 2+ ), we might expect SnO to act in a rather complex structural manner. In Pb0 - Si02 glass, Pb0 acts as a modifier at low Pb0 content ( < 30 mol% ) and a combination of a modifier and an intermediate oxide at higher Pb0 content ( > 30 mol% ) [20]. In this system glasses will form with Pb0 contents up to 90 mol%, implying that a lead-oxygen network must exist with considerable Pb—O covalency, whereas with corresponding ionic modifiers such as Sr0 - Si02 or Na20 - Si02 it is very difficult to prepare glasses beyond the metasilicate composition. Does Sn 2+ behave like Pb2+ or as a modifier ?.
It is felt that there are many unanswered questions as to the role of tin in glass. Therefore this research is an exercise to seek some answers with the emphasis on silicate and soda-lime-silica glasses.
1.2 AIMS OF THE RESEARCH
It is therefore important that a systematic study of the environment of tin in silicate and soda-lime-silica glasses be carried out in order to understand the structural role of tin in these glasses. Also important is the study of the effect of tin concentration on the physical properties of these glasses in order to remedy the lack of information in the literature in these areas. Therefore the aims of the research are as follows:
(b) To study the effect of tin concentration on the viscosity, density, thermal expansion and refractive index of binary SnO - Si02 glass since these indirect techniques can provide some understanding of the structural features of this glass. (c) To study the crystallization of some of the binary SnO - Si02 glasses.
(d) To study the structural role of the different valence states of tin in float glass by Môssbauer Spectroscopy.
(e) To study the effect of tin concentration on the viscosity, density, thermal expansion, refractive index and microhardness of tin-doped float glass.
1.3 CHOICE OF SYSTEMS
To achieve the aims of the research, two glass systems were chosen. They are:
1. Simple binary SnO - SiO2 glass system with nominal SnO contents between 20 and 80 mol% SnO.
1.4 THESIS PLAN
The contents of this thesis will be divided into chapters as follows:
Chapter 2
Chapter 2 covers the definition of glass and the structure of glass with the emphasis on models of glass structure. It will continue with some reviews of tin in various glass systems and finally touches on the chemistry and structure of tin oxides.
Chapter 3
Chapter 3 is a chapter on theoretical background. It gives an account of the theory of Nuclear Magnetic Resonance and M6ssbauer Spectroscopy that will be used in the structural studies. This chapter continues on the theory of viscosity of glass and some methods of its measurement.
Chapter 4
Chapter 4 describes the experimental techniques employed in the research programme. These will include preparation of glass samples and its compositional analysis, Nuclear Magnetic Resonance, Mässbauer Spectroscopy, Viscosity Measurement, Differential Thermal Analysis, Dilatometry, Refractive Index Measurement, XRD Analysis, SEM, Density Measurement and Microhardness Testing.
Chapter 5
Chapter 6
This chapter presents the results and discussion on differential thermal analysis and devitrification of SnO-Si02 glasses. The techniques employed were Differential Thermal Analysis, X-Ray Diffraction, 29Si MAS NMR , 119 Sn MOssbauer Spectroscopy and Scanning Electron Microscopy.
Chapter 7
Chapter 7 is a chapter on tin-doped float glass. It starts with glass preparation and compositional analysis and then presents and discusses the results of 119 Sn MOssbauer Spectroscopy and physical property measurements and finally the conclusions that can be derived from them.
Chapter 8
REFERENCES
1. Dodd, A.E. (1964). Dictionary of Ceramics, George Newnes Limited, London. 2. Rooksby, H.P. (1964). Physics Chem. Glasses 5(1), 20.
3. Weyl, W.A. (1967). Coloured Glasses. Society of Glass Technology, England. 4. Sanyal, A.S. & Mukerji, J. (1982). Physics Chem. Glasses 24(4), 79.
5. Persson, R. (1969). Flat Glass Technology, Butterworths, London, pg.18. 6. Pilkington,A. (1969). Proc.R.Soc. London A314,1
7. Colombin, L., Jelli, A., Riga, J., Pireaux, J.J. & Verbist, J. (1977). J. Non-Cyst. Solids 24, 253-258.
8. Sieger, J.S., (1975). J. Non-Cryst. Solids 19, 213-220. 9. Jie, L. & Choa, X. (1990). J. Non-Cryst. Solids 119, 37-40.
10. Chappell, R.A. & Stoddart, C.T.H. (1974). Physics. Chem. Glasses 15(5), 130. 11. Principi, G., Maddalena,A., Gupta, A., Geothi-Bianchini, F., Hreglich, S. & Verita, M. (1993). Nuclear Instruments and Methods in Physics Research B76, 215-217.
12. Min'ko, N.I. (1973). Neorg. Mater., 9(10) , 1816-1821.
13. Min'ko, NI., Kislitsyn, B.F., Fabrikant, S.A. & Konik, L.T. (1973). Steklo.
Keram. 4, 19-21.
14. Volf, M. B. (1984). Chemical Approach to Glass, Elsevier, Oxford, pg.412. 15. Maddock, A.J. (1939). J. Soc. Glass Tech. 23, 372-377.
16. Silver, J., White, E.A.D. & Donaldson, J.D. (1977). Journal of Material Science 12, 827.
17. Philips, B. & Scroger, M.G. (1965). J. Amer. Ceram. Soc. 48, 398.
18. Paul, A., Donaldson, M.T., Donoghue, M.T. & Thomas, M.J.K. (1977). Physics Chem. Glasses 18(6), 125.
19. Carbo Nover, J. & William, J. (1967). Physics Chem. Glasses 8(4), 164. 20. Ishikawa, T. & Akagi, S. (1978). Physics Chem. Glasses 19(5), 108.
Chapter 2 - Glass structure and the role of tin
2.1 DEFINITION OF GLASS
Glass is generally defined as a product of melting that has formed a solid, amorphous material on solidification of the melt without crystallization [I]. The term 'amorphous' is a description of any condensed phase which lacks long-range order according to diffraction ( x-ray , neutron and electron) criteria. Thus liquid mercury and carbon black are equally representative of the amorphous state of matter but they are not glass. Therefore the terms 'glassy' and 'vitreous' are synonymous and refer to a very restricted class of amorphous materials which are solid, hard, transparent, brittle, isotropic and which soften progressively and continuously when heated. The majority of glasses encountered, which are of high commercial value, are inorganic and are composed of certain metal oxides melted together and supercooled to a glass. Thus the American Society for Testing of Materials defines a glass as 'an inorganic product of fusion which cooled to a rigid condition without crystallizing' [2]. The emphasis on 'inorganic' matter in this definition excludes elementary glasses such as vitreous selenium or certain organic substances ( glucose, glycerol, plastic etc.) which can be supercooled to a rigid condition without crystallizing and many other collections of amorphous materials prepared by techniques other than melting such as vapour deposition, chemical or electro deposition, shock treatment, sol-gel etc. Therefore a more precise definition of glass would be;
"A glass is an x-ray amorphous material that exhibits the glass transition phenomenon" [3 - 5]. The glass transition is that phenomenon in which a solid amorphous phase exhibits, with increasing temperature, a more or less sudden change in the derivative thermodynamic properties, such as heat capacity and expansion coefficient, from
when used in this study generally refers to fused inorganic oxides of which silica is one of the principal components.
2.2 MODELS OF GLASS STRUCTURE
With the exception of quartz (Si02) glass, glasses that are encountered in everyday usage are multicomponent and chemically very complex. There is scarcely a glass which contains fewer than four constituent elements. Consequently the resulting structures can become extremely complicated; due to the fact that one is dealing with a disordered arrangement of atoms and molecules. Therefore elucidating the glass structure is a difficult job. Attempts to envisage the structure of these glasses has produced a variety of models. It is generally accepted that the short range order and therefore the primary building blocks (polyhedra) in a glass structure are not too dissimilar to the corresponding crystal equivalents. For oxide glasses the widely accepted model is the Random Network Model (RNM) proposed by W.H. Zachariasen [6]. This will be discussed in the following section. It must not be imagined that the basic RNM can be successfully applied to all inorganic glass forming materials, therefore its modification and other models will also be discussed.
2.2.1 RANDOM NETWORK MODEL
cation must be closely similar in glass to that observed in crystal. This means that the basic structural units in the glass and in the crystal are identical and the ordinary rules of crystal chemistry apply to glass. In the case of oxide glass these basic units are oxygen polyhedra. For example the SiO4 tetrahedron is the basic unit of silicate glass. Zachariasen postulated that, as in crystal, the structural units are combined to give a 3D assembly but in glass the bond angles and bond distances vary. This results in an arrangement lacking in periodicity and symmetry called a random network. Therefore the random network lacks long range atomic order and produces the diffuse, liquid-like x-ray diffraction pattern. Figure 2.1 shows the differences between the regular crystalline lattice and the random network for an oxide having the formula M203. Zachariasen then derived some empirical conditions for glass formation, as follows;
(i) No oxygen anion may be linked to more than two cations.
(ii) The number of oxygen anions surrounding the cation should be small (4 or less). (iii) The oxygen polyhedra must share corners with each other, not edges or faces. (iv) The structure should form a continuous three dimensional network, which requires that at least three corners in each oxygen polyhedron must be shared.
From these postulates, the dominant type of polyhedron would be the tetrahedron as the octahedron would tend to share edges and faces with neighbouring polyhedra.
(a)
[image:37.595.187.377.77.658.2](b)
Figure 2.1 : Schematic two-dimensional representation of the structure of (a) a hypothetical
crystalline compound Al203 (b) the glassy form of the same compound. Illustration taken from
Zachariasen also proposed a system of categorizing oxides as: Network Formers - Oxides that readily form glasses, e.g. Si02, B203, Ge02 and P205.
Intermediate - Oxides that cannot independently form glasses but can readily substitute for a network former, e.g. Al203, Be0, Zr02 and Ti02.
Modifier - Oxides that disrupt the continuity of the network by breaking dihedral bonds, thus weakening the glass network, e.g. alkali-metal and alkaline-earth oxides. Na20 is a good example and it will be used to illustrate the role of a modifier oxide.
Figure 2.2 illustrates the role of modifier oxides in the glass network. As can be seen in Figure 2.2(a), the introduction of Na20 to silica glass causes structural changes by breaking the dihedral bonds. The addition of one molecule of Na20 Will produce two non-bridging oxygens. Thus the effect of introducing sodium oxide has
been to produce a gap in the continuous network and results in changes in the properties such as reduction of viscosity and lowering of the transition temperature. The sodium ions are accommodated in the holes or interstices in the network structure ( see Figure 2.2(b) ). The continued addition of modifier will give rise to progressive breakdown in the dihedral bonds and hence there is a limit to the number of non-bridging oxygens that can be accommodated whilst still forming a stable glass. The glass forming limit of binary alkali silicate glasses is the metasilicate composition, where the average tetrahedron has two each of non-bridging and bridging oxygens, giving linear chains and ring structures. Further addition of alkali oxide will produce smaller units leading eventually to the formation of monomers (SiO4 4 ions) at the orthosilicate composition. This results in a significant decrease in stability, making glass formation extremely difficult.
+ No20
+ 2No+
• Silicon ion
0
Bridging oxygen ion Non-bridging oxygen ion(a)
• Silicon ion Sodium ion
0
Bridging oxygen ions
Non—bridging oxycen ion [image:39.595.109.390.58.652.2](b)
Figure 2.2 : Two-dimensional illustration of : (a) Reaction between sodium oxide and silica
tetrahedra. The addition of one molecule of sodium oxide produces two non-bridging oxygens.
(b) The structure of soda-silica glass. The sodium ions are accommodated in the holes or interstices
oxygens to neighbouring SiO4 tetrahedra. Therefore the value of n is between 0 and 4. Figure 2.3 schematically details the various Q n species.
The properties of a glass depend on the exact way in which the different bond types are distributed, i.e. the quantities of different Qn species and their distribution [14]. How the different Qn species are distributed in the glass can be described by two models; the binary (constrained) [15] and the statistical (unconstrained random) [16] distribution models. In the binary model the non-bridging oxygens repel each other leading to maximum dilution which in turn gives successive formation of lower Qn species and a homogeneous distribution of no more than 2 Q n types. The statistical distribution model has no limit on the number of Q n species present for any composition. The distribution is determined only by composition and statistics. The distribution of non-bridging oxygens has been studied for all the alkali metal silicate glasses using 29Si NMR by different researchers. Grimmer et al [17-19] for Li, Na and K; Schramm et al [16] for Li; Dupree et al [15,20-21] for Na, Rb, Cs & Li and Gladden et al [22] for Li. Except for Schramm et al, who observed a statistical distribution for Li, the other researchers generally observed a binary distribution behaviour for alkali metal silicate glasses.
The structural role of intermediate oxides has the opposite effect to that of the modifying oxides because it can strengthen the network by removing the non-bridging oxygens. Al203 is a good example. In crystals, the aluminium ion can be four or six co-ordinated with oxygen giving rise to tetrahedral (A104) – or octahedral (A106)3– groups. The tetrahedral groups can replace SiO4 tetrahedra in silicate lattices to give the arrangement shown in Figure 2.4. Because 0 – ions are needed to form the polyhedral units of (A104)- and (A106)3–, non-bridging oxygens are consumed and the Si-0—AI linkages repolymerise the network and produce a glass of greater stability. ( It should be mentioned that Al also shows coordination of 5 in glasses and a few crystals).
oI oI oI O 6
I I I I I
—0—S i---0— —0—S -0—S -0—S i---0- -0--S i-0-o
i
o I
o
I I I
0 0
I I I
Q4
Q3 Q2 Q1 QO
[image:41.595.174.371.383.588.2]Figure 2.3: A schematic representation of the different Q n S104 species as defined by Lippmaa et al [13].
Figure 2.4 : Al203 in silicate network. For charge neutrality purposes one alkali metal ion or half
an alkaline earth ion per A104 tetrahedron is located close to the A104 tetrahedron, which has a
Trap and Stevels suggest that there is an inversion in the structural role of the modifying ions at the metasilicate composition, hence glasses containing less than 50 mol% glass formers are called 'invert glasses' [24]. It is believed that Pb 2+ can act as either a modifier or intermediate oxide depending on concentration [25]. Compositions higher than the orthosilicate (2PbO.Si02) can still form stable glass. This would obviously be impossible if Pb 2+ were acting solely as modifier. Therefore it is believed that, at high Pb0 concentration, a lead-oxygen network must exist with considerable Pb—O covalency. Dupree et al [25] examined the 29 Si environment in this glass system by MAS NMR and made the following observations:
(i) Below –30 mol% Pb0 - Pb2+ may act as a traditional modifier ion and the disposition of non-bridging oxygens is consistent with a binary Q 4/Q3 distribution. (ii) Between 30 and 40 mol% Pb0 - A Q4 peak can still be resolved, which may reflect a change to a statistical distribution or may indicate the formation of Si—O—Pb bridging units which may be indistinguishable by NMR from Si—O--Si units because of the similarity in electronegativities.
(iii) From 40 to 65 mol% Pb0 - A statistical distribution of non-bridging oxygens is consistent with the observed spectra.
(iv) At 70 mol% Pb0, the glass contains mainly isolated Q O species in a Pb-0 matrix. Another invert binary glass is stannous silicate, which forms part of the subject of this research. Complex invert glasses have also been prepared containing a mixture of at least three modifying oxides, the common conception is that mixing modifiers increases the free energy barrier for crystallization; thus hindering the diffusion of the crystal phase components [24].
modifier oxides (> 60 mol%) has been shown to contain chains of various sizes, thus a three-dimensional network need not be a prerequisite for glass formation. In a later publication Zachariasen [29] stated that this model does not mean to imply that the vitreous network has to have three-dimensional extension. However, glasses would have the most advantageous properties if the tetrahedral or triangular network has three-dimensional cross-linking.
2.2.2 THE MODIFIED RANDOM NETWORK MODEL
modifier. Figure 2.5 illustrates this idea in two dimensions and is best described as a Modified Random Network (MRN) model and, as such, is partly ionic and partly covalent. The structure's appearance is that of an 'archipelago' comprising peninsulas and islands of network lattice regions interspersed by modifier lattice regions that coalesce to form channels or rivers. The extent of these channels or rivers is dependent upon the concentration of modifying oxide in the glass.
The MRN model successfully describes the decrease in viscosity as the modifier oxide content is increased. The increase of modifier will increase the boundary disclinations between the ionic and covalent regions. As these boundaries are lines of easy shear, the more extensive these are within the structure, the lower the viscosity. This model also describes well the ionic conductivity of glass where the current flow is via the percolation channels as compared to conduction via jumping over energy barriers of varying height as in the 'Random Network Model.
2.2.3 CRYSTALLITE MODEL
According to Porai-Koshits [34] the idea that glass consisted of minute crystals was suggested by Frankenheim in 1835. He also said that the birth of the crystallite hypothesis was in 1921, authored by Lebedev. With the advancement of x-ray diffraction, the crystallite hypothesis was later developed in 1930 by Randall et al [35-38]. The x-ray diffraction patterns of glasses generally exhibit broad peaks centered in the range in which strong peaks are also observed in the diffraction patterns of the
Therefore the Crystallite Model of glass structure is one composed of a discrete non-continuous aggregation of extremely small crystals in an amorphous matrix as opposed to the continuous bonding of structural units in the Random Network Model.
Randall et at estimated the crystallite size of Si02 to be around 15-20 A. Warren [39], using more accurate x-ray techniques revised this figure to be about 7 to 8 A. This figure is about the size of a unit cell of cristobalite. Therefore any crystallites would be only a single unit cell in extent and such structures seem contrary to the notion of a crystalline array. According to this hypothesis, this cannot be true but no evidence has been found to indicate the discontinuity of Si02 species within homogeneous glasses. Phillips [40], on the basis electron microscopy and Raman spectroscopy proposed that vitreous silica is composed of crystallite clusters or granules of 13-cristobalite of 66A in diameter. This was convincingly refuted by Galeener and Wright [41] via Raman spectroscopy and neutron diffraction. Hence the crystallite hypothesis remains unsubstantiated although numerous x-ray, electron and neutron diffraction results indicate the existence of a greater degree of orderliness as discussed in the Modified Random Network Model.
2.2.4 STRAINED MIXED CLUSTER RANDOM NETWORK MODEL
of materials, where the bonding is mixed covalent-ionic, highly covalent, highly ionic or metallic.
Figure 2.5: A modified random network for a two dimensional oxide glass,' Al203(G20 3), where AI are modifier cations and G network forming cations. Covalent bonds are represented by solid lines,
ionic bonds by dotted lines. Illustration taken from reference [32].
(a) (b)
Figure 2.6 : Goodman's illustration of a two-polymorph strained mixed cluster model. Interfacial
strain is indicated by + and - symbols [42]. (a) Fully formed space-filling strained mixed cluster
random network, at T (b) Strained mixed cluster random network glass at a temperature below T
[image:47.595.83.487.441.649.2]higher interfacial strain, less efficient cluster packing, a higher content of space filling liquid and consequently a higher specific volume and therefore a higher Tg value.
On progressive cooling below Tg the residual liquid would deposit onto the surrounding cluster surfaces until all was solidified. The resulting structure is depicted in Figure 2.6(b) with each cluster surrounded by a random close packing of other clusters with half of the interfaces under tension and half under compression. Therefore the outer regions of each cluster will be significantly distorted and will not be coherent with its 'ideal' core in terms of x-ray or other diffraction. The estimated cluster size is 3 nm or more across. There is also further strain due to thermal expansion mismatches between the clusters and this will contribute to the oN mall increase in free energy.
2.2.5 CONCLUSION
At present an all encompassing model for glass structure does not exist. What has been presented is not an extensive classification of glass structure. Other models have also been proposed such as Krogh-Moe's [43] molecular theory for borate glasses and Bernal's [44] sphere packing for amorphous metal. An important one is the Stereo-Chemically Defined Model proposed by Gaskell [45] to explain the finding that there is a significant correlation between neutron diffraction data for calcium silicate glasses and their crystalline counterparts in respect of the local and medium range environment surrounding the calcium atoms [46-47]. This model proposed that there is a medium range order of atoms in glass. In other words this model states that the extent of similarity of a well ordered arrangement of atoms in amorphous materials with its corresponding crystalline state is beyond the first coordination sphere.
arrangement may be similar to the corresponding crystalline structure up to the second coordination sphere.
2.3 REVIEW OF TIN IN VARIOUS GLASS SYSTEMS
This section gives a review of some of the work that has been done to study the role of tin in the borate, germanate, phosphate and silicate glass systems.
2.3.1 BORATE GLASS
2.3.1.1 BINARY SnO-B203 GLASS
while the quadrupole splitting does not change much with SnO content. From this study they concluded that, for SnO contents up to 20 mol%, the Sn—O bonding is mostly ionic and, at higher SnO contents, the non-bridging oxygens are coordinated to Sn2+ ions. In other words SnO is acting as modifier at low concentration of SnO and from SnO contents of more than 20 mol% , it starts to make cross-linkages with the glass network.
2.3.1.2 ALKALI TIN BORATE GLASS
increase of alkali content and on going along the Li-Na-K series but the line width in glasses is only slightly greater than the line width in crystalline Sn02. The general conclusion of both studies is that tin in the glass is in the quadrivalent state having a structure in which oxygen forms a highly distorted octahedron around the tin atom.
2.3.2 GERMANATE GLASS
23.2.1 BINARY SnO-Ge02 GLASS
2.3.3 PHOSPHATE GLASS
2.3.3.1 BINARY SnF2-P205 GLASS
Binary SnF2-P205 glass was studied by Shaw & Shelby [56], motivated by the quest of finding glasses with properties of low melting temperature, high chemical durability and high thermal expansion. These properties are desirable for many applications which include the moulding of optical elements using standard equipment normally used for plastics, low temperature glass to metal seals and the incorporation of optically active organic molecules into inorganic glass matrix used in dye lasers. They succeeded in making stannous fluorophosphate glass with glass formation extending over a relatively large (0-80 mol% SnF2) composition region and melting temperatures between 400 to 500°C. But only glasses with SnF2 contents between
55-77 mol% were durable enough to moisture attack and they exhibited a very high thermal expansion. A structural model was proposed by Tick [57] for these glasses,
F 0
I I
0—S n--0--P--0
I I
F 0
Figure 2.7: Structural model of the binary SnFr P205 glass.
2.3.3.2 TERNARY Sn0-SnF2-P205 GLASS
Shaw & Shelby [58] extended their studies to the tenary SnO-SnF2-P205 glass system as a logical extension to the binary SnF2-P205 glass. The addition of SnO to binary stannous fluorophosphate glasses resulted in a decrease in the volatility of the melt and dramatic improvements in the chemical durability of the glass. In binary
F 0
I 1
0--S
n
-0--P
-0
1 1
0 F
Figure 2.8: Structural model of the ternary SnO-SnFTP 20 5 glass
The increase in chemical durability through the increase of SnO content is due to the fact that the weaker linkages of Sn—F—Sn, Sn—F—P and P—F—P are gradually replaced by stronger Sn—O—Sn, Sn—O—P and P—O—P linkages.
2.3.4 SILICATE GLASS
2.3.4.1 BINARY SnO-Si02 GLASS
researchers concluded that there are no binary compounds, stable or metastable in the phase relations of SnO-Si02 glass system.
2.3.4.2 SODIUM TIN SILICATE GLASS
The solubility of Sn02 in silicate glass is very low. A maximum of 0.8 mol% Sn02 can be dissolved in Si02 (quartz) in making the stannosil glass [67], mentioned in chapter 1. However, the presence of alkali oxide, can increase the solubility of Sn02 in a silicate melt. Zorina & Valchranunev [68] studied the incorporation of Sn02 in the following ternary system of sodium tin silicate glasses;
2Me+
whose structure remained constant when quantitative changes were made in the composition of the glass. They concluded that the glass structure was not in agreement with the Zachariasen's disordered lattice hypothesis and indicated the existence of definite chemical compounds in glasses.
2.3.4.3 TIN IN SODA-LIME-SILICA (FLOAT) GLASS
About 85% of the flat sheet soda-lime-silica glass produced in the world is made by the float process in which a ribbon of molten glass flows out of the melting furnace and solidifies while floating on a bath of molten tin enclosed in a float chamber filled with an inert gas mixture of nitrogen and hydrogen. Some tin diffuses into the lower surface that is in contact with the molten tin. A smaller amount diffuses into the upper surface by chemical adsorption from tin vapour in the float chamber. Figure 2.9 shows the typical tin diffusion profiles in the underside of float glass taken from Pantano et al [77]. It shows that the depth of tin penetration is to about 161.1m and the tin oxide concentration at the surface is about 15 wt% ( 4mol% ).
4 8 12 is
DEPTH (i.arn)
29
15
LTI
10
0"
0
o 500 10:0 1500 2000 2500 3000
DEPTH (A)
3
0
Figure 2.9 Typical tin diffusion profiles in the underside of float glass specimens taken from
reference [771 The in-depth and near-surface tin profiles for three different 6 mm clear float
glasses; by EPAL4 ( upper ) and by SlAfS ( below ). For simplicity the tin oxide concentration is
expressed in Id% Sn02 even though it has been shown that tin in both valence states of +2 and +4 coexist in the glass. All the three specimens exhibit what Sieger [72] described as an anomalous
field gradient induced by the electron beam. Sieger [72] studied the tin profiles of float glass surfaces by a method that involved electron-microprobe analysis of the edges of the samples and etching of a layer from the surface and chemically analyzing it for stannous or stannic tin. The depth of tin penetration through the underside varies with glass thickness and cleanliness of the tin bath. Glass near equilbrium thickness (6mm) shows deeper tin penetration than either 3 or 12 mm. Stannous and stannic tin are present near the bottom surface with the former predominating. The tin penetration profile also exhibits a 'hump' located at about half the effective depth of tin penetration. Colombin et al [73] measured the penetration depth of tin in float glass using ESCA [Electron spectroscopy for chemical analysis (---XPS)], photo emission induced by ion bombardment and ellipsometry. Their studies concluded that the concentration of tin in the first 100nm of the underside of float glass decreases very rapidly as a function of depth and the concentration of tin at the surface (10nm) of the underside is very high. Jie & Chao [74] studied the underside of float glass by XPS (X-ray photoelectron spectrometry) to determine the oxidation states of tin. A detailed scan for tin was made on the underside of the float glass sample, measured in the as-received state and after argon ion etching. The depth of tin scanning was about 1 Onm. XPS spectra of pure Sn, SnO and Sn02 were fitted to the spectra of the glass samples. The fit in all cases was excellent and they concluded that,
(i) In the underside of float glass, tin is present in SO+, Sn2+ and Sn°, with SO+ having the largest fraction.
(ii) Deeper into the glass, the fraction of SO+ decreases gradually, while Sn2+ and SnO increases.
species at the surface of float glass. The isomer shift and quadrupole splitting are higher than those of the corresponding crystalline phases. By heating the glass for 10 minutes at 730°C, thus simulating the industrial process which produces blooming (deterioration of glass surface quality), the Sn 2+/Sn4+ area ratio of the CEMS spectra was found to decrease. Therefore from this experiment they have shown that the blooming is caused by the oxidation of some of the Sn 2+ tin species to SO + when the glass is reheated for tempering or to produce curved glass. These findings supported in some way the mechanism for bloom suggested by Deubener et al [76] whereby an oxidation of Sn2+ in the outer layers alters both their viscosity and expansion coefficients by changing the chemical make up of the surface. Pantano et al [77] compared the tin profiles at the bottom surface of float glass due to heat treatment with that of untreated float glass. The concentration profiles of tin in the near surface (0 to 0.5 gm) were obtained using secondary ion mass spectroscopy (SIMS), while the depth profiles (0.5 to 30 gm) were determined with electron probe microanalysis (EPMA). The heat treatment schedule simulated the industrial process which produces blooming. Their results showed that after heat treatment there was a large tin concentration build-up near the surface and tin concentration depletion at greater depth. In another words there was a pronounced out-diffusion of tin to the surface due to heat treatment and this process changed the tin profiles as compared to the unheat treated float glass. Their findings supplement the mechanism for the process of blooming forwarded by Deubener et al above. The studies concluded that surface enrichment of SO+ species due to heat treatment can only exaggerate those physical and chemical property changes, while the abruptness of the decrease of 'tin concentration profiles magnifies their effect upon the surface wrinkling.
tin and studying the effect of tin upon the physical and structural properties of the glass. Studies by Minko et al [78-79] mentioned in chapter 1, have concentrated on the synthesis of glass of float glass composition with varying amounts of Sn 2+ and SO+. Depending on the synthesis conditions, the equilbrium Sn 4+<=> Sn2+ is established in the glass. This can be displaced almost completely to the left, but only 70 % to the right. Minko et al added that the improvement in the physicochemical properties of glasses synthesized under oxidizing compared with those under reducing conditions is due to the differing valence state of the tin in the glass structure. Owing to the different roles played in the glass by the different valence of tin, SO+ is assimilated by the soda-lime-silica melt only in an amount not exceeding the alkali content of the glass, whereas this is not the limit for Sn2+.
2.3.5 CONCLUSION
Sn02 can be increased by the presence of alkali oxide in the glass melt but the amount that can be dissolved does not exceed the alkali content of the glass. Studies of tin in float glass have also shown that SnO(Sn2±) is the predominating species compared to Sn02(Sn4±).
Based on the fact that divalent tin is a major component while tetravalent tin is minor in any glass system, the two valence states of tin must play a different role in the structure of the glass. The difference must be due to the structural difference between SnO and Sn02 as seen in the next section.
2.4 THE STRUCTURE OF THE OXIDES OF TIN
Tin, as a p-element with atomic number 50, belongs to group WA of the periodic table. This group comprises C, Si, Ge, Sn, and Pb. An atom of any of these elements has four electrons in its valence level. The oxides of Si and Ge are glass formers, while lead(II) oxide in silicate, gennanate and borate glasses behaves as modifier or intermediate depending on its concentration in the respective glasses. The ground state electronic configuration of tin is,
0
Sn: 1s2 2s2 2p6 3s2 3p6 3d1.0 4s2 4p6 4d10 52 5p2
Table 1.1
Ion Ionic radius, r
(A)
Coordination
number with respect
to oxygen
Dietzel's field strength
= zia2 (A-2)
z = valency, a =
interionic distance
Ionic potential
= z/r (4- 1)
Ionic
refraction, Ri
Si4+ 0.39 4 1.56 10.26 7.52
Sn 2+ - 4 0.46* - 17.2
Sn2+ 0.93 6 0.41* 2.15
-Sn 4+ - 4 113* -
-Sn4+ 0.69 6 1.01* 5.80
-Pb 2+ 1.18 6 0.31 1.69 27.4
Ara + 1.02 6 0.18 0.98 4.75
* Taken from reference [69]
According to Volf [1], the field strength (bond strength) of network former elements is high, exceeding 1.3 and the modifiers have low field strength below 0.36 and the intermediate elements field strength values are between these two. Volf also states that network formers have high ionic potentials, exceeding 10, modifiers have low values up to 2 and the intermediate ionic potential values are between these two. Based on these criteria tin can be classified empirically as an intermediate element along with lead. The value of ionic refraction give a measure of deformation (polarizability) of an ion [81]. The ionic refraction of Sn2+ is much higher than SO+ and Nat and
2.4.1 THE STRUCTURE OF Sn02.
Tin(IV) oxide (Sn02) crystallizes with the rutile structure and can be regarded as essentially an ionic crystal [83]. The rutile crystal structure is a body-centered tetragonal with SO+ ions at the corners and centre of the cell and oxygen ions located at nonregular interstitial sites, causing distortion of the cell from cubic to tetragonal. The unit cell of Sn02 crystal is depicted in figure 2.10, where the environment of tin is an octahedron of oxygen ions, and the electron density distribution close to the tin nucleus can be regarded as approximately spherical [84].
The poor solubility of Sn02 in silicate melts can be explain by its bond strength (field strength) and structure. Oxides with bond strength values that exceed 0.8 and coordination number exceeding 4 have been classified by Volf [1] as oxides that show poor solubility in glass. In this case the bond strength of SO + is 1.01 and its coordination number is 6. Owing to these factors, SO + poses strong competition for silicon in polymerization. The SO + ion can form its own strong six coordinated oxygen polyhedra differing from the SiO4 group and, as a consequence of its high bond strength and different geometry, it is more difficult to link to the polyionic netwok of silicon tetrahedra. This results in poor solubility in silicate glasses.
2.4.2 THE STRUCTURE OF SnO


![Table 3.1: Energies and linewidths of various transitions [47]](https://thumb-us.123doks.com/thumbv2/123dok_us/9857183.486911/89.595.69.450.362.599/table-energies-linewidths-various-transitions.webp)
![Figure 4.1: The phase relation for the SnO-Si02 glass system [6].](https://thumb-us.123doks.com/thumbv2/123dok_us/9857183.486911/113.595.95.467.240.505/figure-the-phase-relation-for-sno-glass-system.webp)