1 Single Channel Measurements of N-Acetylneuraminic Acid-Inducible
Outer Membrane Channel in Escherichia coli
Janhavi Giri1, 2, John M. Tang1, Christophe Wirth3, Caroline M. Peneff3,
and Bob Eisenberg1*
1
Department of Molecular Biophysics and Physiology, Rush University, Chicago, IL, 60612,
2
Department of Bioengineering, University of Illinois at Chicago, Chicago, IL, 60607,
3
Department of Structural Biology, Biozentrum, University of Basel, Klingelbergstrasse 70,
CH-4056 Basel, Switzerland
Accepted for publication in the European Biophysics Journal December 6, 2011
December 15, 2011
*
2 ABSTRACT
NanC is an Escherichia coli outer membrane protein involved in sialic acid (Neu5Ac, i.e., N
-acetylneuraminic acid) uptake. Expression of the NanC gene is induced and controlled by
Neu5Ac. The transport mechanism of Neu5Ac is not known. The structure of NanC was recently
solved (PDB code: 2WJQ) and includes a unique arrangement of positively charged (basic) side
chains consistent with a role in acidic sugar transport. However, initial functional measurements
of NanC failed to find its role in the transport of sialic acids, perhaps because of the ionic
conditions used in the experiments. We show here that the ionic conditions generally preferred
for measuring the function of outer-membrane porins are not appropriate for NanC. Single
channels of NanC at pH 7.0 have: (1) conductance 100 pS to 800 pS in 100 mM KCl to 3M KCl), (2) anion over cation selectivity (Vreversal = +16 mV in 250 mM KCl || 1 M KCl), and (3) two forms of voltage-dependent gating (channel closures above ±200 mV). Single channel conductance decreases by 50% when HEPES concentration is increased from 100 µM to 100 mM in 250 mM KCl at pH
7.4, consistent with the two HEPES binding sites observed in the crystal structure. Studying
alternative buffers, we find that phosphate interferes with the channel conductance. Single
channel conductance decreases by 19% when phosphate concentration is raised from 0 mM to 5
mM in 250 mM KCl at pH 8.0. Surprisingly, TRIS in the baths reacts with Ag|AgCl electrodes
produce artifacts even when the electrodes are on the far side of Agar-KCl bridges. A suitable
3 INTRODUCTION
The cell envelope of the gram negative bacterium Escherichia coli acts as a shield that
enables the bacteria to survive in drastic environmental conditions as it passes through the human
gastrointestinal tract: pH ~1 in the stomach, digestion by enzymes in the small intestine,
dehydration in the large intestine, and complete drying after defecation. The cell envelope has
two membrane layers separated by the periplasmic space. The outer membrane serves as a
selective barrier through which certain solutes (mainly nutrients) can enter the cell. The selective
barrier involves channel forming β-barrel proteins typically called ‘porins’ (Nakae 1976). Porins
act as molecular filters that allow the passive diffusion of solutes (ions, sugars and amino acids)
into the periplasm. Porins are important determinants of pathogenicity and the virulence of
infections by pathogenic E. coli. (Nikaido 1992; Schirmer 1998; Buchanan 1999; Schulz 2000;
Achouak et al. 2001; Delcour 2003; Benz 2004).
Porins were the first membrane proteins crystallized for X-ray diffraction (Garavito and
Rosenbusch 1980). The structures of many porins are now known, including the classical porins
OmpF, PhoE (Cowan et al. 1992) and OmpC (Baslé A et al. 2006), as well as the specific porins
LamB (Schirmer et al. 1995) and TolC (Koronakis et al. 2000). Indeed, more porin structures are
known than of any other class of membrane passive transporters. The intrinsically strong
structure of their β-barrels enables the porins to resist chemical and mechanical stress and we
imagine make the protein easier to crystallize. (However, not all porins crystallize easily, for
unknown reasons.)
The molecular mechanisms for the diverse roles and survival of porins can be studied
using structural and functional measurements, and molecular modeling. Purified porins are easily
4 through state of the art electrophysiological techniques such as patch-clamp and planar lipid
bilayer reconstitution (Delcour 1997). The detailed characterization of porins reveals the
fundamental mechanisms that determine the functional properties of physiological ion channels
with molecular or even atomic resolution. Detailed characterization helps in the design and
construction (i.e., ‘engineering’) of porins with desired functions (Miedema et al. 2004;
Vrouenraets et al. 2006; Bayley 2005; Miedema et al. 2007).
Porins are usually classified as either general non-specific porins, or solute-specific
porins. The general porins OmpF, OmpC, and PhoE of E. coli are channels that allow passive
diffusion of small solutes (under 600 Da) down their electrochemical gradient. The general
porins transport a variety of substances and do not demonstrate a marked preference for
particular solutes. ‘Specific’ porins show preference for particular solutes, for example, the
maltoporin LamB (Benz et al. 1987) of E. coli selectively transports maltose. The genes of these
specific solute transporting porins are generally induced by special growth conditions that also
induce the protein machinery needed to metabolize the acquired solute transported by the
specific porins. The specific porins are needed for the bacteria to thrive under the special
inducing conditions and are usually not expressed (in substantial quantities) unless those
conditions are present.
NanC belongs to this class of porins and its expression is induced by the presence of N
-acetylneuraminic acid (Neu5Ac), the most abundant of sialic acids. Sialic acids are nine-carbon
negatively charged sugar molecules that together, compose a family of more than 40 members
(Comb and Roseman 1960). The sugars are found primarily at the terminal positions of many
glycoconjugates present in the outer leaflet of the cell membranes of eukaryotes. Pathogenic
5 taking advantage of their exposure to the extracellular space. The ability of the bacteria to
colonize, persist and cause disease (Vimr et al. 2004; Severi et al. 2007) depends on their ability
to use sialic acids, in many cases. Thus, the properties of NanC are of clinical interest to
microbiologists.
Most animal tissues contain free sialic acid (Vimr et al. 2004) that can flow through
NanC and serve as the main carbon source for the E. coli. OmpF/OmpC are often not expressed
by E. coli (Condemine et al. 2005) (for reasons unknown to us). When OmpF/OmpC are not
expressed by the E. coli bacteria, NanC must be present (i.e., it must be induced) to promote
efficient uptake of Neu5Ac across the outer membrane. In those cases the properties of NanC
directly control the life of the bacteria: Induction is not an artificially contrived situation that
only occurs in the laboratory.
The functional role of induction of the sialic acid specific uptake systems has been
demonstrated in many ways under many conditions. The classical approaches include: 1) growth
experiments and 2) liposome swelling experiments (Nikaido 1992; Nikaido 2003). In growth
experiments, the role of a specific membrane protein (or a transport system) is demonstrated by
monitoring the growth of the wild type bacteria and comparing it to ‘knock out’ mutant bacterial
strains that are missing specific proteins. Growth is studied under controlled conditions in
external solutions (‘growth media’) enriched or deprived of a particular solute for example, the
maltodextrin specific transport system in E. coli (Wandersman and Schwartz). In liposome
swelling experiments, the specificity of a membrane protein for a particular solute is
demonstrated by the monitoring the swelling rate of protein containing liposomes in various
solutions. For example, swelling can be measured in liposomes containing the LamB protein of
6 of transport in bacteria and set the stage for biophysical analysis of specific uptake systems.
Biophysical analysis is needed to reveal the mechanistic details of the uptake system at
molecular and atomic resolution. For example, membrane proteins must be characterized using
the patch-clamp or the planar lipid bilayer methods of channel biology to unravel the underlying
mechanisms of transport through single protein molecules (Miller 1986; Sakmann and Neher
1995).
We characterize the functional properties of NanC using electrophysiological methods
because these allow measurements of the current flow through single channels with 0.1 msec
time scale. Classical assays of NanC function measure the properties of macroscopic numbers of
channels embedded at unknown density in the outer membrane of bacteria and have time
resolution of seconds or even minutes.
Recently, a high resolution structure of NanC has been reported (Wirth et al. 2009). The
structure of NanC has many of the features of other outer membrane channel proteins. NanC is a
monomer, a 12-stranded β-barrel with a relatively narrow pore of average diameter 6.6 Å.
However, NanC is also different in many ways from other porin structures. In most of the porins,
a ‘loop’ of a polypeptide chain partially occludes the pore region and is the most obvious
location where specific interactions and gating might occur. Interestingly, NanC has no ‘loop’
occluding the pore. The pore region of NanC is predominately decorated by positively charged
residues that are arranged to form two positively charged tracks facing each other across the
pore. This particular arrangement of the positively charged residues in the pore region seems to
help the negatively charged Neu5Ac to move through NanC. The carboxylate group (COO-) of
Neu5Ac is charged (‘deprotonated’) at physiological pH, because its pKa ~ 2.6. The positively
7 tracks of a railroad guide trains, both passive passenger cars, and active locomotives. The fixed
charges create an environment like the ion exchangers studied by physical chemists and
biophysicists decades ago (Teorell 1953; Helfferich 1962; Karreman and Eisenman 1962; Conti
and Eisenman 1965; Walker and Eisenman 1966; Eisenman et al. 1967; Eisenman and Horn
1983).
Earlier patch-clamp measurements of NanC did not show significant change in the
function of NanC in the presence of even large concentrations of Neu5Ac, up to 50 mM
(Condemine et al. 2005), perhaps because the ionic conditions and buffer used masked the effect
of the sialic acid. The high resolution structure shows many basic (positive) side chains that
would be screened (Chazalviel 1999) in the high salt concentrations used in these earlier
measurements. Structural measurements also show HEPES binding to NanC. Two HEPES
molecules were immobile enough under crystallizing conditions to produce diffraction in the
crystal structure, one near each end of the channel. Binding strong enough to crystallize HEPES
in place in a crystallized channel seems likely to modify current flow through the native channel
despite the differences in ionic conditions.
Our goal is to characterize the biophysical properties of NanC and determine the baseline
experimental conditions necessary for the measurement of transport of Neu5Ac in bilayer setups.
We seek biophysical conditions that produce biological transport. We determine the ionic
conditions suitable for single channel measurements of NanC in an artificial lipid bilayer and
then measure the ion selectivity and conductance of the channel. Many years of experience with
single channel recording (Miller 1986; Sakmann and Neher 1995) demonstrate the need for care
and calibration if results of biological importance are to be reproducible in many laboratories.
8 specialized hands-on training in electrophysiology. In our case, detailed analysis was necessary
to show that buffers used widely, if not universally in biochemical experiments interfere with the
function of NanC. Buffers can block the channel. A suitable baseline solution for NanC is
250mM KCl adjusted to pH 7.0 without buffer. An unexpected artifact was a significant
impediment to our work and is emphasized here because private discussions show this to be a
widespread (but not understood) problem: TRIS in the baths reacts with Ag/AgCl electrodes
9 MATERIALS AND METHODS
NanC expression and purification
NanC was expressed in BL21/Omp8 strains and purified as reported previously (Wirth et al.
2009). After cell disruption, the whole membranes were pelleted by ultracentrifugation (1h at
100000g). The inner membrane was solubilized using 1% Lauroyl sarcosine and the remaining
outer-membrane was collected by ultracentrifugation. NanC protein was solubilized from the
membrane by iterative extractions using increasing concentrations of Octylpolyoxyethylene
(OPOE). NanC was then purified using anion — followed by cation — exchange
chromatography. A final size exclusion chromatography (Superdex75, GE healthcare) allowed
exchanging the buffer to 10mM Tris pH 8.0, 150mM NaCl and 1% OPOE in which the protein
was stored.
Electrophysiology Chemicals and Solutions
Chemicals were purchased from Sigma-Aldrich and Fisher Scientific. The lipid cocktail
solution (DOPE: DOPC) used for bilayer experiments was from Avanti Polar Lipids. The salt
solutions used (with or without pH buffers) were adjusted to pH 7.4 or 7.0. The pH of the salt
solution was monitored carefully by checking the pH at the beginning as well as at the end of the
experiment. In case of salt solutions (without buffer) no significant drift in pH was noticed.
Planar Lipid Bilayer Experiments
Electrophysiological measurements of current flow through the channel proteins can be
made either by the patch-clamp or the planar lipid bilayer method (Boulton et al. 1995;
Molleman 2003; Miller 1986; Sattelle 1993; Tien and Ottova-Lietmannova 2003). In the planar
10 carried out in an artificial lipid membrane with proteins reconstituted into the bilayer. In the
patch-clamp method (Neher and Sakmann 1976; Hamill et al. 1981), measurements are
conducted in native cell membranes. Both methods are widely used for single channel
measurements (Colquhoun and Sigworth 1983; Sakmann and Neher 1995).
We use the planar lipid bilayer method to measure the functional properties of purified
channel protein NanC. We reconstitute a single NanC into a preformed lipid bilayer in a set-up
shown in Figure 1. We show in Figure 1 the main components of the bilayer set-up used. The
bilayer set-up consists of a chamber and a Delrin cup that are filled with aqueous solutions. A
magnetic stirrer driven by batteries is used for stirring the solutions.
We use the painted technique to form the planar lipid bilayer. In this method lipid bilayer
is formed by painting a lipid solution across a 150m m diameter aperture in the cup. The stability
of the lipid bilayer is increased if the aperture is pretreated (‘primed’) with the lipid solution
before the bilayer is formed.
The lipid solution is made of phospholipids DOPE: DOPC in a 4:1 ratio (v/v) dissolved
in solvent n-decane (10 mg/ml). The solvent orients the monolayers of lipids to form a bilayer.
Initially, a thick film of lipid solution is formed that eventually thins out as the solvent
evaporates and a lipid bilayer is obtained. A ‘healthy’ (presumably thin) lipid bilayer is essential
to ensure the incorporation of the protein. Membrane thickness is measured by membrane
capacitance. In our set-up, the electrical capacitance of a ‘healthy’ lipid bilayer is 60pF-80pF
with a specific capacity of ~ 0.4-0.6 µF per cm2.
Membrane proteins are reconstituted into the bilayer in different ways depending on their
water solubility. We used direct fusion to reconstitute a single NanC into the lipid bilayer. Note
11 solution to make a soluble mixture of protein and detergent. The effect of the detergent on
protein function must be checked, in every case. We use a stock solution of ~ 1.1mg/ml of the
purified NanC in 150 mM NaCl, 10 mM Tris, pH 8.0 containing 1 %( v/v) n-OPOE detergent.
We add ~0.1-0.2 ml of the stock solution to the cis or ground side of a stirred solution to
reconstitute NanC. The ground side is the side of the bilayer connected through a bath electrode
to zero (ground or earth potential).
In our set-up Ag/AgCl electrodes are used to connect (1) the solutions in the cis
compartment to ground and (2) the trans compartment (the voltage side of the bilayer) to the
patch clamp amplifier. Ag/AgCl electrodes are stable, robust and the most commonly used
electrodes in electrophysiology but they respond to the activity of Cl¯. They respond to Cl¯
concentration as well as electrical potential, approximately as described by the classical Nernst
equation of electrochemistry (Bard and Faulkner 2000). The Ag/AgCl electrodes are isolated
from bathing solutions by Agar bridges (2%) containing (typically) 3M KCl. The 3M KCl
provides a fixed stable Cl¯ concentration to the Ag/AgCl wire so the electrode potential is stable
and minimal. The changes in electrical potential in the wire are produced by changes in the
electrical potential in the surrounding solution, not by changes in the activity of Cl¯ because the
chloride concentration is constant in this setup. A so called liquid junction potential (LJP)
appears of course at the interface of the 3 M KCl Agar with the bath solutions. This potential is
small because the mobility of K+ and Cl¯ are nearly equal. We determined the LJP from the
Junction Potential Calculator (JPCalcW) made available by Molecular Devices, Inc. with their
PClamp package (Barry 1994, 1996-2009) based on the publications (Barry and Diamond 1970;
Barry 1989; Barry 1994). The range of LJP under the ionic conditions we used for the reversal
12 JPCalcW is based on the reduced models of liquid junction potentials that uses the generalized
Henderson liquid junction potential equation (Bard and Faulkner 2000; Barry and Diamond
1970; Barry 1989; Barry and Lynch 1991; Morf 1981; Amman 1986). This equation is not
customarily derived by mathematics from the appropriate description of nonideal solutions
(necessary when salt concentrations are high as they are in and near the salt bridge). We look
forward to such derivations in the future. The Agar bridge has the further advantage that it keeps
Ag+ ions away from the bilayer and reconstituted channel. Ag+ ions can be toxic (i.e., produce
irreversible changes) to channels in very low concentrations.
Pulse Protocol and Data Analysis
Conductance is determined from measurements of current through a fully open single
channel. The recording voltage pulse protocols used throughout the paper for the single channel
measurements of NanC in lipid bilayer are shown in Figure 2. There are two main kinds: the
step pulse protocol (A and B) and the ramp protocol (C and D). In step pulse protocols, the
recordings are made at a fixed voltage i.e., ±100 mV, ±150 mV etc. for a definite time interval
for example, 3 seconds or 10 seconds. The amplitude of the single channel current and the
probabilities that the channel is open or closed are measured as the potential is stepped from one
value to another. However, the channel follows a ramp time course. In the ramp pulse protocol
the recordings are made for a range of voltages where the channel is expected to be mostly open,
for example, from + 100 mV to – 100 mV. We thus capture current through a single fully open
channel. The duration of the voltage ramp is ~ 2 seconds.
The data being recorded is low-pass filtered at 2 kHz using the built-in analog low-pass
Bessel filter in the Axopatch 200B amplifier (Molecular Devices, Inc.) and is sampled or
13 Bessel filter) implies is needed to avoid aliasing. After the recording, the recorded data is filtered
digitally (at 300/500 Hz) for further analysis using the low pass 8-pole digital Bessel filter in the
PClamp software, version 10 Molecular Devices, Inc.
Leakage subtraction and offset current correction
There are two main corrections performed on the recorded single channel current-voltage traces
after the digital filtering: leakage subtraction and offset current correction.
Leakage subtraction
Before the addition of protein sample, the control or the baseline current (Figure 3B) is
measured in response to the same voltage (ramp and step) pulse protocol in the same ionic
conditions as the experimental recordings.
Leakage is defined as the current that or flows (‘leaks’) through the lipid bilayer without
going through a channel and is measured as the conductance of the control or the baseline
current trace. The leakage conductance is determined by estimating the slope of the baseline
current trace recorded for the same voltage waveform that is applied while measuring the
corresponding single channel current recordings, for example, a definite voltage in case of step
pulse protocol or over a range of voltages for the ramp protocol.
The single channel current-voltage recordings are (accordingly) corrected for leakage by
subtracting the corresponding measured leakage conductance from the filtered single channel
current traces. This procedure is necessary in case the leakage conductance has nonlinear, ion
dependent, and/or time dependent behavior as is often the case.
Offset current correction
Under symmetric ionic conditions, i.e., when equal concentrations of ions are present on
14 equal to zero at 0 mV because the system is passive. However, under experimental situations
various asymmetries in apparatus usually drive a finite current even when the baths are identical.
Current offset is this ‘residual’ current that flows through the single channel in bilayer at 0 mV
under symmetric ionic conditions, i.e., with the same solution on both sides of the channel.
Under symmetric ionic conditions, the single channel current-voltage recordings are corrected
for current offset (that arises from external artifactual sources) by subtracting the corresponding
measured residual current from the filtered single channel current traces.
However, under asymmetric ionic conditions—i.e., when unequal amount of ions are
present on both sides of the bilayer—the offset current is determined from the control or the
baseline current that is measured before the channel protein is incorporated. The offset current
under asymmetric ionic conditions contains the artifactual offset current already described. It
also contains a diffusive current that flows through the leakage conductance due to the ionic
gradient across the lipid bilayer and leakage conductance. The single channel current-voltage
recordings under asymmetric ionic conditions are accordingly corrected for current offset by
subtracting the corresponding measured diffusive current from the filtered single channel current
traces.
Terminology
The potential difference (V) is defined as,V V= trans -Vcis where cis represents the ground
side of the chamber and trans is where we apply the voltage. A positive (outward) current (I) is
defined as a flux of positive charge from trans to cis.
The measurement of reversal potential Vrev determines the ion selectivity of the channel in
a predefined ionic gradient. The measured Vrev is corrected for measured liquid junction
15 the Junction Potential Calculator (JPCalcW) made available by Molecular Devices, Inc. with
their PClamp package (Barry 1994, 1996-2009) based on publications (Barry and Diamond
1970; Barry 1989; Barry 1994). This admirable software is itself based on the classical
Henderson equations which are not consistent with the Poisson equation of electrostatics, as they
should be, as we have mentioned previously. Fortunately, the corrections are small (0.7 mV to
-1.2 mV, see Table 1) so errors in the correction itself are insignificant in the present case.
Conductance is defined as the slope conductance of the fully open single channel in
presence of equal concentration of ions on both sides of the bilayer measured over a 60 mV
16 RESULTS
We have investigated the function of a single channel protein NanC in an artificial lipid
bilayer using the planar lipid bilayer technique in order to identify appropriate ionic conditions
that will permit study of the biological role of NanC in the transport of Neu5Ac across the
outer-membrane of E. coli (Condemine et al. 2005; Wirth et al. 2009).
We first designed experiments that would reproduce the single channel measurements of
NanC reported by Condemine et al. 2005. In these experiments we measured single channel
current and unit slope conductance in presence of symmetric i.e., equal ion concentration on both
sides of the bilayer, 500 mM KCl, 20 mM HEPES, pH 7.4 at various applied step voltages ±100
mV and ±200 mV and ramp voltage as shown in Figures 3, 4, and 5 respectively.
NanC has voltage-dependent gating (Figures 3 and 4). NanC is mostly open at voltages ≤ 100 mV and closed at voltages ≥ 200 mV in bilayer. Single channel current amplitudes shown
were determined from analysis of amplitude histograms.
NanC has a large unit (slope) conductance. We measured the unit slope conductance
following the sequence of steps as shown in Figure 5. First, the ‘baseline’ current (as shown in B) was measured. We measured the current in response to the voltage ramp pulse protocol shown
in A before a channel was reconstituted into the lipid bilayer. The current measured through the
reconstituted single channel NanC in bilayer is shown in C. The offset and the leakage current
correction were carried out as described in the Methods section and the resulting single channel
current-voltage trace is shown in D. The unit conductance was determined from the slope
measured in the voltage-range between the dashed lines.
During these experiments we found that NanC operated in two-modes. In the first mode,
17 mode, NanC exhibited two distinct open states that we called sub-conductance states and one
closed state. In Figure 6 we have shown the two distinct sub-conductance levels. The
corresponding amplitudes at ±100 mV were determined from the amplitude histograms. The
distinct sub-conductance levels were not observed in the first mode, see Figure 3. These
sub-conductance states were not induced by the ionic conditions present. They were found in the
presence of buffer—for example, HEPES/Phosphate—or without buffer and they were found at
high salt concentration. Note that the second mode of NanC occurred in only a small fraction of
experiments. We report it nonetheless because it was observed many times. These observations
indicate that native Nanc has both modes of operation.
The next step was to search for ionic conditions that would permit us to study Neu5Ac
transport through NanC. While looking for these experimental conditions, we found that HEPES
buffer interfered with the function of NanC and decreased the ionic current carried by NanC as
shown Figure 7. This results was expected because the NanC structure reported in the Protein Data Bank (PDB code: 2WJR ) contains two HEPES molecules bound to the channel. HEPES
reduced the single channel conductance of NanC significantly. Similar blocking action of
HEPES had been observed earlier in other anion channels as well (Yamamoto and Suzuki 1987;
Hanrahan and Tabcharani 1990). In biological cells HEPES is not found and so its effects should
not be the focus of physiological attention. However, the native functional properties of NanC
need to be investigated experimentally without HEPES.
We explored using alternative pH buffers instead of HEPES since we did not wish to
study a blocked channel. We found that the (classical inorganic) phosphate buffer (a commonly
used buffer in electrophysiology experiments of anion channels) interfered with the channel’s
18 the negatively charged phosphate. There was a 19% drop in unitary ionic conductance of NanC
when phosphate concentration was increased from 0 mM (114.096 ± 4.16 pS, N=12, control) to
5 mM (92.07 ± 0.657 pS, N=11) in 250 mM KCl, pH 8.0, where N is the number of
measurements.
The effect of phosphate buffer on the ionic current carried by a unit NanC in bilayer
appeared to be less dramatic than HEPES. In comparison to the control experiment (250 mM
KCl, pH 7.0 without buffer) the presence of 5 mM HEPES in 250 mM KCl at pH 7.4 (70.70 ±
5.17 pS, N=15) resulted in 38 % drop whereas the same amount of phosphate resulted in 19%
drop in unit ionic conductance of NanC. We thus report that these commonly used pH buffers
(HEPES and phosphate) significantly affect the functional behavior of a unit NanC in bilayer.
Therefore these pH buffers (HEPES as well as phosphate) are not recommended to be used in
salt solutions while studying the native functional properties of NanC at single channel level.
TRIS (another commonly used buffer) damaged the Ag/AgCl electrodes in our set-up,
even though the electrodes were separated from the buffer by an Agar/KCl bridge. The action of
TRIS on the Ag/AgCl electrodes even in presence of Agar/KCl bridges was puzzling and did not
result in any interpretable measurements.
Therefore, we decided to study NanC (conductance vs. concentration and ionic
selectivity) in ionic solutions that were adjusted to pH 7.0 but without using a pH buffer. This
was the only way we could study a channel that was not blocked, assuming of course that the
~10-7M hydroxyl ion present in water at pH 7.0 did not itself block.
We first measured the single channel current-voltage behavior of NanC in a range of KCl
concentration solutions (100 mM – 3 M) without any buffer as shown in Figure 8. We observed
19 We chose 250 mM for further experiments since at larger salt concentrations (≥ 500 mM)
screening is large enough to change the net charge of the ‘pore’ region and the function of NanC.
We further measured the reversal potential shown in Figure 9 to determine the ion selectivity of a single NanC in the bilayer. We anticipated selectivity for anions since the crystal
structure of NanC showed two tracks of positively charged residues in the pore region. The
Nernst potential gives a measure of the gradient of chemical potential. If NanC were a cation
channel, then Vrev = EK. If NanC were an anion channel, then Vrev = ECl-. The negative direction
of current at 0 mV and the measured value of the Vrev (close to ECl- ) indicated that NanC was an
anion channel. It was more permeable for the anion Cl- than the cation K+. The reversal
20 DISCUSSION
Single channel bilayer experiments of NanC are feasible using standard methods
implemented carefully and can be done with high ‘yield’ in many conditions. The experiments
show the biophysical properties of ion selectivity, conductance and gating. NanC functions as a
monomer, exhibits large conductance, anion selectivity and has two distinct modes of function
(with or without sub-states).
The interactions of the commonly used pH buffers in electrophysiology experiments
(HEPES, phosphate and TRIS) with NanC are interesting. HEPES binds to the pore region (as
seen in the crystal structure) and actually decreases the ionic current carried by a single NanC in
bilayer. Phosphate buffer decreases the unit ionic conductance of NanC. The negatively charged
phosphate ions seem to compete with the chloride ions resulting in a significant drop in unit ionic
conductance. TRIS damages the electrodes even when salt bridges are present making
impossible to record single channel currents.
The measurements that we report here are thus carried out in ionic solutions adjusted to
neutral pH without any buffer. We have been careful to measure the pH of the ionic solutions
before and at the end of the experiment to be sure that the pH has not drifted. We found no drift
and so we can carry out the measurements of biological function of NanC without buffer. We
can measure Neu5Ac transport in salt solutions at concentration around 250 mM, pH 7.0.
Future work would benefit from the discovery of pH buffers that does not modify NanC’s
21 ACKNOWLEDGEMENTS
We thank Tilman Schirmer for sharing with us his experience and insight on porins and proteins.
We are grateful for continual discussions with Tilman, Dirk Gillespie, Dezső Boda, and Jim
Fonseca. Dr. Guy Condemine was most generous in providing materials and welcoming us in
22 FIGURES
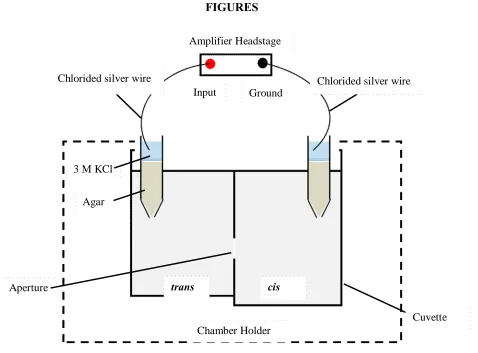
Figure 1 Bilayer Setup for single channel measurements: The cis (ground) and trans (voltage) compartments are filled with aqueous salt solutions. The chlorided silver (Ag/AgCl) wires are the electrodes connecting the baths via Agar-KCl salt bridges. An artificial lipid bilayer is painted over the aperture. The voltage applied across the lipid membrane is Vm = Vtrans- Vcis. Protein solution (~0.1-0.2 µl) is added to the cis compartment and stirred for initiating the incorporation of a single channel into the bilayer.
trans cis
Chamber Holder Input Ground
Chlorided silver wire Chlorided silver wire
3 M KCl
Agar
Aperture
23
D
Figure 2 Recording pulse protocols used throughout single channel NanC conductance and selectivity measurements. A. Positive step voltage protocol where voltage is stepped up from 0 mV to + 100 mV after ~ 1 second and stepped back to 0 mV after 4 seconds. Similar protocols designed for voltages +150 mV and + 200 mV. B. Negative step voltage protocol where voltage is stepped down from 0 mV to - 100 mV after ~ 1 second and set back to 0 mV after 4 seconds. Similar protocols designed for voltages -150 mV and -200 mV. C. Ramp voltage protocol where voltage is stepped down from 0 mV to - 100 mV after ~ 1 second. Voltage stays at -100 mV for 1 second and then ramped to + 100 mV for ~ 2 seconds staying at + 100 mV for 1 second before being set back to 0 mV. D. Ramp voltage protocol where voltage is stepped down from 0 mV to - 100 mV after ~ 1 second. Voltage stays at -100 mV for 2 seconds and then ramped to + 100 mV for ~ 2 seconds staying at + 100 mV for 2 seconds before being set back to 0 mV.
0 mV 0 mV
+ 100 mV 0 mV
- 100 mV
+ 100 mV
0 mV 0 mV
- 100 mV 0 mV
A
B
C D
0 mV
+ 100 mV
- 100 mV
24
[image:24.612.47.546.73.438.2]
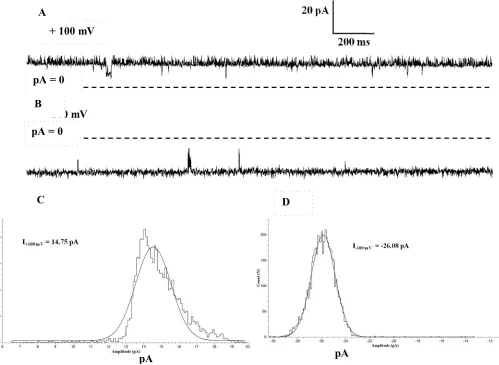
Figure 3 Single channel current of NanC in bilayer in the presence of symmetric 500 mM KCl, 20 mM HEPES, pH 7.4 shown at step voltages of + 100 mV shown in A and -100 mV in B, respectively. Dashed lines represent the zero current level. The corresponding single channel amplitudes are 14.75 pA at + 100 mV and -26.08 pA at -100 mV determined from amplitude histogram analysis shown in C and D respectively. In bilayer at +/-100 mV step voltages single channel NanC is mostly open and exhibits asymmetric (non-equal) conductances.
pA pA
+ 100 mV
- 100 mV A
B
C D
pA = 0
25
pA = 0
pA = 0
open
closed
open
closed + 200 mV
- 200 mV A
[image:25.612.72.539.101.383.2]B
26
A
B
27
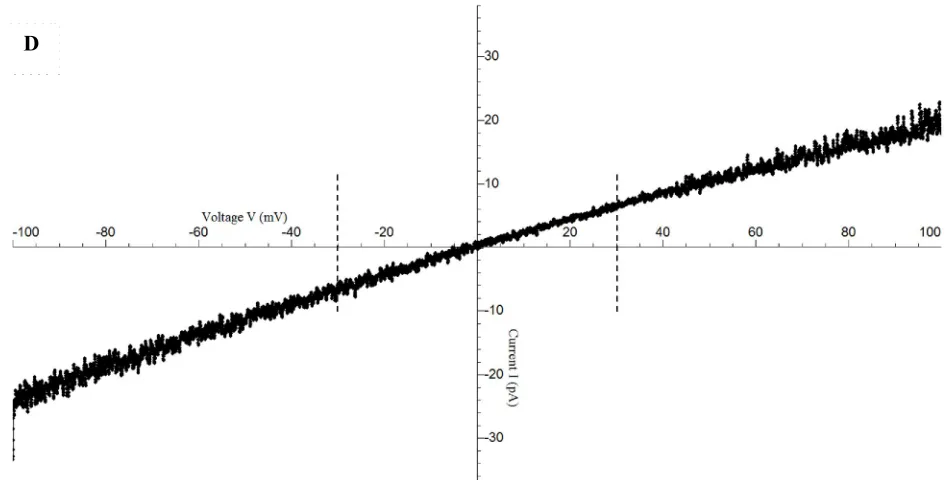
[image:27.612.79.553.83.323.2]D
Figure 5 Measurement of single channel slope conductance of NanC in lipid bilayer. A. Ramp voltage pulse protocol. Voltage is stepped down from 0 mV to 100 mV after ~ 1 second. Voltage stays at -100 mV for 1 second and then ramped to + -100 mV for ~ 2 seconds staying at + -100 mV for 1 second before being set back to 0 mV. B. Baseline current recorded in response to the ramp voltage pulse protocol as shown in A, through the lipid bilayer before the channel reconstitutes in symmetric (i.e. same ionic conditions in cis and trans) 500 mM KCl, 20 mM HEPES, pH 7.4. Baseline current trace filtered digitally at 300 Hz is shown. C. Single channel current recorded as NanC reconstitutes in the lipid bilayer. Single channel current trace filtered digitally at 300 Hz is shown. D. Single channel current (I) –voltage (V) trace shown after correction for leakage and offset currents following the procedure as mentioned in the Methods section. Dashed lines represent the -30 mV to + 30 mV range chosen for determining the slope conductance given as g (nS) = Δ I (pA)
28
Figure 6 The two distinctsub-conductance states of single channel NanC in bilayer shown in symmetric 250 mM KCl, pH 7.0 at + and – 100 mV voltages in A and B respectively. The amplitudes of the two current levels shown in C and D are determined from the amplitude histogram analysis of the traces in A and B. Percentage values in parenthesis denote the probability the channel stays in the corresponding level for the duration the measurement is carried out. Sub-conductance states are native to the NanC and not induced by the experimental conditions i.e. in presence of buffer for example, HEPES/Phosphate or without buffer and high salt concentration. The occurrence of sub-conductance states is not so often (~ < 5 %). The current traces shown are filtered digitally at 500 Hz. Dashed lines represent the zero current level.
+ 100 mV
- 100 mV A
B
pA = 0
pA = 0
level 1
level 2 level 2 level 1
C D
level 2 level 1
6.6 pA (75 %)
11 pA (25 %) level 2 level 1
-15 pA (30%)
-10 pA (70%)
29
A
30
+ 200 mV C (i)
C (ii)
pA = 0
pA = 0
- 200 mV
D (i)
+ 200 mV
- 200 mV D (ii)
[image:30.612.69.484.88.452.2]pA = 0 pA = 0
31
A
32
33
Figure 9 Measurement of reversal potential of single NanC in bilayer in presence of 250 mM KCl (cis) and 3 M KCl (trans) shown. The calculated Nernst potentials EK and ECl are compared to the measured Vrev. At 0 mV, the current is negative and V*rev (corrected for liquid junction potential (LJP)) is close to ECl because NanC is anion selective. The current trace shown is filtered digitally at 300 Hz.
34 Experiment cis (ground)
KCl (mM)
trans (voltage) KCl (mM)
LJP (mV)
E Cl- (mV)
E K+ (mV)
Vrev *(mV)
1 250 1000 -0.7 + 35 -35 + 15.89±1.01
(N = 2)
2 250 3000 -1.2 + 63 -63 + 28.31±0.37
[image:34.612.67.565.59.187.2](N = 9)
Table 1 Measurement of ion selectivity of single NanC in bilayer. Reversal potential Vrev measured in presence
of ionic gradient in cis (250 mM KCl, pH 7.0) and trans (1 M/ 3 M KCl, pH 7.0) compartments compared to the calculated Nernst potentials EK+ and ECl- under those conditions. The measured Vrev indicates the anion
35 REFERENCES
Achouak W, Heulin T, Pagees JM (2001) Multiple facets of bacterial porins. FEMS Microbiol Lett 199:1-7
Amman D (1986) Ion-selective Microelectrodes. Springer-Verlag, Berlin
Bard AJ, Faulkner LR (2000) Electrochemical Methods: Fundamentals and Applications. 2 edn. John Wiley & Sons, New York
Barry PH (1989) Permeation mechanisms in epithelia: Biionic potentials, dilution potentials, conductances and streming potentials. In: Methods in Enzymology, Biomembranes, Part M : Biological Transport, vol 171. pp 678-715
Barry PH (1994) JPCalc, a software package for calculating liquid junction potential corrections in patch-clamp, intracellular, epithelial and bilayer measurements and for correcting junction potential measurements. Journal of Neuroscience Methods 51 (1):107-116
Barry PH (1996-2009) JPCalc for Windows (JPCalcW) Junction Potential Calculator Users’ Manual. http://web.med.unsw.edu.au/phbsoft/JPCalcWManual-web-2009.pdf.
Barry PH, Diamond JM (1970) Junction potential, electrode standard potentials, and other problems in interpreting electrical properties of membranes. Journal of Membrane Biology 3:931-122
Barry PH, Lynch JW (1991) Topical Review: Liquid junction potentials and small cell effects in patch clamp analysis. Journal of Membrane Biology 121:101-117
Baslé A, Rummel G, Storici P, Rosenbusch JP, T. S (2006) Crystal structure of osmoporin OmpC from E. coli at 2.0 A. J Mol Biol 362 (5):933-942
Bayley H (2005) Engineered Nanopores. In: Niemeyer CM, Mirkin CA (eds) NanoBiotechnology. Wiley-VCH, Weinheim,
Benz R (ed) (2004) Bacterial and Eukaryotic Porins: Structure, Function, Mechanism. Wiley-Vch,
Benz R, Schmid A, Vos-Scheperkeuter GH (1987) Mechanism of sugar transport through the sugar-specific LamB channel of Escherichia coli outer membrane. J Membr Biol 100 (1):21-29 Boulton AA, Baker GB, Walz W (eds) (1995) Patch Clamp Applications and Protocols. Humana Press, Totowa, NJ
Buchanan SK (1999) Beta Barrel proteins from bacterial outer membranes: structure, function and refolding. Curr Opin Struct Biol 9:455-461
Chazalviel J-N (1999) Coulomb Screening by Mobile Charges. Birkhäuser, New York
Colquhoun D, Sigworth FJ (1983) Single-Channel Recording. Plenum Press, New York, New York
Comb DG, Roseman S (1960) I. The structure and enzymatic synthesis of N-acetylneuraminic acid. The Journal of Biological Chemistry 235 (9):2529-2537
Condemine G, Berrier C, Plumbridge J, Ghazi A (2005) Function and expression of an N-acetylneuraminic acid-inducible outer membrane channel in Escherichia coli. J Bacteriol 187 (6):1959-1965. doi:187/6/1959 [pii]
10.1128/JB.187.6.1959-1965.2005
36 Cowan SW, Schirmer T, Rummel G, Steiert M, Ghosh R, Pauptit RA, Jansonius JN, Rosenbusch JP (1992) Crystal structures explain functional properties of two E coli porins. Nature 358:727-733.
Delcour AH (1997) Function and modulation of bacterial porins: insights from electrophysiology. FEMS Microbiology Letters 151 (2):115-123
Delcour AH (2003) Solute uptake through general porins. Front Biosci 8:1055-1071
Eisenman G, Horn R (1983) Ionic selectivity revisited: The role of kinetic and equilibrium processes in ion permeation through channels. J Membrane Biology 76:197-225
Eisenman G, Sandblom JP, Walker JL, Jr. (1967) Membrane structure and ion permeation. Study of ion exchange membrane structure and function is relevant to analysis of biological ion permeation. Science 155 (765):965-974
Garavito RM, Rosenbusch JP (1980) Three-dimensional crystals of an integral membrane protein: an initial X-ray analysis. J Cell Biol 86 (327-329)
Hamill OP, Marty A, Neher E, Sakmann B, Sigworth FJ (1981) Improved patch-clamp techniques for high-resolution current recording from cells and cell-free membrane patches. Pflugers Arch 391 (2):85-100
Hanrahan JW, Tabcharani JA (1990) Inhibition of outwardly rectifying anion channel by HEPES and related buffers. Journal of Membrane Biology 116:65-77
Helfferich F (1962) Ion Exchange. McGraw Hill, New York
Karreman G, Eisenman G (1962) Electrical potentials and ionic fluxes in ion exchangers. I. "n Type" non-ideal systems with zero current. Bull Math Biophys 24:413-427
Koronakis V, Scharrf A, Koronakis E, Luisi B, Hughes C (2000) Crystal structure of the bacterial membrane protein TolC central to mutlidrug efflux and protein export. Nature 405:914-919
Miedema H, Meter-Arkema A, Wierenga J, Tang J, Eisenberg B, Nonner W, Hektor H, Gillespie D, Meijberg W (2004) Permeation properties of an engineered bacterial OmpF porin containing the EEEE-locus of Ca2+ channels. Biophys J 87 (5):3137-3147. doi:10.1529/biophysj.104.041384
S0006-3495(04)73783-2 [pii]
Miedema H, Vrouenraets M, Wierenga J, Meijberg W, Robillard G, Eisenberg B (2007) A Biological Porin Engineered into a Molecular, Nanofluidic Diode. Nano Lett 7 (9):2886-2891 Miller C (ed) (1986) Ion Channel Reconstitution. Plenum Press, New York
Molleman A (2003) Patch Clamping: An Introductory Guide to Patch Clamp Electrophysiology. Wiley,
Morf WE (1981) The Principles of Ion-Selective Electrodes and of Membrane Transport. Elsevier, Amsterdam, New York
Mueller P, Rudin DO, Ti Tien H, Wescott WO (1962) Reconstitution of cell membrane structure
in vitro and its transformation into an excitable system. Nature 194:979-980
Nakae T (1976) Identification of the outer membrane protein of E. coli that produces transmembrane channels in reconstituted vesicle membranes. Biochemical and Biophysical Research Communications 71 (3):877-884
Neher E, Sakmann B (1976) Single channel currents recorded from the membrane of denervated muscle fibers. Nature 260:799-802
37 Nikaido H (2003) Molecular basis of bacterial outer membrane permeability revisited. Microbiology and Molecular Biology Reviews 67 (4):593-656
Sakmann B, Neher E (1995) Single Channel Recording. Second edn. Plenum, New York
Sattelle DB (ed) (1993) Planar Lipid Bilayers-Methods and Applications. Biological Techniques Series. Academic Press Harcourt Brace and Company,
Schirmer T (1998) General and specific porins from bacterial outer membranes. Journal of Structural Biology 121:101-109
Schirmer T, Keller TA, Wang YF, Rosenbusch JP (1995) Structural basis for sugar translocation through maltoporin channels at 3.1Å resolution. Science 267:512-514
Schulz GE (2000) Beta-Barrel membrane proteins. Curr Opin Struct Biol 10:443-447
Severi E, Hood DW, Thomas GH (2007) Sialic acid utilization by bacterial pathogens. Microbiology 153:2817-2822
Teorell T (1953) Transport processes and electrical phenomena in ionic membrane. Progress in Biophysics and Molecular Biology 3:305-369
Tien HT, Ottova-Lietmannova A (eds) (2003) Membrane Science and Technology Series. Planar Lipid Bilayers (BLMs) and Their Applications, vol 7. Elsevier,
Vimr ER, Kalivoda KA, L. DE, Steenbergen SM (2004) Diversity of microbial sialic acid metabolism. Microbiol and Mol Bio Rev 68 (1):132-153
Vrouenraets M, Wierenga J, Meijberg W, Miedema H (2006) Chemical modification of the bacterial porin OmpF: gain of selectivity by volume reduction. Biophys J 90 (4):1202-1211 Walker JL, Jr., Eisenman G (1966) A test of the theory of the steady state properties of a liquid ion exchange membrane. Ann N Y Acad Sci 137 (2):777-791
Wandersman C, Schwartz M (1982) Mutations that alter the transport function of the LamB protein in Escherichia coli. J Bacteriol 151 (1):15-21
Wirth C, Condemine G, Boiteux C, Berneche S, Schirmer T, Peneff CM (2009) NanC crystal structure, a model for outer-membrane channels of the acidic sugar-specific KdgM porin family. J Mol Biol 394 (4):718-731. doi:S0022-2836(09)01193-0 [pii]
10.1016/j.jmb.2009.09.054