COVER SHEET
NOTE:
Please attach the signed copyright release form at the end of your paper and upload as a single ‘pdf’ file
This coversheet is intended for you to list your article title and author(s) name only
This page will not appear in the book or on the CD-ROM
Title: A data mining tool for detecting and predicting abnormal behaviour of railway tunnels
Authors: 1Matteo Vagnoli,
1Rasa Remenyte-Prescott, 2Daniel Thompson, 1John Andrews, 2Paul Clarke, 2Neil Atkinson
**IMPORTANT** All authors' information will appear on the program according to the submission stub on the online submission system (not to the manuscript). The title and author list provided in the manuscript will be for future referencing and citation.
PAPER DEADLINE: **May 15, 2017**
PAPER LENGTH: **8 PAGES MAXIMUM **
Please submit your paper in PDF format. We encourage you to read attached Guidelines prior to preparing your paper—this will ensure your paper is consistent with the format of the articles in the CD-ROM.
--
NOTE: Sample guidelines are shown with the correct margins. Follow the style from these guidelines for your page format.
Hardcopy submission: Pages can be output on a high-grade white bond paper with adherence to the specified margins (8.5 x 11 inch paper). Please number your pages in light pencil or non-photo blue pencil at the bottom.
_____________________
1Resilience Engineering Research Group, the University of Nottingham, Science
Road, University Park, NG7 2RD, Nottingham, United Kingdom
2Instrumentation and Monitoring, AECOM Infrastructure and Environment UK
Ltd., 12 Regan Way, Chetwynd Business Park, Chillwell, Nottingham, NG9 6RZ (FIRST PAGE OF ARTICLE)
ABSTRACT
The UK railway network is subjected to an electrification process that aims to electrify most of the network by 2020. This upgrade will improve the capacity, reliability and efficiency of the transportation system by providing cleaner, quicker and more comfortable trains. During this process, railway infrastructures, such as tunnels, require to be adapted in order to provide the necessary clearance for the overhead line equipment, and consequently, a rigorous real-time health monitoring programme is needed to assure safety of workforce. Large amounts of data are generated by the real-time monitoring system, and automated data mining tools are then required to process this data accurately and quickly. Particularly, if an unexpected behaviour of the tunnel is identified, decision makers need to know: i) activities at the worksite at the time of movement occurring; ii) the predicted behaviour of the tunnel in the next few hours.
In this paper, we propose a data mining method which is able to automatically analyse the database of the real-time recorded displacements of the tunnel by detecting the unexpected tunnel behaviour. The proposed tool, first of all, relies on a step of data pre-processing, which is used to remove the measurement noise, followed by a feature definition and selection process, which aims to identify the unexpected critical behaviours of the tunnel. The most critical behaviours are then analysed by developing a change-point detection method, which detects precisely when the tunnel started to deviate from the predicted safe behaviour. Finally, an Artificial Neural Network (ANN) method is used to predict the future displacements of the tunnel by providing fast information to decision makers that can optimize the working schedule accordingly.
1. INTRODUCTION
In the 2009, the UK Government approved a new programme in order to upgrade the railway system of the country by planning the electrification of most of the UK railways [1]. Electric trains, indeed, provide a huge amount of benefits to both railway owner and passengers. For example, the former expects a reduction of maintenance activities due to less wear of the railway track caused by electric trains, which are lighter than diesel trains; the latter can provide a faster, cheaper and quieter service [2].
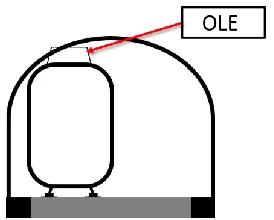
live conducting wires, insulators and supporting equipment [3], and the clearance required to install the 25 kV AC overhead system is not provided by the current infrastructure, including many bridges and tunnels. In the case of tunnels, the optimal way to provide the necessary clearance for the OLE is to lower the track to a new level by removing the track and ballast, excavating into the sub-formation and re-establishing the track [1].
During these works, a real-time Structural Health Monitoring (SHM) system is required in order to monitor the tunnel behaviour by ensuring the safety of the workforce and understanding whether the tunnel behaviours are within the predicted safety limits [4]. Furthermore, the electrification process is estimated to cost approximately 686k to 810k USD per track km [7], and the feasibility of future projects to upgrade the UK railway system is related to the cost effectiveness of the electrification process, by considering the overall cost of the works and the duration of service disruption [1]. Hence, the upgrade activities and their possible modifications should be scheduled in a safe and efficient way to complete the works on time by guaranteeing the safety of the workforce and asset. Although several long-term SHM systems for tunnel infrastructures are presented in literature [5], the aim is usually focused on the development of an optimal measurement system, therefore, a comprehensive analysis of the data, which can provide robust and unexpected information, by pointing out hidden vulnerabilities and abnormal behaviours, is needed to avoid or reduce emerging risks for the infrastructure and the workforce [6].
In this paper, we propose a data mining method to automatically analyse a database of real-time recorded displacements of a tunnel, which is subjected to the electrification process, with the aim of providing rapid information to decision makers. After a pre-processing step, that aims to remove the noise from the recorded displacement of the tunnel, a feature definition and selection process is proposed, using an iterative scheme to identify the different behaviours of the tunnel [8]. Then, the most critical behaviours are analysed by adopting a Cumulative Sum (CUSUM) change-point detection algorithm [9] to detect when the tunnel starts to deviate from the predicted safe behaviour and, consequently, to identify what kind of works are going on at that moment on the site. Finally, a prediction of the future displacements of the tunnel at the moment of the change-point is carried out by using an Artificial Neural Network (ANN) [10]. In this way, fast information is provided to decision makers that can optimize the working schedule accordingly.
The remainder of the paper is structured as follows: Section 2 describes the tunnel by presenting the working activities and the measurement system; Section 3 presents the proposed data mining tool, and its performance on the tunnel case study; Conclusion and future development are discussed in Section 4.
2. ELECTRIFICATION IN A TUNNEL
During these activities, AECOM was appointed by the railway owner to provide a real-time monitoring system of a tunnel in the south-west of England, with the aim of avoiding unacceptable risks to the structure or to the personnel working within the tunnel. The monitoring specification required the tunnel to be monitored in real-time. Convergence of the tunnel is quantified using 10 Shape Accel Array (SAA) sensors, which comprise 23 orthogonally aligned accelerometers, spaced at regular intervals along the tunnel section. SAA sensors are chosen due to their reliable readings and due to the fact that their low profile means that the SAA system can remain in place when the tunnel is operational. The frequency of interrogating the SAA is determined considering the type of the working activity carried out at the site.
Figure 1. Example of clearance problem.
3. DATA MINING METHOD
Large amounts of data are usually generated by this real-time monitoring system over time, and consequently a comprehensive analysis of the recorded data is needed in order to identify possible hidden abnormal trends of the displacements, and relationship between those abnormal events and the works. For these reasons, an automatic data mining method, which can innovatively and automatically analyse the whole database of the recorded displacements of the tunnel, by pointing out the exact moment when the tunnel started to show abnormal displacements, is hereafter proposed. The pre-processing of the data is performed to remove the noise from the recorded tunnel behaviours, and consequently the tunnel behaviours are clustered by using a K-means algorithm. The most critical cluster(s) is then analysed by a change-point detection algorithm in order to detect the exact moment when the tunnel started to show abnormal behaviours. Once this moment is identified, the decision makers need to know what kind of work was going on at the site, and, consequently, the actual activities are identified by automatically looking into the spreadsheets of the works. Finally, an ANN is trained to predict the future displacements of the tunnel at the location of the identified abnormal behaviour. The proposed method has been verified using the database of the all available data, i.e. the data provided by each SAA in the tunnel, however, without loss of generality, in what follows the results of the analysis of only one SAA are shown.
Data Pre-Processing
during the works. On the contrary, Figure 2(b) shows the same displacement after the pre-processing analysis was carried out: it should be noticed that the off-set at time 600 is corrected. Therefore, the real displacement of the tunnel, which is around -1.4mm, can be analysed.
Figure 2. Displacement before and after the pre-processing analysis.
Feature Definition and Clustering
The processed displacements are used as the input to a feature definition and selection process. Firstly, 11 statistical features (such as mean, standard deviation, kurtosis, skewness, etc.) are computed for each displacement pattern. Then, a group of features is randomly selected and used as input to a K-means algorithm that aims to identify clusters of different behaviours of the tunnel. The performance of the K-means clustering is evaluated by considering the Calinski-Harabasz (CH) index, which is expressed as the ratio of the between-cluster and the within cluster variance. The feature selection, followed by the K-means clustering, is iteratively repeated until the CH index is maximized, i.e. the most compact and separate clusters are identified.
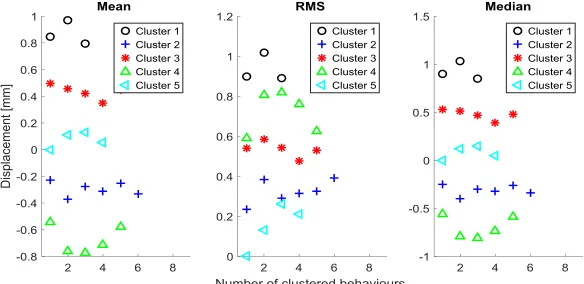
Figure 3 shows the optimal result of the feature selection process: three features (the mean value, the Root Mean Square (RMS) and the median of the displacements recorded by the SAA installed 40 meters into the tunnel, labelled as SAU0040) are selected as the features that provide the best clustering results in terms of compactness and separation of the clusters. Figure 3 depicts 5 clusters for each optimal feature that are well separated and compacted.
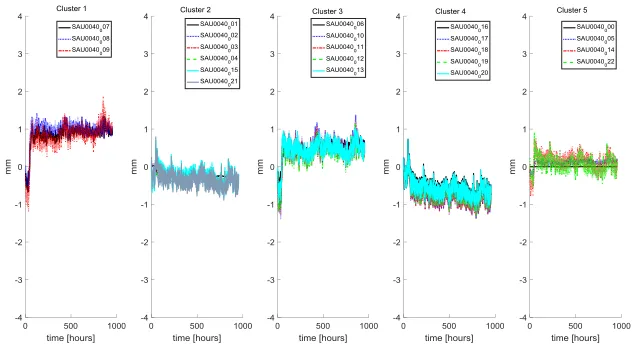
[image:5.612.160.452.555.697.2]The most critical clusters are the clusters with the highest mean and median value, i.e. cluster 1 and 3 (circles and stars in Figure 3). Indeed, the higher the displacement of the tunnel is, the riskier the activities inside the tunnel are. The behaviours belonging to each one of the 5 clusters are visualized in Figure 4. The behaviours of cluster 1 and 3 show an unexpected abrupt increase of the displacement (for example, the expected displacement increase is shown by clusters 2, 4 and 5) at the beginning of the working activities and the highest displacements values. Therefore, the decision maker needs to find out the time of occurrence and the reason of this sudden increase.
Figure 4. Clustering results of the displacements recorded by the shape array SAU0040.
Change-Point Detection and Working Activities Identification
The most critical clusters (1 and 3) are analysed by using a change-point detection algorithm in order to identify when the unexpected increase of the displacement occurred and, consequently, point out what kind of working activities were carried out in the tunnel at that time.
The change point detection method is based on the analysis of CUSUM charts of the recorded and randomly resampled displacement [8]. Given a recorded displacement pattern, X(t) = [X1, X2,…, Xn], where n is the size of the measured displacement, its CUSUM chart is developed by considering the cumulated difference between each value Xi of X(t) and the mean value of the displacement pattern, X̅:
displacement X(t) in two parts, one for each side of the identified change-point, and repeating the CUSUM analysis for each part.
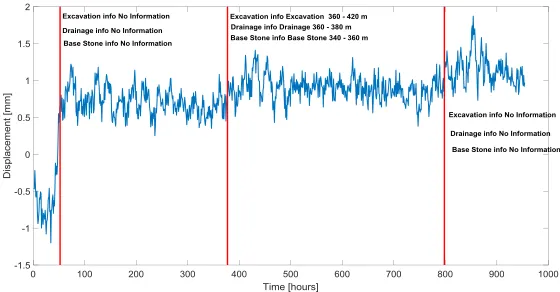
[image:7.612.175.442.162.314.2]Figure 5 depicts the results of the change-point detection algorithm for sensor 9 of the shape array SAU0040, which belongs to cluster 1 of Figure 4. The figure on the left hand side of Figure 5 shows the post-processed displacement recorded by the sensor, whilst the plot on the right hand side of Figure 5 depicts, by the means of vertical lines, the identified change-points at time 52, 377 and 798, respectively.
Figure 5. Change point detection of unexpected behaviours.
In order to identify the works that were carried out at the time of the change-points, the works spreadsheets are automatically investigated by the proposed method. Figure 6 illustrates the main activities that are reported on the spreadsheets for the moment of the change-points. For change-points at time 52 and 798 no information is provided on the spreadsheets. This lack of information is due to the use of hard copy spreadsheets that are transferred to an electronic version by the works contractor at a later date. For the change-point at time 377, 60 meters in length of tracks are being extracted, while the first 20 meters of this 60-meters section are being drained from the extra water. At the same time, the previous 20 meters are back-filled with new ballast.
Figure 6. Working activities information at the change-points.
Displacement Prediction Using ANN
[image:7.612.167.447.487.633.2]cost-effective way. Hence, an ANN is developed by considering the following architecture: two input nodes, eleven hidden nodes (which are defined by using a trial & error procedure) and one output node. For each shape array, an ANN is defined by considering the works and the displacement of a randomly sampled subset of sensors belonging to neighbouring shape arrays as training patterns.
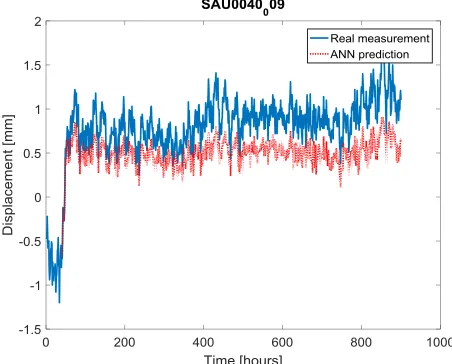
[image:8.612.193.419.359.541.2]For example, in the previous section it has been pointed out that sensor 9 of the shape array SAU0040 records a high unexpected behaviour of the tunnel at time 52. Consequently, the ANN can predict the future displacement of the tunnel in that location, by knowing the works that are carried out in the tunnel, and the displacement recorded by the sensor up to the time of the identified change-point. The dotted line in Figure 7 shows the prediction of the ANN, which is started at time 40 with the aim of verifying the ability of the ANN in predicting the change-point. The unexpected behaviour of the tunnel, i.e. the abrupt change-point at time 52, is predicted with good precision by the proposed ANN, however, a lower equilibrium level of the tunnel after the change-point is predicted by the ANN (the dotted line is in a lower than the solid line in Figure 7). The change-points at time 377 and 798 are not clearly pointed out by the ANN prediction. This prediction can be more accurate if more detailed information about the works are provided by the works contractor on time. Finally, relying on the information provided by the ANN, the decision maker can optimize the working schedule in a safe and cost-effective way to guarantee the safety of the tunnel and workers.
Figure 7. Artificial Neural Network prediction.
4. CONCLUSION
In this paper, an automatic data mining tool has been proposed by relying on an iterative feature selection problem followed by a change-point detection method. The optimal features have been identified efficiently by maximizing the performance of a K-means clustering in terms of compactness and separation of the clusters. The most critical clusters have been analysed by developing a CUSUM change-point detection method. The CUSUM method has shown good performance in detecting the time of the abrupt change of the displacements. The working activities that were going on at the site at the moment of the unexpected behaviour of the tunnel have been acknowledged, by looking into the spreadsheet of the works. Finally, an ANN has been proposed with the aim of predicting the abrupt change-points of the tunnel.
Even though the performance of the proposed data mining tool has been shown to be good, further improvements are needed to optimize the identification of the most critical clusters and the most dangerous change-point. Moreover, a more accurate prediction of the ANN can be achieved by optimizing the training process and diminishing the uncertainty of the recording process of works.
ACKNOWLEDGMENT
The authors gratefully thank AECOM for their contribution. This project has received funding from the European Union’s Horizon 2020 research and innovation programme under the Marie Skłodowska-Curie grant agreement No. 642453.
REFERENCES
1. Hooper, P.W.C., McCormack, L.M. 2010, Mainline electrification as part of the railway system, IET Seminar Digest, 2010 (13342), art. no. 20.
2. Alan Baxter 2015, Network Rail A Guide to Overhead Electrification, 132787-ALB-GUN-EOH-000001, February 2015 Rev 10.
3. Kilsby, P., Remenyte-Prescott, R., Andrews, J. 2017, A modelling approach for railway overhead line equipment asset management, Reliability Engineering and System Safety, http://dx.doi.org/10.1016/j.ress.2017.02.012.
4. Brownjohn, J.M.W. 2007, Structural health monitoring of civil infrastructure, Philosophical Transactions of the Royal Society A: Mathematical, Physical and Engineering Sciences, 365 (1851), pp. 589-622.
5. Wang B, Zhang Z, He C, Zheng H-l 2017, Implementation of a long-term monitoring approach for the operational safety of highway tunnel structures in a severely seismic area of China, Struct Control Health Monitoring, https://doi.org/10.1002/stc.1993.
6. Li, H.-N., Ren, L., Jia, Z.-G., Yi, T.-H., Li, D.-S. 2016, State-of-the-art in structural health monitoring of large and complex civil infrastructures, Journal of Civil Structural Health Monitoring, 6 (1), pp. 3-16.
7. Rails Safety & Standard Boards (RSSB), “T633: Study on further electrification of Britain’s railway network”, 2007.
8. Di Maio, F., Vagnoli, M., Zio, E. 2016, Transient identification by clustering based on Integrated Deterministic and Probabilistic Safety Analysis outcomes, Annals of Nuclear Energy, 87, pp. 217-227.
9. Carslaw, D.C., Ropkins, K., Bell, M.C. 2006, Change-point detection of gaseous and particulate traffic-related pollutants at a roadside location, Environmental Science and Technology, 40 (22), pp. 6912-6918.
CONTRIBUTING AUTHOR COPYRIGHT RELEASE FORM
As author of the chapter/contribution titled A data mining tool for detecting and predicting abnormal behaviour of railway tunnels, to appear in the Proceedings of Structural Health Monitoring 2017, I hereby agree to the following:
1. To grant to DEStech Publications, Inc., 439 North Duke Street, Lancaster, PA, 17602, copyright of the above named chapter/contribution (for U.S.
Government employees to the extent transferable), in print, electronic, and online formats. However, the undersigned reserve the following:
a. All proprietary rights other than copyright, such as patent rights. b. The right to use all or part of this article in future works.
DEStech Publications thereby retains full and exclusive right to publish, market, and sell this material in any and all editions, in the English language or otherwise.
1 I warrant to DEStech Publications, Inc., that I am the (an) author of the above-named chapter/contribution and that I am the (a) copyright holder of the above-named chapter/contribution granted to DEStech Publications, Inc.
2 I warrant that, where necessary and required, I have obtained written permission for the use of any and all copyrighted materials used in the above-named chapter/contribution. I understand that I am responsible for all costs of gaining written permission for use of copyrighted materials.
3 I agree to assume full liability to DEStech Publications, Inc. and its licensee, and to hold DEStech Publications, Inc. harmless for any claim or suit filed against DEStech Publications, Inc. for violation of copyrighted material used in the above-named contribution.
Please sign and date this form and retain a copy for your records. Please include original form with your chapter/paper.
Thank you for your cooperation.
Please print name: __Matteo Vagnoli___________________ Signed: __________
_________Dated: 12/05/2017 ________________________
439 NORTH DUKE STREET • LANCASTER, PENNSYLVANIA 17602-4967, U.S.A. Toll Free: (866) 401-4337 • Tel: (717) 290-1660 • Fax: (717) 509-6100 E-mail: [email protected] •