Development and Validation of A High Density
SNP Genotyping Array for African Oil Palm
Article in Molecular Plant · April 2016
DOI: 10.1016/j.molp.2016.04.010
CITATIONS
0
READS
55
13 authors, including:
Some of the authors of this publication are also working on these related projects:
International field trials of bambara groundnutView project Qi Bin Kwong
10 PUBLICATIONS 21 CITATIONS SEE PROFILE
David Ross Appleton Sime Darby
55 PUBLICATIONS 573 CITATIONS SEE PROFILE
All in-text references underlined in blue are linked to publications on ResearchGate, letting you access and read them immediately.
Development and Validation of A High Density SNP Genotyping Array for African Oil Palm
Qi Bin Kwong, Chee Keng Teh, Ai Ling Ong, Huey Ying Heng, Heng Leng Lee, Mohaimi Mohamed, Joel Zi-Bin Low, Apparow Sukganah, Fook Tim Chew, Sean Mayes, Harikrishna Kulaveerasingam, Martti Tammi, David Ross Appleton
PII: S1674-2052(16)30032-6
DOI: 10.1016/j.molp.2016.04.010
Reference: MOLP 286
To appear in: MOLECULAR PLANT
Accepted Date: 17 April 2016
Please cite this article as: Kwong Q.B., Teh C.K., Ong A.L., Heng H.Y., Lee H.L., Mohamed M., Low
J.Z.-B., Sukganah A., Chew F.T., Mayes S., Kulaveerasingam H., Tammi M., and Appleton D.R.
(2016). Development and Validation of A High Density SNP Genotyping Array for African Oil Palm. Mol. Plant. doi: 10.1016/j.molp.2016.04.010.
This is a PDF file of an unedited manuscript that has been accepted for publication. As a service to our customers we are providing this early version of the manuscript. The manuscript will undergo copyediting, typesetting, and review of the resulting proof before it is published in its final form. Please note that during the production process errors may be discovered which could affect the content, and all legal disclaimers that apply to the journal pertain.
M
AN
US
CR
IP
T
AC
CE
PT
ED
1
Development and Validation of A High Density
1
SNP Genotyping Array for African Oil Palm
2
Qi Bin Kwong1*, Chee Keng Teh1, Ai Ling Ong1, Huey Ying Heng1, Heng Leng Lee1, Mohaimi
3
Mohamed1, Joel Zi-Bin Low1, Apparow Sukganah1, Fook Tim Chew2, Sean Mayes3, Harikrishna
4
Kulaveerasingam1, Martti Tammi1, David Ross Appleton1 5
6
1
Biotechnology & Breeding Department, Sime Darby Plantation R&D Centre, Selangor, 43400, 7
Malaysia 8
2
Department of Biological Sciences, National University of Singapore, 117543, Singapore
9
3
School of Biosciences, University of Nottingham, Sutton Bonington Campus, Nr 10
Loughborough, LE12 5RD, UK 11
12
* Correspondence: Qi Bin Kwong ([email protected]) 13
14
M
AN
US
CR
IP
T
AC
CE
PT
ED
2
Abstract
16
High-density single nucleotide polymorphism (SNP) genotyping arrays are powerful 17
tools that can measure the level of genetic polymorphism within a population. To develop this 18
whole-genome SNP array, SNP discovery was performed using deep resequencing of eight 19
libraries derived from 132 Elaeis guineensis and Elaeis oleifera palms belonging to 59 origins, 20
resulting in the discovery of >3 million putative SNPs. After SNP filtering, the Illumina OP200K 21
custom array was built with 170,860 successful probes. Phenetic clustering analysis revealed that 22
the array could distinguish between palms of different origins in a way consistent with pedigree 23
records. Genome-wide linkage disequilibrium (LD) declined more slowly for the commercial 24
populations (ranging from 120Kb at r2=0.43 to 146Kb at r2=0.50) when compared with the
semi-25
wild populations (19.5Kb at r2=0.22). Genetic fixation mapping comparing the semi-wild and
26
commercial population identified 321 selective sweeps. A genome-wide association study 27
(GWAS) detected a significant peak on Chromosome 2 associated with the polygenic component 28
of the shell thickness trait (based on the trait shell-to-fruit; S/F %) in tenera palms. Testing of a 29
genomic selection model on the same trait resulted in good prediction accuracy (r=0.65) with 30
42% of the S/F % variation explained. The first high-density SNP genotyping array for oil palm 31
has been developed and shown to be robust for use in genetic studies and with potential for 32
developing early trait prediction to shorten the oil palm breeding cycle. 33
Keywords: genotypes, whole-genome SNP array, genome-wide association study, genomic 34
selection, genetic fixation, shell thickness, oil palm, linkage disequilibrium, phenetic clustering, 35
whole-genome variation, genomic prediction, genome-wide linkage disequilibrium, polygenic 36
trait 37
38
39
M
AN
US
CR
IP
T
AC
CE
PT
ED
3 Introduction 41Oil palm (Elaeis guineensis Jacq.) is a monocot of the Arecaceae family that originated 42
from tropical Guinea’s rainforest in West Africa (Hartley, 1967c). This plant is the most efficient 43
oil crop in the world, yielding commercially an average of 4 tons oil hectare-1 year-1, equivalent
44
to ten times the average oil yield hectare-1 year-1 of other oil crops; palm oil currently supplies
45
30% of the global edible oil demand (US Department of Agriculture, 2015). In order to address 46
issues of climate change and land and labor shortage, the most sustainable strategy to meet future 47
demand is to increase yields on the same planting area through oil palm breeding. For this 48
purpose, oil palm breeding will need to improve multiple traits affected by biotic, abiotic, 49
management and processing regimes simultaneously (Davidson, 1991; Meunier et al., 1979; Soh, 50
1981). 51
Genetic diversity is always the key resource for improvement of any agronomic trait. 52
Comprehensive germplasm prospections of E. guineensis have been carried out in Africa since 53
the first commercial cultivation of the crop in the early 20th century (Rajanaidu, 1986b).
54
Prospection has been extended to the African oil palm’s close species relative, E. oleifera H.B.K. 55
Cortes, present in Central and South America (Rajanaidu, 1986a). The South American oil palm 56
is superior in terms of commercially desirable oil quality (high level of unsaturated oils), has low 57
height increment and carries wilt resistance (Hardon et al., 1985; Hartley, 1988; Mohd et al., 58
2002). However, the South American palm yields poorly, producing on average 0.5 tons oil 59
hectare-1 year-1 (Wahid et al., 2004). Attempts to introduce these beneficial traits from
60
prospective germplasm into the commercial E. guineensis through interspecific crossing 61
programs have met with varying degrees of success. Molecular markers, such as restriction 62
fragment length polymorphism (RFLP), amplified fragment length polymorphism (AFLP) and 63
random amplified polymorphic DNA (RAPD) were first used to assess genetic diversity of the 64
collected and available germplasm (Barcelos et al., 2002; Shah et al., 1994). Attention then 65
shifted to multi-allelic marker systems, particularly simple sequence repeats (SSRs), which 66
detect a high degree of allelic variation even among closely related individuals. Hence, SSR 67
markers for E. guineensis have been derived from genomic libraries and expressed sequence tag 68
(EST) databases (Billotte et al., 2001; Ting et al., 2010). The aim of the molecular marker 69
M
AN
US
CR
IP
T
AC
CE
PT
ED
4 widen the genetic base of breeding programs (reducing potential inbreeding depression and 71introducing novel trait alleles) through introgression. Genetic improvement in oil palm through 72
conventional breeding, however, is slow due to long selection cycles (typically 12 years) and the 73
lack of genetic homozygosity in current advanced parental breeding materials (Mayes et al., 74
2000). To shorten the selection cycle, molecular markers can be deployed to identify quantitative 75
trait loci (QTL) underlying traits of interests and to perform genome-wide screening of oil palm 76
(Wong and Bernardo, 2008). The individual palms that possess desired allelic combinations of 77
QTL can be identified in immature plants, even at the nursery stage, rather than relying on 7-10 78
years of phenotypic evaluation in the field, also facilitating rapid backcross introgression of 79
novel traits into elite material. 80
Yield traits (e.g. oil yield and bunch production) in oil palm are mostly quantitatively 81
inherited and controlled by multiple genes. Controlled cross-based linkage analysis and GWAS 82
are the main methods that have been exploited to discover and locate genes/QTL for these 83
complex traits. Multi-allelic markers such as RFLP and SSR used so far normally only provide 84
low to medium mapping and genome coverage resolutions. In contrast, SNPs have a high level 85
of abundance and distribution uniformity throughout a genome and are now widely deployed for 86
developing high-density genome-wide scans in humans, and have been used more recently in 87
plants (Huang et al., 2010; Wang et al., 1998). The publication of the 1.535 Gb oil palm genome 88
and the independent assembly of Sime Darby’s oil palm genome, together with the cost 89
reduction in high-throughput sequencing provide an opportunity for large scale and high density 90
SNP detection in oil palm (Singh et al., 2013b). 91
Whole-genome SNP arrays have been developed for many species including rice, corn, 92
cattle, horse and more recently salmon (Chen et al., 2014; Ganal et al., 2011; Houston et al., 93
2014; McCue et al., 2012; Yu et al., 2014). To date, the only SNP genotyping array available for 94
oil palm is a 4.5K custom Illumina SNP array, which has been proven to be useful in 95
construction and comparison of linkage maps (Ting et al., 2014). However, for genome-wide 96
scans, including GWAS and LD analysis, a higher density genotyping array is required. 97
This manuscript summarizes the overall properties of the first whole-genome SNP array 98
for oil palm. In addition, the analyses of 312 tenera palms from different backgrounds using the 99
M
AN
US
CR
IP
T
AC
CE
PT
ED
5 decay analysis, selective sweep mapping and GWAS. Oil palm breeders and researchers can use 101
this genetic information as the basis for crop improvement programs, through applied marker 102
assisted selection and/or direct genomic selection approaches. 103
104
Results
105
Genome resequencing, SNP discovery and array design
106
The pooled resequencing generated approximately 73.76 Gb of data – approximately a 107
40x coverage of the oil palm genome. In total, 1,015,758,056 reads were generated. After 108
filtering, 870,235,918 high quality reads were identified for mapping against the published oil
109
palm genome and Sime Darby’s in-house scaffolds independently. The sequencing data 110
produced had a mean sequence quality Phred score of 39 (Figure S1). There were no over-111
represented sequences and the average GC content was within the expected range of between 40-112
45%. 113
More than seven million SNPs were called from the resequencing data. The SNPs which 114
were unique for the E. oleifera genome (1,085,204 SNPs), those with mapping coverage less 115
than x17 or more than x53 (669,950 SNPs), genotyping quality (GQ) scores of less than 8 (5,089 116
SNPs) and minor allele frequency (MAF) of < 0.05 (71,503 SNPs) were removed as part of the 117
quality control procedure. Based on the technical requirements of Illumina, 5,174,660 SNPs that 118
have secondary SNPs located within 60bp upstream or downstream were removed by filtering. In 119
addition, other criteria for the removal of candidates included SNPs that were indels (56,357 120
SNPs), non-biallelic (408 SNPs) and SNP types that required two bead types on the array to be 121
detected, i.e. A/T and C/G types (88,348 SNPs). Ambiguous bases within the 121bp probe region 122
were also identified and removed (10,992) (Table S1). From the 593,888 high quality SNPs 123
identified in silico, 200,000 SNPs were finally selected according to LD with a r2 cut-off set at
124
0.3 and uniform spacing across the assembled genome to populate the OP200K array. 125
126
SNP genotyping
M
AN
US
CR
IP
T
AC
CE
PT
ED
6 Out of the 200,000 designed SNPs, 170,860 markers passed bead representation and 128
decoding quality metrics. By testing the array on 312 palms representing some of the 59 diverse 129
oil palm origins, 161,073 SNPs generated reproducible scores and resulted in the basal data set 130
used for the subsequent analysis. An example of the genotyping result is provided in Figure S2. 131
Overall, only 0.65% of the entire genotyping data set was missing data. 132
A total of 70,804 genotyped SNPs could be located on the published oil palm physical 133
map. The density of these SNPs on the chromosomes is illustrated in Figure 1. Using the 134
published physical map as a reference, each chromosome has an average of 4,425 SNP loci. 135
Chromosome 10 has the highest marker density (1 SNP every 8,344bp), whereas Chromosome 6 136
has the lowest (1 SNP every 10,254bp). Overall, the density of the array is 1 SNP per 11Kb of 137
the oil palm physical map, inclusive of chromosomes and scaffolds. This resolution is 138
comparable with other published large-scale whole genome SNP genotyping arrays for plant 139
species (Chen et al., 2014; Ganal et al., 2011). 140
141
Figure 1. SNP distribution and density per chromosome in the oil palm genome assembly.
142
The SNP distribution per chromosome is represented in the histogram. The mean genomic 143
distance between markers on every chromosome is indicated as a line plot. The average SNP 144
density of the OP200K array is 1 SNP per 11Kb, based on the oil palm physical map. 145
146
Phenetic analyses
147
To reveal the genetic relationship between all 312 tenera palms, a full neighbor-joining 148
dendrogram was built for the 312 individuals genotyped using the full 161,073 SNP dataset
149
(Figure S3). For illustration purposes, a representative dendrogram was also built using only 45 150
individuals (Figure 2). The bootstrap values from the representative dendrogram ranged from 80 151
– 100, indicating good reproducibility. Both results identified five main clusters from the major 152
nodes, I. Ulu Remis (UR) x AVROS; II. Johore Labis (JL) x AVROS; III. Nigerian x AVROS; 153
IV. Gunung Melayu (GM) x Dumpy AVROS (DA); and V. JL x DA. This finding was consistent 154
M
AN
US
CR
IP
T
AC
CE
PT
ED
7 pedigree records. The commercial planting materials (I and II) were grouped separately from the 156
semi-wild (III) and breeding populations (IV and V). 157
158
Figure 2. Genetic relationships between representative tenera palms derived from different
159
backgrounds. A neighbor-joining dendrogram was constructed for 45 representative tenera
160
palms based on pairwise genetic distances. Five main clusters were identified, including I. UR x
161
AVROS (red), II. JL x AVROS (purple), III. Nigerian x AVROS (green), IV. GM x DA (yellow) and V.
162
JL x DA (blue).
163
164
Genome-wide LD decay
165
The average decay of LD with physical distance between SNPs was 146Kb (r2 = 0.50)
166
and 120Kb (r2 = 0.43) for the UR x AVROS cluster and the JL x AVROS cluster. Average LD
167
decayed faster at 87.7Kb (r2 = 0.22) and 54.7Kb (r2 = 0.21) for the JL x DA cluster and the GM
168
x DA cluster, followed by 19.5Kb (r2 = 0.22) for the Nigerian x AVROS cluster (Figure 3). By
169
using the minimal LD decay of 19.5Kb as a base line reference and compared with Chromosome 170
6 with the lowest marker density (1 SNP every 10,254bp), this array provides sufficient genomic 171
resolution to detect association signals in any oil palm population. 172
173
Figure 3. Decay of LD in the five tenera clusters from different backgrounds. Each cluster
174
has a different LD decay pattern, expressed in r2, which is probably due to different selection and
175
breeding histories. 176
177
Mapping of selective sweeps
178
A total of 321 selective sweeps were detected in the genome of the commercial 179
M
AN
US
CR
IP
T
AC
CE
PT
ED
8 on every chromosome in the oil palm genome. 38% of the selection events were observed on 181
Chromosome 1, 2 and 3 (Figure 4). 182
183
Figure 4. Genome-wide mapping of selective sweeps. A total of 321 selective sweeps were
184
identified in commercial populations by comparing them against the semi-wild Nigerian x 185
AVROS population. Selective sweeps were defined as the top 1% of the score windows. The 186
selective sweeps were highlighted in black. 187
In this study, 679 genes were present in the detected selective sweeps (Table S2). These 188
genes could be annotated into 1097 Gene Ontology (GO) classes and 120 Enzyme Classes (EC). 189
Statistically, 162 GOs and ECs were observed to be significantly over-represented (at Chi-square 190
p<0.05) in the selective sweep regions for the commercial populations, as compared to the semi-191
wild population (Table S3). 192
193
GWAS & Genomic selection
194
To evaluate the usefulness of this array in GWAS, we selected the polygenic S/F % of 195
tenera palms as the trait of interest. While it has been shown that fruit type identity is controlled 196
by a single gene (Singh et al., 2013a), once this is taken into account there is still significant 197
variation remaining in breeding and commercial populations for S/F %. Here, all palms 198
evaluated were tenera, which effectively removes the contribution of the SHELL identity gene, 199
per se. In this analysis, population structure was controlled using a kinship matrix while 200
environmental factors were initially tested as if unimportant. Genomic inflation was calculated to 201
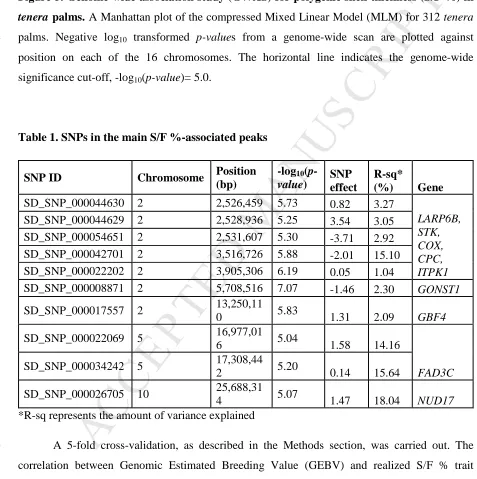
be 1.0, indicating that inflation was successfully controlled by this approach. From the GWAS 202
result, we observed a number of significantly associated SNPs across a genomic region 203
1,378,847bp in length, located on Chromosome 2 from position 2,526,459bp to 3,905,306bp 204
based on the genome-wide significance cut-off, -log10 p-value = 5.0 (Figure 5). Some of the
205
genes that fall in this region include La-related protein 6B (LARP6B), SHELL/Seedstick (STK), 206
Cytochrome c oxidase (COX), Transcription factor CPC (CPC) and Inositol-tetrakisphosphate 207
M
AN
US
CR
IP
T
AC
CE
PT
ED
9 position 5,708,516bp and 13,250,110bp of Chromosome 2. In addition, a few other signals were 209
located at Chromosome 5 and 10 (Table 1). A full GWAS SNP list is presented in Table S4. 210
[image:11.595.52.529.196.675.2]211
Figure 5. Genome-wide association study (GWAS) for polygenic shell thickness (S/F %) in
212
tenera palms. A Manhattan plot of the compressed Mixed Linear Model (MLM) for 312 tenera
213
palms. Negative log10 transformed p-values from a genome-wide scan are plotted against
214
position on each of the 16 chromosomes. The horizontal line indicates the genome-wide 215
significance cut-off, -log10(p-value)= 5.0.
216
217
Table 1. SNPs in the main S/F %-associated peaks
218
SNP ID Chromosome Position
(bp)
-log10
(p-value) SNP effect R-sq* (%) Gene
SD_SNP_000044630 2 2,526,459 5.73 0.82 3.27
LARP6B, STK, COX, CPC, ITPK1
SD_SNP_000044629 2 2,528,936 5.25 3.54 3.05
SD_SNP_000054651 2 2,531,607 5.30 -3.71 2.92
SD_SNP_000042701 2 3,516,726 5.88 -2.01 15.10
SD_SNP_000022202 2 3,905,306 6.19 0.05 1.04
SD_SNP_000008871 2 5,708,516 7.07 -1.46 2.30 GONST1
SD_SNP_000017557 2 13,250,11
0 5.83 1.31 2.09 GBF4
SD_SNP_000022069 5 16,977,01
6 5.04 1.58 14.16
FAD3C
SD_SNP_000034242 5 17,308,44
2 5.20 0.14 15.64
SD_SNP_000026705 10 25,688,31
4 5.07 1.47 18.04 NUD17
*R-sq represents the amount of variance explained 219
A 5-fold cross-validation, as described in the Methods section, was carried out. The 220
correlation between Genomic Estimated Breeding Value (GEBV) and realized S/F % trait 221
acquired was 0.65 (Figure 6) based on the criteria given in Methods section. The prediction 222
model built suggested that 42% of the trait variation could be explained in the validation 223
M
AN
US
CR
IP
T
AC
CE
PT
ED
10 225
Figure 6. Representative regression plot of GEBV and true shell thickness for the
226
validation population set. The GEBV was obtained by Bayes A in the final model. The
227
correlation coefficient between GEBV and true trait was 0.65 with 42% S/F variation explained. 228
229
Discussion
230
The OP200K reported here is the first large scale oil palm SNP array. Since oil palm is a 231
naturally outcrossing and monoecious species, each oil palm genome can be highly heterozygous 232
(Hartley, 1967a). The SNP array is therefore designed to be applicable to a wide range of oil 233
palm origins. As such, SNPs were discovered by resequencing palms of diverse origins including 234
all fruit forms (dura, tenera and pisifera) and the major breeding origins available at Sime Darby 235
Plantations. The different fruit forms are distinguished by the thickness of the shell, together with 236
the presence/absence of a fiber ring: dura (thick-shelled; without fiber ring), tenera (thin-shelled; 237
with fiber ring), and pisifera (shell-less; female-sterile; with fiber ring). Shell thickness is 238
inversely correlated with the mesocarp percentage in each fruitlet, and therefore also to 239
commercial crude palm oil yield; because tenera, a hybrid between dura and pisifera, has the 240
highest mesocarp oil yield, it is the fruit form exploited commercially. 241
The analyzed OP200K array data clearly revealed the genetic stratification of the 312 242
tenera palms from a number of important origins in a way concordant with pedigree records. The 243
five main clusters identified are I (UR x AVROS); II (JL x AVROS); III (Nigerian x AVROS); 244
IV (GM x DA); and V (JL x DA). Clusters I and II include the commercial populations, whereas 245
cluster III represents the semi-wild population. Cluster IV and V represent other breeding 246
populations at Sime Darby Plantations. In Southeast Asia, oil palm breeding improvement is 247
almost exclusively focused on the Deli dura origin on the maternal side, which is believed to be 248
derived from the four palms planted at the Bogor Botanic Garden, Indonesia, in 1848. The 249
subsequent distribution to several breeding programs stressing different selection criteria over a 250
number of generations has led to differentiation between subpopulations, leading to pools of 251
‘dissimilar’ germplasm which have been termed ‘breeding populations of restricted origins 252
M
AN
US
CR
IP
T
AC
CE
PT
ED
11 for different yield-related traits. The UR origin was chosen for high bunch number and high sex 254ratio (defined as the ratio of female inflorescences to total inflorescences) in Marihat Baris, 255
Sumatra (Hartley, 1967b). Instead of bunch number, Socfindo in Sumatra selected the JL origin 256
for bigger bunches (high bunch weight) and thinner shell. Another further interested origin, GM 257
was planted by a Swiss company in the year 1919 and selections were made for low height 258
increment and high oil/mesocarp (Corley and Tinker, 2003). 259
An immediate 30% increment of oil yield per hectare was gained after the introduction of 260
the Deli dura x BM119 AVROS pisifera program to the Southeast Asia region (Corley and 261
Tinker, 2003; Hardon et al., 1987). The AVROS pisifera paternal parent line confers superiority 262
in uniformity of growth, general combining ability, precocity and high mesocarp oil content in 263
the commercial Deli x AVROS (tenera) hybrid progeny. However, the narrow genetic base of 264
both Deli and AVROS - theoretically descended from four and two palms, respectively - may 265
hinder future breeding progress (Rosenquist, 1990). Consistent with this, it was observed that the 266
LD decayed slowest at 120Kb and 146Kb in both commercial JL x AVROS and UR x AVROS 267
clusters, respectively, compared with 19.5Kb in the semi-wild Nigerian x AVROS cluster, 268
indicating the lower genetic diversity/narrower genetic base and potentially the effects of higher 269
selection pressure in these materials. 270
Alternative genetic resources, such as semi-wild Nigerian dura and the DA pisifera 271
breeding materials are being exploited by the breeders to broaden the genetic variability. Direct 272
improvement in oil yield per palm is the highest priority for oil palm breeding. However, due to 273
an acute labor shortage for fresh fruit bunch (FFB) collection, palm structural traits such as 274
height are also of potential interest. One approach to mitigate this problem has led to a shift in 275
the oil palm breeder’s attention to DA, GM and JL populations for development of materials 276
with lower annual height increment, to facilitate harvesting. The DA originated from the well-277
known Dumpy E206 self-pollinated cross, the parental palm that had an unusually large girth and 278
low height increment (Jagoe, 1952). The DA pisifera lines have been crossed with the short-279
stemmed GM dura and JL dura to reduce trunk height increment in their resulting tenera 280
progeny (Corley and Tinker, 2003). The introduction of new genetic material into elite breeding 281
programs has indeed introduced more recombination into these tenera clusters, breaking the 282
M
AN
US
CR
IP
T
AC
CE
PT
ED
12 at 54.7Kb for UR x DA cluster) and the semi-wild Nigerian x AVROS cluster (at 19.5 Kb) 284decayed at least two-fold faster when compared to the commercial populations. Using the most 285
rapid rate of LD as the reference (i.e. 19.5Kb), the OP200K array provides sufficient mapping 286
resolution for whole genome linkage analysis and GWAS in any of the materials examined to 287
date. 288
The long-range LD observed in the commercial populations can potentially be explained 289
further by breeding selection. The selected alleles will rise in frequency towards fixation in a 290
population and nearby linked alleles on the chromosome will be co-selected through linkage drag 291
with the selected locus to high frequency. This process is termed a ‘selective sweep’. A total of 292
321 potential selective sweeps were observed in the oil palm genome based on the available 293
physical map. In these selective sweeps, the over-represented gene classes (based on Chi-square 294
tests) can be classified into different groups, including floral and fruit development 295
(GO:0009733 response to auxin, GO:0048574 long-day photoperiodism, flowering, 296
GO:0048575, short-day photoperiodism, flowering, GO:0010483 pollen tube reception and 297
GO:0010183 pollen tube guidance) and lipid biosynthesis (GO:0019216 regulation of lipid 298
metabolic process, GO:0000038 very long-chain fatty acid metabolic process, GO:0042304 299
regulation of fatty acid biosynthetic process, GO:0006636 unsaturated fatty acid biosynthetic 300
process, GO:0045300 acyl-[acyl-carrier-protein] desaturase activity , EC:2.3.1.41 beta-ketoacyl-301
[acyl-carrier-protein] synthase I). The selection of these gene classes might be associated with 302
the main breeding objective in oil palm: maximizing oil yield per unit area for plantation 303
profitability (Corley and Tinker, 2003). As a direct comparison, in another oil crop, soybean, the 304
main gene classes over-represented in the cultivated population were flowering time/floral 305
development, fatty acid biosynthesis and plant structure (height and pubescence) (Zhou et al., 306
2015). In rice, however, the main gene classes were flowering time/floral development, plant 307
growth and morphology (Xu et al., 2012). In all three species, we observed flowering or floral 308
development to be a key trait of importance for breeding programs. For the oil species, as 309
expected, the fatty acid related classes were crucial. In the longest selective sweep of 310
Chromosome 2, we have identified the MADS-box transcription factor 16 gene, which is known 311
to be responsible for floral identity control and development (Moon et al., 1999). In oil palm, 312
female inflorescence development determines bunch yield components (Breure and Menendez, 313
M
AN
US
CR
IP
T
AC
CE
PT
ED
13 also possible that some of these genes might be inherited through linkage drag with the oil yield-315related genes selected under breeding. Also, given that the population base of the modern elite 316
breeding materials is narrow, it is possible that there might be a number of false positives. The 317
true causality can only be concluded through functional analysis, which is laborious. To narrow 318
the scope of functional studies, GWAS can be used in conjunction with selective sweep analysis 319
as additional evidence to identify QTL. Knowing that fruit and floral development is one of the 320
key gene classes found in the selective sweeps, identification of the important QTL in one of the 321
fruit components, S/F %, was selected to illustrate the applicability of this array in GWAS. 322
In oil palm, the fruit forms are determined as thick-shelled dura (Shell+ Shell+) , shell-less
323
pisifera (Shell- Shell-) and their hybrid, thin-shelled tenera (Shell+ Shell-), in a co-dominant 324
Mendelian inheritance pattern, first reported in the 1940s (Beirnaert and Vanderweyen, 1941). 325
The gene responsible for fruit form, determined by the presence or absence of shell and fiber 326
ring, has been reported to be SHELL, a gene homologous to the Arabidopsis SEEDSTICK (STK) 327
gene (Singh et al., 2013a). This gene is located at position 3,058,076bp of Chromosome 2. 328
However, within the tenera fruit form, varying degrees of thickness of the shell exists. 329
Presumably controlled by minor genes, it is known that there is polygenic variation in shell 330
thickness, superimposed onto the major SHELL effect (Corley and Tinker, 2003). The tenera 331
palms with a low S/F % trait have more mesocarp per fruit, leading to more oil production. 332
Given the importance of this trait in the tenera population, GWAS was carried out to study key 333
loci responsible for the variation in this trait that is not explained by the SHELL gene. Due to the 334
relatively small sample size of the populations, all of the 312 palms were treated as a single 335
group before performing association mapping. The kinship and population substructure of the set 336
were controlled for by using a kinship matrix. The S/F %-associated GWAS peak at 337
Chromosome 2 position 2,526,459bp to 3,905,306bp contains the published SHELL gene. This 338
could argue for allelic effects of different sources of SHELL and the surrounding regions. This 339
peak overlaps with the selective sweeps detected in Chromosome 2. It should be noted, however, 340
that two independent signals on Chromosome 2 were also found farther away at 5,708,516bp and 341
13,250,110bp, and a few other signals were identified on other chromosomes. These additional 342
signals might indicate that there are other minor factors influencing S/F % in tenera palms. By 343
having a larger sample set and through fine mapping, these minor factors can be identified and 344
M
AN
US
CR
IP
T
AC
CE
PT
ED
14 thickness. The new OP200K genotyping array has also been proven to be robust in detecting 346significant associations for a polygenic complex trait, which is high mesocarp oil content in oil 347
palm (Teh et al., 2016). 348
As demonstrated, the association peaks, which is representative of the QTL, can be 349
detected through GWAS. In order to predict the total genetic breeding value of the genome 350
relative to a trait, instead of using only specific previously identified loci, the genetic effects of 351
the entire genome were evaluated. The approach adopted is known as genomic selection, where 352
all QTL are expected to be in LD with at least one marker locus (Goddard and Hayes, 2007). As 353
previously shown, marker density for the current array is likely to fulfill this requirement, 354
potentially ensuring high prediction accuracy in breeding selection (Meuwissen et al., 2001b). 355
S/F % trait was again selected to test the applicability of genomic selection using this array. Even 356
without addressing environmental variation between palms and populations, within population 357
substructures and with a limited sample size for the training population, a prediction accuracy of 358
about 0.65 was still achieved, thereby illustrating the viability of genomic selection with this 359
array for S/F %. The method used here for genomic selection is Bayes A (Meuwissen et al., 360
2001a). There are other methods that might give higher prediction accuracy and reduce 361
processing time for larger sample sizes, which will be the focus for future studies (Resende et al., 362
2012). 363
The applications of the OP200K genotyping array in genetic diversity assessment, 364
GWAS and genomic selection have proven to be robust and consistent using existing data for 365
palms in these important origins of oil palm. This SNP array has allowed the current mapping 366
resolution to be improved significantly and the array has become the densest genotyping array 367
for oil palm. Hence, the array can be referred to as the first whole genome genotyping tool for oil 368
palm breeding programs. To optimize the genotyping cost, the array can further be customized 369
for the different BPROs developed in different breeding selection programs. From our 370
experience, at this time, the array-based approach is still far cheaper than genotyping by 371
sequencing for high-density marker analysis. The marker density can be reduced according to the 372
BPRO-specific LD decay analysis as shown in this study to ensure good genome coverage with 373
there likely to be at least one representative SNP in every LD block. Overall, the new OP200K 374
M
AN
US
CR
IP
T
AC
CE
PT
ED
15 376
Methods
377
Whole genome resequencing
378
A total of 132 palms from 59 diverse origins were selected for resequencing using 379
Illumina GAIIx, as reported previously (Teh et al., 2016). Genomic DNA (gDNA) for each palm 380
was isolated from 100 milligram of dried leaf tissue using the DNAeasy Plant Mini Kit (Qiagen). 381
The resulting gDNA samples were pooled, with equal amounts of gDNA from all samples. The 382
DNA quantity and quality were then assessed using the NanoDrop ND-1000 Spectrophotometer. 383
A total of eight paired-end (75bp each end) libraries with insert size of 100bp were constructed 384
from the pool according to Illumina’s standard protocol for whole genome shotgun sequencing. 385
386
SNP discovery and array design
387
The raw reads acquired from resequencing were trimmed to remove poor quality base 388
calls (Phred<30) and mapped against both the published oil palm genome and in-house scaffolds 389
using the BWA software (sampe and aln) with default parameters (Li and Durbin, 2010). SNP 390
calls were made using samtools programs with parameters of d 1000, C 50, D S g u q 20 -391
m 3 (Li et al., 2009). The SNPs were filtered using the vcfutils script with parameters -Q25, -w 392
2, -W 2, -D 1000, -d 3. From the resulting vcf files, SNPs that had a mapping coverage between 393
17 and 53, a GQ score of >7, and a MAF of >0.05 were kept. 394
Only SNPs that had no secondary SNPs 60bp upstream and downstream were used. Other 395
criteria for removal of candidates included SNPs that were indels, were non-biallelic and SNP 396
types that required two bead types on the array, i.e. A/T and C/G types. Ambiguous bases within 397
the 121bp probe region were also identified and removed. The probes were then sent to Illumina 398
to score for their designability. In-house scripts were used to select 200,000 SNPs with the best 399
Illumina designability, LD with r2 cut-off was set at 0.3 and the set chosen to give a uniform
400
distribution across the entire genome, based on the published and in-house genome. The 401
M
AN
US
CR
IP
T
AC
CE
PT
ED
16 403
SNP genotyping
404
The OP200K arrays were used to genotype a panel of 312 accessions from commercial 405
oil palm populations of UR x AVROS and JL x AVROS (66 and 33 individuals), a semi-wild 406
population of Nigerian x AVROS (101 individuals) and breeding populations of GM x DA and 407
JL x DA (13 and 99 individuals). 408
For each of the accessions, gDNA was extracted using the same method as described 409
under the resequencing step. Prior to hybridization to the bead arrays, DNA was diluted to 410
25ng/ul and DNA quantification was obtained with Hoechst (33258 Pentahydrate (Invitrogen), 411
using the FLUOstar Omega (BMG Labtech)). DNA quality was assessed on a 0.8% agarose 412
gel. The genotyping was carried out using the designed array on the Infinium iScan platform 413
(Illumina Inc, San Diego, CA) according to the recommendations of the manufacturer. 414
The raw intensity SNP data was analyzed using GenomeStudio version 20011.1 by 415
Illumina with genotyping module version 1.8.4. Using a GenCall score cutoff of 0.15, auto-416
cluster of the SNPs was done. Cluster refining of the SNP clusters was done manually by visual 417
inspection so that identifiable and scorable clusters were generated. The SNP calls were exported 418
into the PLINK program for MAF and call rate filtering (Purcell et al., 2007). A minimal call rate 419
of 90% and a MAF filter of 0.01 were set as baseline cut-offs. 420
421
Phenetic analysis
422
The SNP genotypes of 312 tenera palms were compiled. Missing SNP genotypes were 423
imputed using the mean value for each of the populations in this study. The genotypes were first 424
recoded into 0 (AA), 1 (AB) and 2 (BB). Pairwise genetic distance was estimated using the 425
dist.dna function of the APE package in R (Paradis et al., 2004). The dendrogram was generated 426
using the njs function, which implements the neighbor-joining clustering method (Saitou and 427
Nei, 1987). The bootstrap consensus tree was inferred from 1,000 replicates and the other 428
parameters were used as default. Illustration of the tree was done using FigTree version 1.4.2, 429
M
AN
US
CR
IP
T
AC
CE
PT
ED
17 431
Genome-wide LD decay
432
Genome-wide LD was estimated by calculating pairwise correlation coefficient (r2)
433
values between all pairs of SNPs in a 1-Kb window size within each chromosome across the five 434
clusters of oil palm. An inter-SNP distance of more than 10Mb was ignored. The LD decay rate 435
was defined as the chromosomal distance at which the average r2 dropped to half of its maximum
436
value. For this step, the R package of SNPRelate was used, with the LD estimation based on the 437
composite method (Zheng et al., 2012). 438
439
Mapping of selective sweeps
440
This step was carried out using XP-CLR software (Chen et al., 2010). The window size 441
of 0.1 cM and a grid size of 20000 kb was set for this step. Selective sweeps identified side by 442
side were combined. Top 1% of the XP-CLR scores was selected as the threshold to identify 443
selective sweep (Kim et al., 2015). The result was illustrated in chromosomal format using 444
MapChart version 2.30, with the density of the chromosomal map spaced by 0.5Mb (Voorrips, 445
2002). 446
Identification of genes that fall into these regions was determined using published 447
genome information (Singh et al., 2013b). These genes were clustered based on GO by using 448
BLAST2GO (Conesa and Gotz, 2008). The Chi-square method implemented in R was used to 449
test for the enrichment of putative artificially selected genes in all the GOs/ECs identified. With 450
a p-value cut-off set at 0.05, a GO/EC class was considered to be significantly enriched if the 451
number of putative selected genes belonging to that class were significantly more than the 452
expected number calculated for that particular class across the significance region from the total 453
number of genes. 454
455
GWAS & Genomic selection
M
AN
US
CR
IP
T
AC
CE
PT
ED
18 The polygenic shell thickness of 312 tenera palms was measured according to weight 457
difference between shell and the total fruit as S/F %. The individual palms were phenotyped to 458
generate a reliable mean S/F % value for analysis as per industry standards with modifications 459
(Blaak et al., 1963; Rao et al., 1983). GWAS was then carried out using the GenABEL package 460
in R, which implements a mixed linear model to detect association signals (Aulchenko et al., 461
2007). To control for cryptic relatedness in the population, a kinship matrix was generated by the 462
ibs function in the package, which computes the identity by state for the markers data. The 463
default weight parameter for the kinship matrix construction was used. The association score was 464
calculated using the mmscore function, with all the parameters set to default. Population inflation 465
was estimated using the estlambda function implemented in the package. A threshold –log10
(p-466
value) of 5.0was set to identify an association peak. 467
The genotype data used for GWAS was also used for genomic selection. A 5-fold cross 468
validation was carried out to separate the data into training set and validation sets. Genomic 469
selection was done using Bayes A under the BGLR package in R (Perez and de los Campos, 470
2014). The number of burn-in iterations was set to 10,000 and the Gibbs sampler iteration was 471
set to 20,000. Accuracy was measured through the correlation between the GEBV versus the 472
realized S/F % trait value. 473
474
Data availability
475
All the raw data used in this study are publicly available. The sequencing raw reads have 476
been deposited in SRA under Bioproject PRJNA288621 and Accession ID of SRR2132870, 477
SRR2132879, SRR2132880, SRR2132872, SRR2132874, SRR2132884, SRR2132881, 478
SRR3110655, whereas the SNPs used in the array have been deposited in dbSNP under the 479
handle of SDTC_BB with NCBI submitted SNP (ss) accession numbers of 1810069240-480
1810592638. 481
482
Author Contributions
M
AN
US
CR
IP
T
AC
CE
PT
ED
19 Conceptualization, Q.B.K., C.K.T., A.L.O. and F.T.C.; Methodology, Q.B.K., C.K.T., A.L.O.; 484
Software, Q.B.K., A.L.O. and H.Y.H.; Formal Analysis, Q.B.K., C.K.T. and A.L.O., 485
Investigation Q.B.K., C.K.T.., A.L.O., H.Y.H. and H.L.L., Resources, M.M., A.S.; Data 486
Curation, Q.B.K, A.L.O. and J.Z.L.; Writing – Original Draft, Q.B.K, C.K.T and A.L.O.; 487
Writing – Review & Editing, H.Y.H, A.S., S.M., F.T.C, H.K., M.T. and D.R.A.; Visualization, 488
Q.B.K., A.L.O. and H.Y.H; Supervision, H.K., M.T. and D.R.A.; Project Administration, 489
Q.B.K., C.K.T., A.L.O.; Funding Acquisition, D.R.A. and H.K. 490
491
492
Acknowledgement
493
We will like to thank Breeding and Molecular Breeding Units of Sime Darby Plantation R&D 494
for their assistance in sample collection and DNA preparation, and the IT team for High 495
Performance Computing-related support. We will also like to thank DNALandmarks Inc., 496
Canada for their sequencing and genotyping service. In addition, we will like to thank Prof. 497
Jennifer Ann Harikrishna from Institute of Biological Sciences, Faculty of Science, Universiti 498
Malaya for reviewing this manuscript.
M
AN
US
CR
IP
T
AC
CE
PT
ED
20
References
US Department of Agriculture (2015). Global consumption of vegetable oils from 1995/1996 to 2014/2015, by oil type (in million metric tons).
Aulchenko, Y.S., Ripke, S., Isaacs, A., and van Duijn, C.M. (2007). GenABEL: an R library for genome-wide association analysis. Bioinformatics 23:1294-1296.
Barcelos, E., Amblard, P., Berthaud, J., and Seguin, M. (2002). Genetic diversity and relationship in American and African oil palm as revealed by RFLP and AFLP molecular markers. Pesquisa Agropecuária Brasileira 37:1105-1114.
Beirnaert, A., and Vanderweyen, R. (1941). Contribution à l’étude génétique et biométrique des variétiés d’Elaeis guineensis Jacq. In: Publ. Inst. Nat. Etude Agron. Congo Belge. Ser. Sci. . 1-101.
Billotte, N., Risterucci, A.M., Barcelos, E., Noyer, J.L., Amblard, P., and Baurens, F.C. (2001). Development, characterisation, and across-taxa utility of oil palm (Elaeis guineensis Jacq.) microsatellite markers. Genome 44:413-425.
Blaak, G., Sparnaaij, L.D., and Menendez, T. (1963). Methods of bunch analysis. In: Breeding and inheritance in the oil palm (Elaeis guineensis Jacq.) Part II: J.W. Afr. Ins. Oil Palm Res. 146 - 155.
Breure, C.J., and Menendez, T. (1990). The determination of bunch yield components in the development of inflorescences in oil palm (Elaeis guineensis). Experimental Agriculture 26:99-115.
Chen, H., Patterson, N., and Reich, D. (2010). Population differentiation as a test for selective sweeps. Genome research 20:393-402.
Chen, H., Xie, W., He, H., Yu, H., Chen, W., Li, J., Yu, R., Yao, Y., Zhang, W., He, Y., et al. (2014). A high-density SNP genotyping array for rice biology and molecular breeding. Molecular plant 7:541-553.
Conesa, A., and Gotz, S. (2008). Blast2GO: A comprehensive suite for functional analysis in plant genomics. International journal of plant genomics 2008:619832.
Corley, R.H.V., and Tinker, P.B. (2003). Selection and breeding. In: The Oil Palm Blackwell. 133 - 187.
Davidson, L. (1991). Management for efficient cost-effective and productive oil palm plantations. In: International Palm Oil Conference Kuala Lumpur: Palm Oil Research Insititute of Malaysia. 153 - 167.
Ganal, M.W., Durstewitz, G., Polley, A., Berard, A., Buckler, E.S., Charcosset, A., Clarke, J.D., Graner, E.M., Hansen, M., Joets, J., et al. (2011). A large maize (Zea mays L.) SNP genotyping array: development and germplasm genotyping, and genetic mapping to compare with the B73 reference genome. PloS one 6:e28334.
Goddard, M.E., and Hayes, B.J. (2007). Genomic selection. J Anim Breed Genet 124:323-330. Hardon, J.J., Corley, R.H.V., and Lee, C.H. (1987). Breeding and selecting the oil palm. London:
Academic Press.
Hardon, J.J., Rao, V., and Rajanaidu, N. (1985). A review of oil-palm breeding. In: Progress in Plant Breeding--Russell, G.E., ed. London: Butterworths. 139-163.
M
AN
US
CR
IP
T
AC
CE
PT
ED
21
Hartley, C.W.S. (1967b). Factors affecting growth, flowering and yield. In: The Oil Palm London: Longman. 137 - 193.
Hartley, C.W.S. (1967c). The origin and development of the oil palm industry. In: The Oil Palm London: Longman. 1 - 36.
Hartley, C.W.S. (1988). The Oil Palm. London: Longman.
Houston, R.D., Taggart, J.B., Cezard, T., Bekaert, M., Lowe, N.R., Downing, A., Talbot, R., Bishop, S.C., Archibald, A.L., Bron, J.E., et al. (2014). Development and validation of a high density SNP genotyping array for Atlantic salmon (Salmo salar). BMC genomics 15:90. Huang, X., Wei, X., Sang, T., Zhao, Q., Feng, Q., Zhao, Y., Li, C., Zhu, C., Lu, T., Zhang, Z., et al.
(2010). Genome-wide association studies of 14 agronomic traits in rice landraces. Nat Genet 42:961-967.
Jagoe, R.B. (1952). The dumpy oil palm Malay. Agric. J. 35:12.
Kim, J., Cho, S., Caetano-Anolles, K., Kim, H., and Ryu, Y.C. (2015). Genome-wide detection and characterization of positive selection in Korean Native Black Pig from Jeju Island. BMC Genet 16:3.
Li, H., and Durbin, R. (2010). Fast and accurate long-read alignment with Burrows-Wheeler transform. Bioinformatics 26:589-595.
Li, H., Handsaker, B., Wysoker, A., Fennell, T., Ruan, J., Homer, N., Marth, G., Abecasis, G., Durbin, R., and Genome Project Data Processing, S. (2009). The Sequence
Alignment/Map format and SAMtools. Bioinformatics 25:2078-2079.
Mayes, S., Jack, P.L., and Corley, R.H.V. (2000). The use of molecular markers to investigate the genetic structure of an oil palm breeding programme. Heredity 85:288-293.
McCue, M.E., Bannasch, D.L., Petersen, J.L., Gurr, J., Bailey, E., Binns, M.M., Distl, O., Guerin, G., Hasegawa, T., Hill, E.W., et al. (2012). A high density SNP array for the domestic horse and extant Perissodactyla: utility for association mapping, genetic diversity, and phylogeny studies. PLoS genetics 8:e1002451.
Meunier, J., Renard, J.L., and Quillec, G. (1979). Heredity of resistance to Fusarium wilt in the oil palm Elaeis guineensis Jacq. . Oleagineux 34:555 - 561.
Meuwissen, T.H., Hayes, B.J., and Goddard, M.E. (2001a). Prediction of total genetic value using genome-wide dense marker maps. Genetics 157:1819-1829.
Meuwissen, T.H.E., Hayes, B.J., and Goddard, M.E. (2001b). Prediction of Total Genetic Value Using Genome-Wide Dense Marker Maps. Genetics 157:1819-1829.
Mohd, D., Rajanaidu, N., Kushairi, A., Mohd Rafii, Y., Mohd Isa, Z.A., and Noh, A. (2002). PS4-high carotene E. oleifera planting materials. MPOB Information Series 154.
Moon, Y.H., Jung, J.Y., Kang, H.G., and An, G. (1999). Identification of a rice APETALA3 homologue by yeast two-hybrid screening. Plant molecular biology 40:167-177.
Paradis, E., Claude, J., and Strimmer, K. (2004). APE: Analyses of Phylogenetics and Evolution in R language. Bioinformatics 20:289-290.
Perez, P., and de los Campos, G. (2014). Genome-wide regression and prediction with the BGLR statistical package. Genetics 198:483-495.
M
AN
US
CR
IP
T
AC
CE
PT
ED
22
Rajanaidu, N. (1986a). Elaeis oleifera collection in Central and South America. In: Workshop on Oil Palm Germplasm and Utilization Bangi: Palm Oil Research Institute of Malaysia. 84 - 94.
Rajanaidu, N. (1986b). The oil palm (Elaeis guineensis) collection in Africa In: Workshop on Oil Palm Germplasm and Utilization Bangi: Palm Oil Research Institute of Malaysia. 59 -83. Rao, V., Soh, A.C., Corley, R.H.V., Lee, C.H., Rajanaidu, N., Tan, Y.P., Chin, C.W., Lim, K.C., Tan,
S.T., Lee, T.P., et al. (1983). A critical reexamination of the method of bunch analysis in oil palm breeding. Palm Oil Research Institute Malaysia Occ Paper 9:1 - 28.
Resende, M.F., Jr., Munoz, P., Resende, M.D., Garrick, D.J., Fernando, R.L., Davis, J.M., Jokela, E.J., Martin, T.A., Peter, G.F., and Kirst, M. (2012). Accuracy of genomic selection
methods in a standard data set of loblolly pine (Pinus taeda L.). Genetics 190:1503-1510. Rosenquist, E.A. (1986). The genetic base of oil palm breeding populations. In: The
International Workshop on Oil Palm Germplasm and Ultilization.
Rosenquist, E.A. (1990). An overview of breeding technology and selection in Elaeis guineensis. In: International Oil Palm Development Conference - Agriculture Kuala Lumpur: Palm Oil Research Institute Malaysia. 5 - 25.
Saitou, N., and Nei, M. (1987). The neighbor-joining method: a new method for reconstructing phylogenetic trees. Molecular biology and evolution 4:406-425.
Shah, F.H., Rashid, O., Simons, A.J., and Dunsdon, A. (1994). The utility of RAPD markers for the determination of genetic variation in oil palm (Elaeis guineensis). Theoret. Appl.
Genetics 89:713-718.
Singh, R., Low, E.T., Ooi, L.C., Ong-Abdullah, M., Ting, N.C., Nagappan, J., Nookiah, R.,
Amiruddin, M.D., Rosli, R., Manaf, M.A., et al. (2013a). The oil palm SHELL gene controls oil yield and encodes a homologue of SEEDSTICK. Nature 500:340-344.
Singh, R., Ong-Abdullah, M., Low, E.-T.L., Manaf, M.A.A., Rosli, R., Nookiah, R., Ooi, L.C.-L., Ooi, S.-E., Chan, K.-L., Halim, M.A., et al. (2013b). Oil palm genome sequence reveals
divergence of interfertile species in Old and New worlds. Nature 500:335-339. Soh, A.C., Vanialingam, T., Taniputra, B., Pamin, K. (1981). Derivatives of the dumpy palm -
some experimental results. The Planter 57:227 - 239.
Teh, C.K., Ong, A.L., Kwong, Q.B., Apparow, S., Chew, F.T., Mayes, S., Mohamed, M., Appleton, D., and Kulaveerasingam, H. (2016). Genome-wide association study identifies three key loci for high mesocarp oil content in perennial crop oil palm. Sci Rep 6:19075.
Ting, N.-C., Noorhariza, M.Z., Rozana, R., Low, E., -T.,, Maizura, I., Cheah, S.-C., Tan, S.-C., and Singh, R. (2010). SSR mining in oil palm EST database: application in oil palm germplasm diversity studies. J. Genet. 89:135 - 145.
Ting, N.C., Jansen, J., Mayes, S., Massawe, F., Sambanthamurthi, R., Ooi, L.C., Chin, C.W., Arulandoo, X., Seng, T.Y., Alwee, S.S., et al. (2014). High density SNP and SSR-based genetic maps of two independent oil palm hybrids. BMC genomics 15:309.
Voorrips, R.E. (2002). MapChart: software for the graphical presentation of linkage maps and QTLs. The Journal of heredity 93:77-78.
Wahid, M.B., Siti Nor Akmar, A., and Henson, I.E. (2004). Oil palm-Achievements and potential. In: The 4th International Crop Science Congress.
M
AN
US
CR
IP
T
AC
CE
PT
ED
23
Genotyping of Single-Nucleotide Polymorphisms in the Human Genome. Science 280:1077-1082.
Wong, C.K., and Bernardo, R. (2008). Genomewide selection in oil palm: increasing selection gain per unit time and cost with small populations. TAG. Theoretical and applied genetics. Theoretische und angewandte Genetik 116:815-824.
Xu, X., Liu, X., Ge, S., Jensen, J.D., Hu, F., Li, X., Dong, Y., Gutenkunst, R.N., Fang, L., Huang, L., et al. (2012). Resequencing 50 accessions of cultivated and wild rice yields markers for identifying agronomically important genes. Nature biotechnology 30:105-111. Yu, H., Xie, W., Li, J., Zhou, F., and Zhang, Q. (2014). A whole-genome SNP array (RICE6K) for
genomic breeding in rice. Plant biotechnology journal 12:28-37.
Zheng, X., Levine, D., Shen, J., Gogarten, S.M., Laurie, C., and Weir, B.S. (2012). A high-performance computing toolset for relatedness and principal component analysis of SNP data. Bioinformatics 28:3326-3328.
Zhou, Z., Jiang, Y., Wang, Z., Gou, Z., Lyu, J., Li, W., Yu, Y., Shu, L., Zhao, Y., Ma, Y., et al. (2015). Resequencing 302 wild and cultivated accessions identifies genes related to