1
Shifting the Goalposts? Analysing Changes to Performance Peer Groups Used to
Determine the Remuneration of FTSE100 CEOs
Rodion Skovoroda, Alistair Bruce
Nottingham University Business School, Nottingham University, Jubilee Campus, Wollaton
Road, Nottingham, NG8 1BB, UK
Corresponding author email: [email protected]
Abstract
This paper examines year-on-year changes to the composition of performance peer
groups used for Relative Performance Evaluation (RPE) in setting CEO pay in FTSE
100 companies and finds evidence of peer selection bias. We find that firms keep their
peer groups weak by excluding relatively stronger performing peers. We also show that
peer selection bias is less pronounced in firms with higher institutional investor
ownership, which suggests that institutional investors might be aware of the risks of
peer selection bias. The results suggest that peer group modifications can be viewed, at
least in part, as an expression of managerial rent-seeking.
2
1 INTRODUCTION
Stock-Based Compensation (SBC) has become an increasingly significant component of
executive reward for UK CEOs while the level of detail and complexity in the design of the
stock-based element of pay has increased considerably since the mid-1980s (e.g. Buck,
Bruce, Main, and Udueni, 2003; Conyon and Schwalbach, 2000; Goergen and Renneboog,
2011; Main, Bruce, and Buck, 1996; Ozkan, 2011; Renneboog and Zhao, 2011). Recent
empirical research documents widespread use of Relative Performance Evaluation (RPE) in
stock-based incentive contracts where CEOs and managers are evaluated on the basis of peer
performance and, in particular, the use of performance peer groups in restricted share
schemes, performance share plans, or long-term incentive plans (Carter, Ittner and Zechman
2009; Gong, Li, and Shin 2011). Empirical studies also document that stock-based RPE is
characterised by multiple discretionary elements and find considerable variations in specific
RPE characteristics and in their overall complexity across firms (Carter et al, 2009).
Agency theory (e.g. Holmstrom, 1979, 1982; Murphy, 1999) views performance-based pay in
general and SBC in particular as a key governance mechanism that helps foster incentive
alignment between the interests of executives and shareholders. Assuming that the
shareholders have complete control over the process of pay design, the potential efficiency
gains from using RPE in incentive contracts are well understood. Holmstrom (1979) shows
that the efficiency of performance-based pay as an incentive alignment mechanism crucially
depends on the amount of useful information that performance measures, such as the firm’s
stock price, conveys about CEO actions and about the quality of CEO decisions. Agency
3
effort, insulates risk-averse CEOs from non-firm-specific risks common to the firm’s peers,
and makes SBC more efficient (Holmstrom, 1982; Murphy, 1999).
Empirical evidence suggests that firms vary in their ability to maintain complete control over
the pay-setting process and that CEO pay outcomes are determined in part by the quality of
corporate governance at the firm (e.g. Armstrong, Ittner and Larcker 2012, Bertrand and
Mullainathan 2001, Garvey and Milbourn 2006). While RPE schemes may reduce pay
windfalls (pay unrelated to performance) and may foster strong pay-performance links under arm’s-length contracting, the relative efficiency of complex RPE schemes in creating and
maintaining strong pay-performance links is less clear in those firms where key elements of
RPE design, such as peer group composition, are influenced by powerful entrenched CEOs.
The risk is that the quality of information that the peer group, preferred by the CEO, may
convey about the true value of CEO actions to the firm could be compromised. If peer
selection is compromised and peer groups are chosen strategically, CEO pay windfalls could
be higher and value creating incentives could be lower under opaque RPE schemes than
under more transparent fixed-pay arrangements.
The purpose of this paper is to investigate empirically the potential sensitivity of stock-based
RPE schemes to opportunistic behaviour and rent-extraction by UK CEOs. This focus is close
to that of the managerial power perspective on pay (Bebchuk and Fried, 2003, 2004, 2005)
that argues that complex and opaque incentive schemes in particular are vulnerable to
obfuscation by entrenched managers. As such, rather than being a part of the solution, the
preference towards RPE schemes in weakly governed firms could itself be the manifestation
of the problem of asymmetric information and ‘hidden action’ that incentive schemes are
4
length contracting over CEO pay, it is, nevertheless, a part of the broad agency view that
suggests that powerful CEOs with privileged information may seek to abuse their power at
the expense of shareholders.
This paper provides the first detailed examination of year-on-year changes to the composition
of performance peer groups in large UK firms and reports a significant bias in the peer
selection process. First, using data on FTSE 100 firms from 2005-2011, we show that a
significant minority of large UK firms keep their peer groups weak by excluding relatively
stronger performing firms, where (stock price) performance is measured relative to the rest of
the peer group. Second, we show that peer selection bias is less pronounced in firms with
higher institutional investor ownership, which suggests that institutional investors might be
aware of the risks of peer selection bias.
The paper is structured as follows. Section 2 develops the theoretical perspectives on the role
of RPE in CEO pay as, alternatively, underpinning or undermining corporate governance, and
explains the institutional/regulatory landscape in the UK in relation to remuneration design
and disclosure. Section 3 develops specific testable hypotheses regarding the impact of
deliberate modifications of the composition of peer groups. Section 4 describes the data
collection process. Section 5 details the results of the analysis and Section 6 interprets the
significance of the results and offers some concluding remarks.
2 LITERATURE AND CONTEXT
2.1 Literature
A central component of the rent-extraction theory of CEO pay (Bebchuk and Fried 2003,
5
the total cost of the pay package by making pay schemes more complex and opaque, in part
to manage the risk of potentially damaging public ‘outrage’. Stock-based RPE components
such as performance share plans and long-term incentive plans are among the most complex
elements of CEO pay (Carter et al, 2009). The composition of bespoke performance peer
groups is, in turn, one of the least standardized elements of incentive plan design. As such,
where boards display ‘pay camouflage’ tendencies, they may consider deliberate
modifications to performance peer groups as a potentially attractive vehicle for
rent-extraction.
In an early study, using a cross-section of US-based companies, Lewellen, Park, and Ro (1996) found evidence that management overstated their firms’ relative performance by
choosing industry and peer-company comparative performance benchmarks, and broader
market indices, that are negatively biased. Whilst the performance benchmarks studied by
Lewellen et al were used for disclosure purposes and did not directly affect the levels of top
executive pay, in this study, by contrast, we explore relative performance bias in performance
peer groups that are used for incentive-based pay, with a potential first order effect on pay in UK firms. This focus is closer to that of Camara (2001) who compares relative with absolute
performance-based vesting hurdles, identifying a correlation between the former and
increased risk and dividend payments.
The scope for abuse of peer selection bias is, arguably, greater in “bespoke” peer group plans,
where group members are hand-picked by the firm, rather than in broader and more objective “index-based” peer group plans. Carter et al (2009) analyse a cross-section of FTSE 350
firms in 2002 and find that firms that use, alternatively, bespoke and index-based peer groups
6
cross-sectional tests employed in Carter et al’s study result in high standard errors of the estimates that are likely caused by large between-firm variation. Ferri (2009) further
recommends a panel data analysis or analysis of year-on-year changes in peer group
composition as a means of offering lower standard errors and providing more powerful
statistical insights, which is the methodology that we employ in this paper. Gong, Li, and
Shin (2011) analyse performance peer group data disclosed by S&P 1500 firms immediately
after the SEC introduced new disclosure rules in 2006. Gong et al report evidence that US
firms select peers that better capture common risks in accordance with agency theory and the
optimal contracting hypothesis. They also find evidence of peer selection bias: using
analysts’ forecasted annual stock returns, they show that firms with lower expected
industry-adjusted stock returns are more likely to be included as peers. Gong et al do not investigate the extent to which the strength of peer selection bias varies across firms that are governed
relatively strongly or weakly. Furthermore, the extent to which US boards have continued
abusing apparent selection bias after 2006, or, have alternatively ended this practice under
increased public scrutiny, enabled by better disclosure, remains underexplored. By way of
comparison, we focus here on large FTSE 100 firms that have been required to publicly disclose the composition of performance peer groups since the introduction of the Directors’
Remuneration Report Regulations in 2002 (Carter et al 2009). As FTSE 100 firms are particularly closely followed by analysts and investors, our sample selection if anything,
mitigates against self-serving peer selection.
Our research embodies a number of distinctive features. First, we study actual subsequent
stock price performance of peer group members, not analyst forecasts at the award date, as
employed in Gong et al, (2011). This could be important if the boards of directors benefit
7
Ravina and Sapienza, 2010), or, equally, where decisions are made with the benefit of
hindsight. Second, we use relative performance tests of selection bias where excluded/added peers’ performance is compared to the rest of the peer group, rather than the industry average
as in prior research. While industry-average performance benchmarks are relevant, our
methodology is relatively more robust to the presence of unobserved heterogeneity in RPE
design across the firms. Third, we investigate the extent to which peer selection bias varies
across firms that are governed relatively strongly or weakly.
This paper also contributes to a wider literature on a range of practices by which executives
may manipulate pay structures and outcomes. As well as option backdating (see, for example,
Bebchuk, Grinstein, and Peyer, 2010) these include the opportunistic (retroactive) timing of
executive stock option grants, option repricing (downward adjustment of the strike price of ‘under water’ options), withholding of sensitive information, and ‘golden parachutes’. In this
context, richer understanding of the role of performance peer groups and their deliberate
modification, on CEO pay, represents an important contribution at a time when CEO pay
remains under intense scrutiny by shareholders and regulators.
2.2 Institutional Context
In the UK context, reward based on relative performance was endorsed by the Greenbury
Committee (1995). This reflected contemporary concern that, especially in buoyant equity
markets, pay arrangements which featured a significant component of “naked”, rather than
peer-adjusted, stock-based compensation tended to deliver excessive and unwarranted levels
of individual reward. The Greenbury Committee’s endorsement was instrumental in the
increasing complexity of pay arrangements, as well as in the subsequent popularity of Long
8
the two, based on comparative performance over (usually) a three year period. Awards are
invariably based on increased performance as measured by a combination of Total
Shareholder Return (TSR) in real terms and/or relative to an index or performance peer group
and an accounting based measure or measures (generally Earnings Per Share (EPS) growth).
Our analysis of Directors’ Remuneration Reports suggests that, whilst awards require parallel
achievement of the market-based and based performance thresholds,
accounting-based measures, with rare exceptions, are not subject to comparison with a performance peer
group and typically require a specified rate of real increase in value (e.g. RPI + 2% for EPS
growth targets). For instance, all 42 FTSE 100 boards that were identified as using bespoke
peer groups in 2011 were using peers’ TSR to help ascertain the proportion of vested
performance shares. In comparison, in only two firms from this list, BP and Royal Dutch
Shell, the proportion of vested performance shares was also linked to the reporting firm’s
rank against peers on other measures that were used alongside TSR – the reserves
replacement ratio (BP), and hydrocarbon production, net cash from operating activities, and
EPS growth (Royal Dutch Shell). This justifies our focus on peers’ TSR performance in
particular.
While the proportion of vested RPE shares depends on the reporting firm’s relative rank,
median peer performance and closely related measures, such as mean peer performance, are
often used by the firms in our sample as minimum performance thresholds. In 31 of the 42
firms that were using bespoke peer groups in 2011, none of the performance shares vested unless the reporting firm’s TSR was at the median of the peer group. In nine firms, the
performance shares did not vest unless the reporting firm’s TSR was equal to that of the
index composed from peer group constituents. In two firms, Vodafone and Sage Group, the
9
take into account peer performance. The level of vesting was then determined by using a “multiplier” that scaled with the firms’ relative TSR performance. In Sage Group, the
multiplier was equal to 0.75 for below median and was equal to 1 for median performance. In
Vodafone, as the 2011 AR suggests, “There will be no multiplier until TSR performance exceeds median.” In all cases, therefore, the median peer TSR performance represents an
important RPE threshold. A failure to beat the median peer significantly affects the expected
RPE payoffs.
Successive versions of the UK Corporate Governance Code (`the Code’) have required a
greater degree of transparency and disclosure in reporting pay arrangements in general. In
relation to the period under scrutiny in this study, the Code forms one of the two sets of
recommendations or requirements which influenced the disclosure of details of remuneration
policy. The Code acknowledges the principle of comparing a company’s performance with its
peers in determining levels of pay, and endorses approval of such arrangements by
shareholders, but it is non-prescriptive in tone and merely urges that companies ‘should use
such comparisons with caution’. Ultimately, in any case, the Code is non-binding and
companies engage with its recommendations on a ‘comply or explain’ basis. By contrast, the regulations for quoted companies’ remuneration reports within the Companies Act (2006)
carry legal force and require publication of and explanations for the choice of performance
conditions employed, albeit in the non-audited part of the report, and without specific
guidance as to what constitutes an acceptable level of explanation. Prior to 2013, as part of
the overall remuneration policy, these details would be subject to a non-binding shareholder
vote. In the absence of a binding shareholder vote and with significant discretion available to
firms in terms of the degree of disclosure of performance comparison arrangements, this
10
executives who may have been in a position to influence the remuneration committee. On the
specific issue of influence, the Code observes, rather weakly: ‘where executive directors …..
are involved in advising or supporting the remuneration committee, care should be taken to recognise and avoid conflicts of interest’.
Since 2013, the requirements have tightened significantly, with companies’ remuneration
policy requiring endorsement by shareholders in a binding vote held at least every three
years, together with an annual advisory vote on the implementation report, which details how
policy translates into detail within a given year. It would appear, therefore, that increased
disclosure, coupled with the need for shareholder approval, and stronger and more
independent non-executive directors, have the potential to constrain some of the more direct
means by which CEOs might be able to inflate their pay and extract rents in future.
3 HYPOTHESES
To the extent that incentives to manipulate peer groups exist, how exactly could boards use
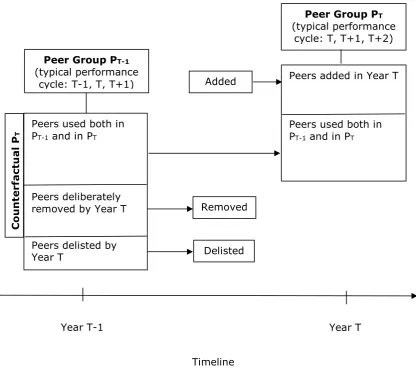
their discretion opportunistically? Figure 1 illustrates this. Deliberate modifications of the
composition of peer groups may include instances where weaker peers, viewed as likely to
underperform, are added to the group. Alternatively, peers that are expected to outperform the
group can be removed. These scenarios require a degree of insider knowledge / superior information on the part of the reporting firm’s directors (e.g. Ravina and Sapienza, 2010).
Additionally, peer group modifications can be applied ex-post with the benefit of hindsight as reported performance periods often commence 2 to 10 months prior to the first published
details of peer groups in annual reports. As such, boards can add/remove peers based on their
performance in the months directly preceding the public announcement of peer group
11
boards of directors may make adjustments to the peer groups after the public announcement of peer group composition if events such as takeovers and delistings of peer group members
during the performance period warrant such changes. When a delisted firm is removed from
the group entirely, group TSR is unaffected by the firm’s share price prior to delisting. So
instead of, say, substituting the delisted peer from the last month of trading onwards with a
synthetic TSR index equal to the average TSR of the rest of the peer group, a decision could
be made to completely remove a delisted peer from the peer group depending on the peer’s
performance prior to the delisting. This might result in weaker relative performance
benchmarks and overstated relative performance. The above analysis suggests that a minority
of opportunistic CEOs might have both the incentive and ability to use peer group
modifications for rent-extraction. Accordingly, we propose:
Hypothesis 1: Deliberate modifications to performance peer group composition exhibit, on average, peer selection bias whereby weaker peers are added to the peer groups and stronger
12 Figure 1. Year-on-Year Changes in Peer Group Composition
The empirical literature documents that CEO pay outcomes are determined in part by the
quality of corporate governance at the firm (e.g. see Armstrong, Ittner and Larcker (2012),
Bebchuk et al (2010)), Bertrand and Mullainathan (2001), Garvey and Milbourn (2006)). A significant literature identifies institutional shareholders as a potent corporate governance
mechanism that can influence CEO decisions. They have the incentive (via large ownership
stakes) and the resources to monitor CEOs, and the means to influence CEO decisions (e.g.
Peer Group PT
(typical performance cycle: T, T+1, T+2)
Year T
Peers added in Year T
Peers used both in PT-1 and in PT Peer Group PT-1
(typical performance
cycle: T-1, T, T+1) Added
Peers used both in PT-1 and in PT
Peers deliberately removed by Year T
Peers delisted by
Year T Delisted
Removed
Timeline Year T-1
Coun
ter
fa
ct
u
a
l
13
via threats to sell their shares); see, among others, Becht et al (2010), Chung, Firth and Kim (2002), Ertimur et al (2011), Gillan and Starks (2007), Hartzell and Starks (2003).
The monitoring-enhancing effects of board independence and, in particular, the effects of the
proportion of independent (non-executive) directors and a split of the roles of Chairman and
CEO on pay outcomes are the subject of a substantial interdisciplinary literature (e.g. Conyon
and Peck (1998), Daily, Johnson, Ellstrand and Dalton (1998), Finkelstein and Hambrick
(1989)). Empirical evidence shows that weaker boards tend to reward CEOs for ‘lucky’ events outside of CEOs’ control more often than stronger boards do (Bertrand &
Mullainathan, 2001; Garvey and Milbourn, 2006), while board independence is often
associated with lower levels of CEO pay (e.g. Core, Holthausen, and Larcker, 1999) and with stronger pay-performance links (e.g. Rayan and Wiggins, 2004; Goh and Gupta, 2010).
Board theorists warn, however, that independent boards may suffer from information
problems: non-executive directors, lacking the incentives and skills to monitor CEOs, may
depend on the CEOs for key information (Ezzamel and Watson, 2005). Accordingly, we
propose:
Hypothesis 2: The tendency for deliberate peer group modifications to result in weaker peer groups is more pronounced in firms characterised by less independent boards and weaker
investor oversight.
4 DATA AND METHODOLOGY
We study the use of performance peer groups in CEO pay arrangements in FTSE 100
companies for a seven-year period (2005-2011). The sample is formed from companies
included in the FTSE 100 list in 2007 and the full list of companies is provided in Supporting
14
including the composition of performance peer groups, are drawn from annual reports. Data
on firm-specific corporate governance variables, ownership and financial data are sourced
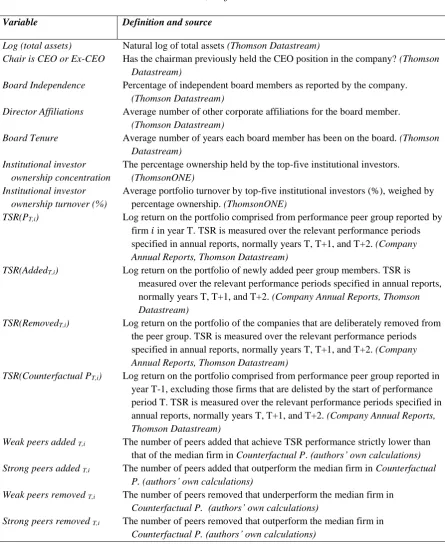
from Thomson Datastream, ThomsonONE, and annual reports. Table 1 summarizes and
[image:14.595.75.521.222.767.2]provides the definitions of all variables used in the analysis.
Table 1. Variables, Definitions and Sources
Variable Definition and source
Log (total assets) Natural log of total assets (Thomson Datastream)
Chair is CEO or Ex-CEO Has the chairman previously held the CEO position in the company? (Thomson Datastream)
Board Independence Percentage of independent board members as reported by the company. (Thomson Datastream)
Director Affiliations Average number of other corporate affiliations for the board member. (Thomson Datastream)
Board Tenure Average number of years each board member has been on the board. (Thomson Datastream)
Institutional investor ownership concentration
The percentage ownership held by the top-five institutional investors. (ThomsonONE)
Institutional investor ownership turnover (%)
Average portfolio turnover by top-five institutional investors (%), weighed by percentage ownership. (ThomsonONE)
TSR(PT,i) Log return on the portfolio comprised from performance peer group reported by
firm 𝑖 in year T. TSR is measured over the relevant performance periods specified in annual reports, normally years T, T+1, and T+2. (Company Annual Reports, Thomson Datastream)
TSR(AddedT,i) Log return on the portfolio of newly added peer group members. TSR is
measured over the relevant performance periods specified in annual reports, normally years T, T+1, and T+2. (Company Annual Reports, Thomson Datastream)
TSR(RemovedT,i) Log return on the portfolio of the companies that are deliberately removed from
the peer group. TSR is measured over the relevant performance periods specified in annual reports, normally years T, T+1, and T+2. (Company Annual Reports, Thomson Datastream)
TSR(Counterfactual PT,i) Log return on the portfolio comprised from performance peer group reported in
year T-1, excluding those firms that are delisted by the start of performance period T. TSR is measured over the relevant performance periods specified in annual reports, normally years T, T+1, and T+2. (Company Annual Reports, Thomson Datastream)
Weak peers added T,i The number of peers added that achieve TSR performance strictly lower than
that of the median firm in Counterfactual P. (authors’ own calculations) Strong peers added T,i The number of peers added that outperform the median firm in Counterfactual
P. (authors’ own calculations)
Weak peers removed T,i The number of peers removed that underperform the median firm in
Counterfactual P. (authors’ own calculations)
Strong peers removed T,i The number of peers removed that outperform the median firm in
15
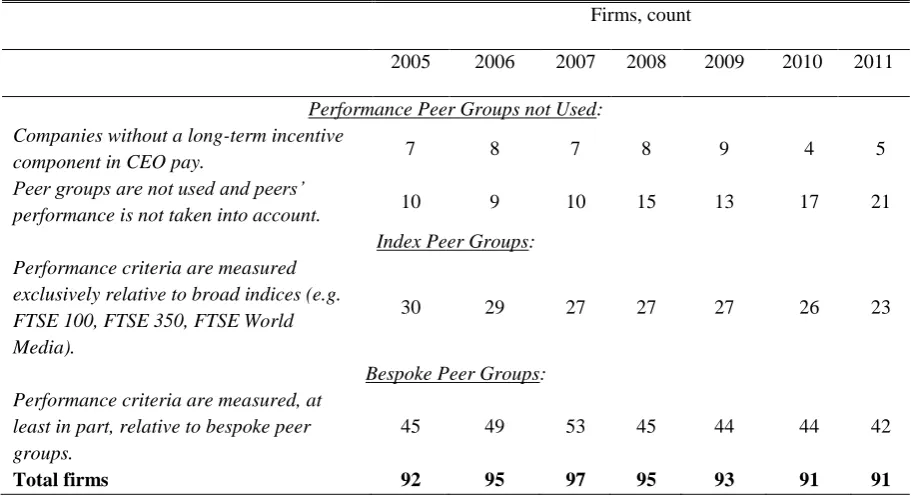
Table 2 reports that 70 to 80 percent of FTSE 100 firms use performance peer groups to help
determine CEO pay in any given year. Both Index Peer Groups (where performance criteria are measured exclusively relative to broad indices such as FTSE 100, FTSE 350, FTSE World
Media etc.) and Bespoke Peer Groups (where performance criteria are measured, at least in part, relative to bespoke peer groups) are widely used. The focus of our attention is on this second group, i.e. on identifying instances of deliberate modification of peer groups in the
[image:15.595.71.527.348.597.2]case of companies using bespoke peer groups.
Table 2. Use of Compensation Peer Groups in Long-Term CEO Pay, FTSE 100 Firms
Firms, count
2005 2006 2007 2008 2009 2010 2011
Performance Peer Groups not Used: Companies without a long-term incentive
component in CEO pay. 7 8 7 8 9 4 5
Peer groups are not used and peers’
performance is not taken into account. 10 9 10 15 13 17 21
Index Peer Groups: Performance criteria are measured
exclusively relative to broad indices (e.g. FTSE 100, FTSE 350, FTSE World Media).
30 29 27 27 27 26 23
Bespoke Peer Groups: Performance criteria are measured, at
least in part, relative to bespoke peer groups.
45 49 53 45 44 44 42
Total firms 92 95 97 95 93 91 91
4.1 Dependent variables
4.1.1 Peer Selection Bias
First, we analyse relative TSR performance of the added/removed peers to see if relatively
16
motivated by the analysis of Directors’ Remuneration Reports and is justified in Section 2.2.
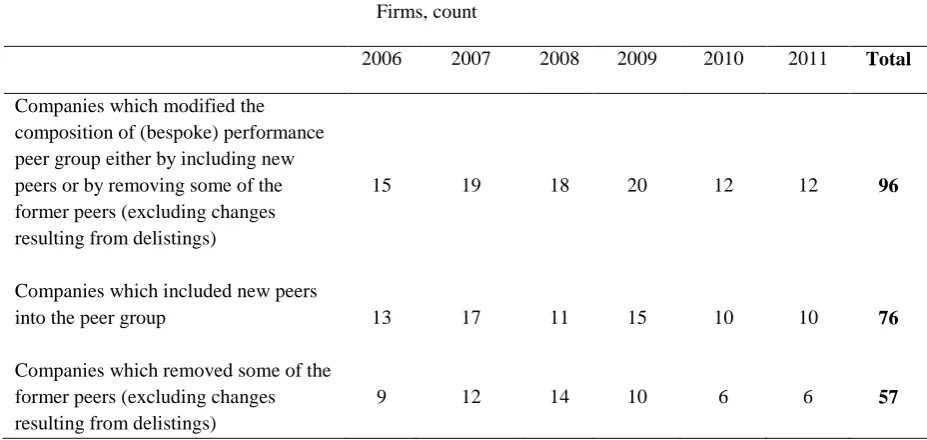
Table 3 reports instances of deliberate modification (year-on-year changes) of the
composition of bespoke peer groups, confirming that they are quite common. For instance, 20
(or 45%) of the 44 companies which used bespoke peer groups in 2009 initiated changes to
their peer groups. Of these 20 companies, 15 included new peers and 10 removed some of the
[image:16.595.70.534.322.542.2]existing peers (excluding delisting-related changes).
Table 3. Instances of Deliberate Modification of the Composition of Bespoke Peer Groups (Year-on-Year Changes), FTSE 100 Firms
Firms, count
2006 2007 2008 2009 2010 2011 Total
Companies which modified the composition of (bespoke) performance peer group either by including new peers or by removing some of the former peers (excluding changes resulting from delistings)
15 19 18 20 12 12 96
Companies which included new peers
into the peer group 13 17 11 15 10 10 76
Companies which removed some of the former peers (excluding changes resulting from delistings)
9 12 14 10 6 6 57
Note: As some firms modify the composition of peer groups by both including new peers and by removing some of the old peers in the same year, the values in rows two and three do not necessarily sum to the value in row one.
With reference to Figure 1 and using notation PT for the performance peer group reported in year T, we define the portfolio AddedT as those companies that are newly included in PT but
which were not included in PT-1. Portfolio RemovedT is defined as those companies that were included in the peer group PT-1 but were then removed and so did not appear in peer group PT. The benchmark portfolio against which we compare portfolio AddedT is Counterfactual PT ,
17
period T. The benchmark portfolio for RemovedT is PT itself. We test for peer selection bias (Hypothesis 1) by testing whether the portfolio returns of RemovedT and AddedT are equal to
the returns on the respective benchmark portfolios PT and Counterfactual PT over the subsequent (usually three-year) performance period pertaining to PT. By comparing TSR of
AddedT to that of Counterfactual PT we are able to isolate and study the effect of the decision to add new peer group members. By comparing TSR of RemovedT to that of PT we are able to isolate and study the effect of the decision to remove peers.
Portfolio returns are calculated using monthly returns indices resourced from Thomson
Datastream as follows: (1) In all cases we use the relevant (in most cases, three-year)
performance periods specified in Annual Reports. (2) All portfolios are equally-weighted. (3)
The proceeds of delisted firms are reinvested (equally) across the remaining firms in the
portfolio. (4) In those cases where all firms in RemovedT are delisted before the end of the relevant performance period (pertaining to PT) portfolio returns on RemovedT and PT are
compared on the last month of RemovedT trading. (5) The end of the observation period is May 2013. (6) Monthly returns for foreign peers are calculated using equity prices
denominated in the home currency, rather than in GBP.
4.1.2 The Propensity to Modify the Composition of Bespoke Peer Groups
The second step in our analysis concerns the extent to which firm-level corporate governance
characteristics affect the boards’ propensity to add/remove weak/strong peers (Hypothesis 2).
With the view to differentiating across specific types of peer selection bias, we define Weak peers added as the number of peers added that achieve TSR performance which is strictly
18
reported in year T-1 net of firms delisted by year T). Strong peers added is defined as the number of peers added that outperform the median firm in Counterfactual P. Similarly, Weak
peers removed is the number of removed peers that underperform the median firm in Counterfactual P, while Strong peers removed is the number of removed peers that
outperform the median firm. The use of the median Counterfactual peer for performance benchmarking is motivated by the analysis of Directors’ Remuneration Reports and is
justified in Section 2.2. As before, TSR performance is measured over the relevant
performance period; normally years T, T+1, and T+2.
In the Amec example, discussed in Supporting Information, our calculations suggest that
seven of the fifteen firms that were deliberately removed from the peer group in 2011
performed weaker than the median firm in the counterfactual (old, 2010) peer group in the
period from April 2011 (start of the performance period) to May 2013 (end of observation
period), while eight removed firms outperformed the counterfactual median over the same
period. In contrast, fifteen firms that were added to the peer group in 2011 performed weaker
than the counterfactual median while not a single newly added peer managed to outperform
the counterfactual median (TSR data, sourced through Thomson Datastream, was available
for fifteen of the sixteen firms that were added to the peer group in 2011). Accordingly, for i = ‘Amec’ and t = ‘2011’, we wright Weak peers added i,t = 15, Strong peers added i,t = 0,
Weak peers removed i,t = 7, Strong peers removed i,t = 8. As a result of these changes, the performance of the new, 2011, peer group approved by the board was significantly weaker
than that of the counterfactual peer group that the board used one year earlier and that could have been easily “recycled”. Our estimations further suggest that if the peer group had not
been changed, the value of performance shares that could be expected to vest to Amec’s CEO
19
illustrates the effect that peer group selection/changes can have on a CEO’s final
remuneration and financial incentives. All relevant details (vesting scale, the proportion of
TSR-related vs. EPS-related performance awards) are carefully taken into account and are
made available in Supporting Information.
4.2 Independent variables
The percentage ownership held by the top-five institutional investors (Institutional investor
ownership concentration) is used as a proxy for institutional ownership (Hypothesis 2). Board independence proxies include the percentage of independent board members as
reported by the company (Board Independence), average board tenure (Board Tenure) and the dummy variable Chair is CEO or Ex-CEO, taking the value 1 if the chairman serves as the CEO or previously held the CEO position in the company and 0 otherwise. While the vast
majority of FTSE 100 boards split the roles of Chairman and CEO, a significant minority of
FTSE 100 Chairmen have previously held the position of CEO at the same firm. This type of
arrangement might both question the independence of the Chairman and suggest a degree of
shared tolerance for the practice of deliberate peer group weakening (see Andres et al 2014; Evans et al 2010).
4.3 Control (independent) variables
Instances of CEO pay manipulation have been shown to co-vary with firm size in a number
of different contexts. Heron and Lie (2009) show that option backdating is more likely to
occur in smaller firms. Bizjak et al (2011) report that smaller firms inflate CEO pay by
choosing relatively larger companies as compensation peers. Accordingly, we use the log of
total assets to control for firm size. Furthermore, we use the average number of corporate
20
Shivdasani, 2006; Larcker, So, and Wang, 2013; Renneboog and Zhao, 2011). Finally, we
control for average portfolio turnover of the top-five institutional investors (Institutional
investor ownership turnover), weighted by their percentage ownership, as a proxy for investor heterogeneity and heterogeneous investment horizons (Gaspar, Massa, and Matos
2005).
4.4 Descriptive Statistics
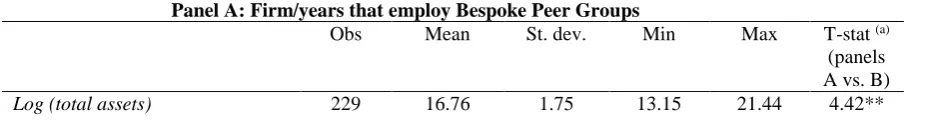
Table 4 reports descriptive statistics. Panel A summarises data for 2006-2011 across all firms
that employ bespoke peer groups. The regression analysis of year-on-year changes in peer
group composition leaves out year 2005. Panel B reports descriptive statistics for those firms
that either do not employ peer groups or use index peer groups. Together, these suggest that
firms in Panel A tend to be larger than firms in Panel B. This is in accordance with prior
research (Carter et al, 2009). Panel A is also characterised by relatively lower institutional investor ownership turnover, lower board tenure, and relatively more independent boards
with better connected (busier) directors. The t-statistics for the corresponding tests across the
two panels are reported and are statistically significant. An average bespoke peer group
includes close to 16 peers. This result is partially influenced by an outlier, Reed Elsevier,
which introduced a 125-strong peer group in 2010. If we exclude Reed Elsevier, the mean
peer group size drops to 15.6. We exclude Royal Bank of Scotland from Table 4 and from the
rest of the analysis on account of its majority ownership by the UK government. Including
[image:20.595.71.536.706.772.2]Royal Bank of Scotland tends to marginally strengthen results on peer selection bias.
Table 4. Descriptive Statistics, 2006-2011
Panel A: Firm/years that employ Bespoke Peer Groups
Obs Mean St. dev. Min Max T-stat (a)
(panels A vs. B)
21
Chair is CEO or Ex-CEO 229 0.09 0.28 0 1 0.99
Board Independence 229 62.30 11.00 23.08 93.75 4.51**
Director Affiliations 229 2.00 1.06 0.00 6.86 3.48**
Board Tenure 229 5.11 1.64 0.91 12 2.90**
Institutional investor ownership
concentration 229 0.21 0.08 0.07 0.46 1.74
Institutional investor ownership
turnover (%) 229 24.48 6.75 11.61 63.24 4.23**
Total number of peers in PT,i 229 16.11 9.77 4 125
Weak peers added T,i 229 0.61 1.80 0 15
Strong peers added T,I 229 0.39 1.23 0 11
Weak peers removed T,I 229 0.30 1.04 0 7
Strong peers removed T,I) 229 0.36 1.21 0 9
Panel B: Firm/years that do not employ Bespoke Peer Groups
Obs Mean St. dev. Min Max
Log (total assets) 252 16.10 1.51 12.43 21.22
Chair is CEO or Ex-CEO 252 0.06 0.24 0 1
Board Independence 252 57.67 11.46 33.33 100
Director Affiliations 252 1.70 0.80 0.18 4.5
Board Tenure 252 5.67 2.44 0.25 12.59
Institutional investor ownership
concentration 252 0.22 0.09 0.03 0.55
Institutional investor ownership
turnover (%) 252 26.90 5.76 13.71 59.06
Notes:.
a) ** - indicates significance at the 1% level; * - indicates significance at the 5% level
5 EMPIRICAL RESULTS
Statistical tests are organised as follows. We first test whether peer group modifications are
characterised by self-serving peer selection (Hypothesis 1). Second, we ascertain the degree
to which peer group modifications can be viewed as a product of managerial power and
firm-specific governance (Hypotheses 2).
[image:21.595.73.523.70.350.2]5.1 Peer Selection Bias
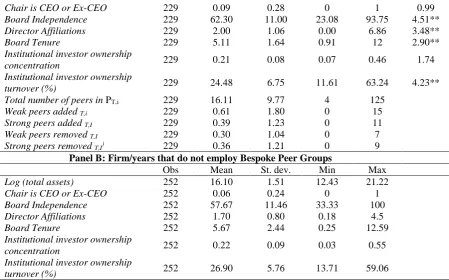
Table 5 reports 73 year/firm instances (𝑇, 𝑖) where reporting firm 𝑖 added new peers. These
new peers form AddedT,i. There are 55 year/firm instances where firms deliberately removed
peers; these make up RemovedT,i. We test if portfolio returns of RemovedT,i and AddedT,i are equal to returns on the benchmark portfolios PT,i and Counterfactual PT,i respectively. Table 5
22
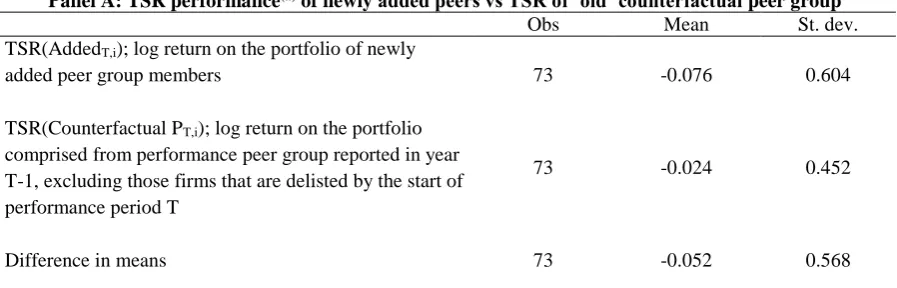
corresponding t-tests. The mean log return of AddedT,i peers is about 5 percentage points below the benchmark return, though this difference is not statistically significant against a
two-sided alternative. The mean log return on the portfolio of removed peers is about 15.4
percentage points higher than its benchmark return. This result is both highly significant
statistically and economically important. Including Royal Bank of Scotland increases the
sample size to 76 added and 57 removed and yields marginally lower p-values, strengthening
the results. Table 5 further reports the results of the Wilcoxon matched-pairs, signed-ranks
tests on median difference, a non-parametric test that does not assume that the difference in
matched pairs is normally distributed. The results of the Wilcoxon signed-ranks tests closely
[image:22.595.75.524.438.582.2]confirm the results of the t-tests. Accordingly, we accept Hypothesis 1; evidence suggests that peer group modifications display elements of peer selection bias.
Table 5. Portfolio Performance (Paired) tests
Panel A: TSR performance(a) of newly added peers vs TSR of ‘old’ counterfactual peer group
Obs Mean St. dev.
TSR(AddedT,i); log return on the portfolio of newly
added peer group members 73 -0.076 0.604
TSR(Counterfactual PT,i); log return on the portfolio
comprised from performance peer group reported in year T-1, excluding those firms that are delisted by the start of performance period T
73 -0.024 0.452
Difference in means 73 -0.052 0.568
T-test: H0: mean(TSR(AddedT,i)- TSR(Counterfactual PT,i))=0
t = -0.79 Pr=0.43
Wilcoxon signed-rank test: H0: median(TSR(AddedT,i)- TSR(Counterfactual PT,i))=0
Z = -.965 Pr=0.335
Panel B: TSR performance(a) of current peer group vs TSR of recently removed peers
Obs Mean St. dev.
TSR(RemovedT,i); log return on the portfolio of the
companies that are deliberately removed from the peer group
55 0.068 0.507
23
TSR(PT,i); log return on the portfolio comprised from
performance peer group reported in year T
Difference in means 55 0.154 0.497
T-test: H0: mean(TSR(RemovedT,i)- TSR(PT,i))=0
t = 2.30 Pr=0.026
Wilcoxon signed-rank test: H0: median(TSR(RemovedT,i)- TSR(PT,i))=0
Z = 2.807 Pr=0.005
Notes:
a) In all cases, TSR is measured over the relevant performance periods specified in annual reports, normally years T, T+1, and T+2 (i.e. subsequent to peer changes).
5.2 The Propensity to Modify the Composition of Bespoke Peer Groups
If peer selection bias is detected, can peer group modifications be viewed, at least in part, as
an expression of managerial power? Table 6 reports the results of negative binomial
regressions that analyse the count variables Weak peers added, Strong peers added, Weak
peers removed, and Strong peers removed. The negative binomial specification is appropriate where the count variable is characterised by overdispersion (or extra-Poisson variation). If
decisions to remove firms X and Y from the peer group are made on the basis of firms’
relative performance vis-a-vis the rest of the peer group, the two decisions are correlated.
These correlated events can give rise to overdispersion in modification counts. Further, all
models control for the lagged (log) peer group size, which is used as the offset with the
coefficient constrained to one. Standard errors are clustered for 52 clusters in firms.
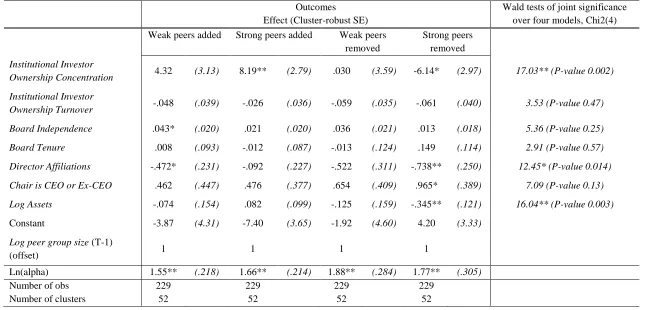
Results in Table 6 suggest that investor oversight (Institutional Investor Ownership
Concentration) has a differential effect on four types of modifications. While the rates with
which firms add new peers (both weak and strong) are higher in firms with stronger investor
oversight, higher Institutional Shareholder Ownership Concentration is negatively associated
Ex-24 CEO seems to be positively associated with all four types of modifications, and its effect on the propensity to remove stronger peers is statistically significant. The joint significance tests
on the effects of co-variates across the four models are reported in the far-right column in
Table 6. The effects of Board Independence are mixed and inconclusive as independent
boards are associated both with modifications that make peer groups weaker (Weak peers added) and stronger (Weak peers removed). Overall, the empirical evidence lends partial support to Hypothesis 2. The tendency on the part of the firms to exclude relatively stronger
performing peers, which we document empirically in the previous section, appears to be less
25 Table 6. The Propensity to Modify the Composition of Bespoke Peer Groups
FTSE 100 firms where performance criteria are measured, at least in part, relative to bespoke peer groups. Negative binomial regressions on pooled data 2006-2011. Standard errors are clustered for 52 clusters in firms. Dependent variables are defined as follows. Weak peers added T,i is the number of peers added that achieve TSR performance
strictly lower than that of the median firm in the counterfactual peer group (defined as the peer group reported in year T-1 excluding firms delisted by year T). Strong peers added T,i is the number of peers added that outperform the median firm in the counterfactual peer group. Weak peers removed T,i is the number of peers removed that
underperform the median firm in the counterfactual peer group. Strong peers removed T,i is the number of peers removed that outperform the median firm in the
counterfactual peer group. TSR performance is measured over the relevant performance period; normally years T, T+1, and T+2.
Outcomes Effect (Cluster-robust SE)
Wald tests of joint significance over four models, Chi2(4)
Weak peers added Strong peers added Weak peers removed
Strong peers removed
Institutional Investor
Ownership Concentration 4.32 (3.13) 8.19** (2.79) .030 (3.59) -6.14* (2.97) 17.03** (P-value 0.002)
Institutional Investor
Ownership Turnover -.048 (.039) -.026 (.036) -.059 (.035) -.061 (.040) 3.53 (P-value 0.47)
Board Independence .043* (.020) .021 (.020) .036 (.021) .013 (.018) 5.36 (P-value 0.25)
Board Tenure .008 (.093) -.012 (.087) -.013 (.124) .149 (.114) 2.91 (P-value 0.57)
Director Affiliations -.472* (.231) -.092 (.227) -.522 (.311) -.738** (.250) 12.45* (P-value 0.014)
Chair is CEO or Ex-CEO .462 (.447) .476 (.377) .654 (.409) .965* (.389) 7.09 (P-value 0.13)
Log Assets -.074 (.154) .082 (.099) -.125 (.159) -.345** (.121) 16.04** (P-value 0.003)
Constant -3.87 (4.31) -7.40 (3.65) -1.92 (4.60) 4.20 (3.33)
Log peer group size (T-1)
(offset) 1 1 1 1
Ln(alpha) 1.55** (.218) 1.66** (.214) 1.88** (.284) 1.77** (.305)
Number of obs 229 229 229 229
Number of clusters 52 52 52 52
26
As far as control variables are concerned, boards with more Director Affiliations (a proxy for board networks and for ‘busy boards’) are found to be negatively associated with all four
types of peer group modifications. The joint effect of Director Affiliations in the four regressions, Table 6, is statistically significant (p<0.05) which suggests that busy boards
generally implement fewer changes. Finally, the proxy for firm size (Log Assets) is
negatively associated with modifications that remove peers and its effect on the propensity to
remove stronger peers is statistically significant. While examining board governance, we also
analysed the effect of compensation (remuneration) committee independence (e.g.
Faulkender and Yang, 2010), i.e. the percentage of independent board members on the
compensation committee as reported by the company. The effect of compensation committee
independence was not statistically significant.
To ensure that our results are not driven by heterogeneity in capabilities and incentives across
institutional monitors (Almazan, Hartzel and Starks 2005), we followed Shin and Seo (2011)
and classified the top-five institutional owners into five categories - Banks, Insurance Companies, Pension Funds, Endowments and Foundations, and Mutual Funds using the investor classification available in ThomsonONE. This reveals that most top-five institutional
owners in our data are mutual funds and the correlation coefficient between Institutional investor ownership concentration and share ownership held by mutual funds is 0.98. The
regression results and statistical inference are robust to the use of share ownership held by
mutual funds as an alternative proxy for ownership concentration.
5.3 Discussion
This study reports evidence that peer group adjustments are used by (some) CEOs to extract
27
rent extraction regressions in Table 6 raise interesting questions. In seeking to understand
these results, it is important to be clear that this study does not control for multiple alternative
ways of rent extraction that could be potentially open to abuse in weak boards. The lack of
evidence on the moderating effect of board independence on rent extraction via a particular
medium does not imply increased rent extraction in aggregate, and may in fact be consistent
with lower aggregate extraction, where there is substitution between different forms of rent
capture. To develop this line of reasoning, it may be the case that with relatively weak,
compliant boards, CEOs are able to extract rent from the organisation without having to
resort to practices such as peer group adjustment, which requires investment of time and
careful judgement and which cannot, in any case, be guaranteed to deliver the intended
outcomes. So, for example, to the extent that CEOs with weak boards are able to extract rent
more straightforwardly via increased salaries or annual bonuses, one might expect that
practices such as the addition of weak peers to performance groups would be confined to
cases where board vigilance was robust in relation to the more obvious rent extraction
measures.
Second, the analysis of year-on-year changes to the composition of bespoke peer groups in
this study does not examine the (dynamic) self-selection of firms into those that use bespoke
peer groups for benchmarking and those that use “index only” peer groups. This is mostly
due to the data restrictions. There are ten firm-year cases in the data where firms stopped
using index peer groups and started using bespoke peer groups (there are six cases where
firms started using index peer groups in lieu of bespoke peer groups), which would not
28
6 CONCLUSION AND POLICY IMPLICATIONS
The results suggest that peer group modifications can be viewed, at least in part, as an
expression of managerial power, rather than of the desire for more robust corporate
governance. This research adds weight to those studies which suggest that an important factor
in the detailed design of pay arrangements for senior executives is the ability of the package
to deliver significant gains to the eligible executive(s). In practical terms, these results
suggest the need for stronger justification by remuneration committees and greater vigilance
on the part of boards and shareholders in relation to changes in peer group composition. It is,
of course, the case that the anatomy of contemporary executive pay arrangements is far more
complex than at any time in the past. This reflects a response to a regulatory steer towards
more individual, bespoke forms of reward and in part, perhaps, a deliberate desire to
obfuscate pay structures in order to frustrate scrutiny. Either way, increased complexity has
meant that the responsibility of shareholders to monitor and moderate the detailed design of
pay arrangements has become significantly more onerous. Our results suggest a need for
more stringent regulation regarding the composition of peer groups, and subsequent
modifications to peer group membership. Boards should consider carefully whether broader,
non-bespoke comparator groups might be preferable in underpinning good governance,
compared with the identified governance-diluting effect of changes in bespoke group
composition.
Addressing such effects via modification of governance principles and codes is, of course,
not straightforward, and companies are likely to view any such moves as an unwelcome and
unwarranted intrusion into corporate affairs. It is, however, difficult to argue against the need
for greater uniformity and transparency in disclosure requirements relating to all aspects of
29
Further avenues for investigation could include the analysis of the narratives used by
companies in validating peer groups and, in the absence of prescriptive reporting
requirements, the probing of differences between companies with more and less liberal
approaches to detailed disclosure of remuneration arrangements. Similarly, the comparison of
peer group changes which are a function of deliberate action or, alternatively, a ‘natural’
occurrence would enrich our understanding of the degree of self-serving manipulation.
In conclusion, we contend that this study contributes to a richer understanding of the design
and impact of alternative remuneration arrangements. The contribution lies principally in the
empirical evidence on the self-serving adjustment of performance peer groups by executives,
and lends force to the managerial power perspective on board governance at the expense of
the arm’s-length contracting view favoured by agency theorists.
REFERENCES
Almazan, A., Hartzell, J. C., and Starks, L. T. (2005). ‘Active institutional shareholders and
costs of monitoring: Evidence from executive compensation’, Financial Management,
34(4), pp. 5-34.
Andres, C., Fernau, E., Theissen, E., (2014). ‘Should I stay or should I go? Former CEOs as monitors’, Journal of Corporate Finance, 28, pp. 26-47.
Armstrong, C. S., Ittner, C. D., and Larcker, D. F. (2012). ‘Corporate governance,
compensation consultants, and CEO pay levels’, Review of Accounting Studies, 17(2), pp.
30
Bebchuk, L., Fried, J. (2003). ‘Executive compensation as an agency problem’, Journal of
Economic Perspectives, 17, pp. 71–92.
Bebchuk, L., Fried, J. (2004). Pay Without Performance: the Unfulfilled Promise of
Executive Compensation. Harvard University Press, Cambridge, MA.
Bebchuk, L., Fried, J. (2005). ‘Pay Without Performance: overview of the issues’, Journal of
Applied Corporate Finance, 17, pp. 8-23.
Bebchuk, L., Grinstein, Y., Peyer, U. (2010). ‘Lucky CEOs and lucky directors’, The Journal
of Finance, 65, pp. 2363-2401.
Becht, M., Franks, J., Mayer, C. and Rossi, S. (2010). ‘Returns to Shareholder Activism:
Evidence from a Clinical Study of the Hermes UK Focus Fund’, Review of Financial
Studies, 22, pp. 3093-3129.
Bertrand, M., and Mullainathan, S. (2001). ‘Are CEOs rewarded for luck? The ones without principals are’, Quarterly Journal of Economics, pp. 901-932.
Bizjak, J., Lemmon, M., Nduyen, T. (2011). ‘Are All CEOs above average? An empirical
analysis of compensation peer groups and pay design’, Journal of Financial Economics,
100, pp. 538-555.
Buck, T., Bruce, A., Main, B. G., & Udueni, H. (2003). ‘Long Term Incentive Plans,
Executive Pay and UK Company Performance’, Journal of Management Studies, 40(7),
pp. 1709-1727.
Camara, A. (2001). ‘The pricing of relative performance based incentives for executive
compensation’, Journal of Business Finance and Accounting, 28, pp. 1115 – 1139.
Carter, M., Ittner, C., Zechman, S. (2009). ‘Explicit relative performance evaluation in
performance-vested equity grants’, Review of Accounting Studies, 14, pp. 269-306.
31
Conyon, M. J., and Peck, S. I. (1998). ‘Board control, remuneration committees, and top management compensation’, Academy of Management Journal, 41(2), pp. 146-157.
Conyon, M. J., and Schwalbach, J. (2000). ‘Executive compensation: evidence from the UK and Germany’, Long Range Planning, 33(4), pp. 504-526.
Core, J. E., Holthausen, R. W., and Larcker, D. F. (1999). ‘Corporate governance, chief
executive officer compensation, and firm performance’, Journal of Financial Economics,
51(3), pp. 371-406.
Chung, R., Firth, M. and Kim, J. (2002). ‘Institutional Monitoring and Opportunistic Earnings Management’, Journal of Corporate Finance, 8, pp. 29-48.
Daily, C. M., Johnson, J. L., Ellstrand, A. E., & Dalton, D. R. (1998). ‘Compensation
committee composition as a determinant of CEO compensation’, Academy of
Management Journal, 41(2), pp. 209-220.
Ertimur, Y., Ferri, F. and Muslu, V. (2011). ‘Shareholder Activism and CEO Pay’, Review of
Financial Studies, 24, pp. 535-592.
Evans, J., Nagarajan, N., Schloetzer, J. (2010). ‘CEO Turnover and retention light: retaining former CEOs on the board’, Journal of Accounting Research,48, pp. 1015-1047.
Ezzamel, M., and Watson, R. (2005). ‘Boards of directors and the role of non-executive
directors in the governance of corporations’. InKeasey, K., Thompson, S., & Wright, M.
(Eds.). Corporate governance: accountability, enterprise and international comparisons.
John Wiley & Sons.
Faulkender, M., Yang, J. (2010). ‘Inside the black box: the role and composition of
compensation peer groups’, Journal of Financial Economics, 96, pp. 257–270.
Finkelstein, S., and Hambrick, D. C. (1989). ‘Chief executive compensation: A study of the
intersection of markets and political processes’, Strategic Management Journal, 10(2), pp.
32
Fich, E., and A. Shivdasani, (2006). ‘Are Busy Boards Effective Monitors?’, The Journal of
Finance61(2), pp. 689–724.
Garvey, G. T., and Milbourn, T. T. (2006). ‘Asymmetric benchmarking in compensation:
Executives are rewarded for good luck but not penalized for bad’, Journal of Financial
Economics, 82(1), pp. 197-225.
Gaspar, J. M., Massa, M., and Matos, P. (2005). ‘Shareholder investment horizons and the
market for corporate control’, Journal of Financial Economics,76, pp. 135-165.
Gillan, S. L., and Starks, L. T. (2007). ‘The Evolution of Shareholder Activism in the United States’, Journal of Applied Corporate Finance, 19(1), pp. 55-73.
Goh, L., and Gupta, A. (2010). ‘Executive compensation, compensation consultants, and
shopping for opinion: Evidence from the United Kingdom’, Journal of Accounting,
Auditing & Finance, 25(4), pp. 607-643.
Goergen, M., and Renneboog, L. (2011). ‘Managerial compensation’, Journal of Corporate
Finance, 17(4), pp. 1068-1077.
Gong, G, L. Li, and J. Shin. (2011). ‘Relative performance evaluation and related peer groups
in executive compensation contracts’, The Accounting Review, 86, pp. 1007-1043.
Greenbury, R. (1995). ‘Directors’ Remuneration: Report of a Study Group Chaired by Sir
Richard Greenbury’, London.
Hartzell, J. and Starks, L. (2003). ‘Institutional Investors and Executive Compensation’,
Journal of Finance. 58, pp. 2351-2374.
Heron, R. A. and Lie, E. (2009). ‘What fraction of stock option grants to top executives have been backdated or manipulated?’, Management Science, 55(4), pp. 513-525.
Holmstrom, B. (1979). ‘Moral Hazard and Observability’, Bell Journal of Economics, 10, pp.
33 Holmstrom, B. (1982). ‘Moral hazard in teams’, The Bell Journal of Economics, 13(2), pp.
324-340.
Lie, E. (2005). ‘On the timing of CEO stock option awards’, Management Science, 51, pp.
801–812.
Larcker, D. F., So, E. C., and Wang, C. C. (2013). ‘Boardroom centrality and firm
performance’, Journal of Accounting and Economics, 55(2), pp. 225-250.
Lewellen, W., Park, T., Ro, B. (1996). ‘Self-serving behaviour in managers’ discretionary
information disclosure decisions’, Journal of Accounting and Economics, 21, pp. 227–251.
Main, B. G., Bruce, A., & Buck, T. (1996). ‘Total board remuneration and company performance’, The Economic Journal, 106, pp. 1627-1644.
Ozkan, N. (2011). ‘CEO compensation and firm performance: an empirical investigation of UK panel data’, European Financial Management, 17(2), pp. 260-285.
Pool, V., Wang, C., and Xie, F. (2009). ‘Board Oversight and Director Reputation: Evidence
from Firms Interlocked with Backdating Investigation Targets’, Available at SSRN:
http://ssrn.com/abstract=1344912 or http://dx.doi.org/10.2139/ssrn.1344912
Ravina, E., Sapienza, P. (2010). ‘What do independent directors know? Evidence from their trading’, The Review of Financial Studies, 23, pp. 962-1003.
Renneboog, L., and Zhao, Y. (2011). ‘Us knows us in the UK: On director networks and CEO compensation’, Journal of Corporate Finance, 17(4), pp. 1132-1157.
34
Supporting Information
Two cases of peer group modifications: Amec Plc and Barclays Plc.
Amec Plc: Amec Plc. states in its 2010 annual report (p.52):
“The composition of the comparator group, which is reviewed at the time of each set of
awards, has up to 2010 comprised only UK-listed companies in relevant FTSE subsectors. For 2011, the group has been amended to include a number of non-UK listed companies who are direct business competitors of AMEC and to exclude UK
companies where there is little or no overlap in activities…”.
Overall, fifteen firms were deliberately removed (three firms were dropped due to delisting),
and sixteen firms were added, to the peer group. The new, 2011, peer group comprised 27
firms (excluding Amec). TSR data, sourced through Thomson Datastream, was available for 25 peers and showed, on average, virtually zero (0.7%) log total shareholder return in the
period from April 2011 (start of the performance period) to May 2013 (end of observation
period). In contrast, the counterfactual (old, 2010) peer group’s TSR was 24% over the same
period (share price data available for 25 of 29 peers excluding Amec). The firms that were
added to the peer group performed particularly poorly, showing a negative TSR of -17%,
while the average TSR of the firms removed from the peer group was 21.9%. Further, the
median peer in the counterfactual (old, 2010) peer group outperformed 21 of the 25 peers in
the new peer group, whereas the median peer in the new peer group outperformed 4 of the 25
old peers only. The annual report explains the vesting rule as follows “…the requirement for full vesting is for AMEC to be ranked in the top quartile of the chosen comparator group. No
awards will vest if AMEC’s performance is below median. If AMEC’s performance is at the
median, 25 per cent of the award will vest.”The vesting rule means that performance at the
median of the old peer group would have expected to earn Amec’s CEO 25% of the
35
be valued at 21.9% of the CEO’s salary. The same level of TSR performance after the peer
group changes were introduced should now trigger full, 100%, vesting. The full vesting would be valued at 87.5% of annual salary. These valuations are estimated based on Amec’s
policy that performance share awards have “… a value at the time of award of up to 175 per
cent of base salary” and take into account the fact that 50% of the award is TSR-related (and
the other 50% is EPS-based). We also assume conservatively that the market value of Amec’s
shares does not change over the course of the performance period. The difference between
the partial and the full vesting is therefore equivalent to 87.5 – 21.9 = 65.6% of the CEO’s
annual salary - clearly, a significant increase in the level of expected award - is entirely due to
the fact that the peer group introduced by the board in 2011 performed significantly weaker
than the counterfactual peer group that the board used one year earlier and that could have been easily “recycled”.
Barclays Plc: In another example, a banking and financial services company Barclays Plc.
introduced peer group changes in 2010, where four peers-banks were removed and four new
peers-banks were added to the peer group. The 2010 annual report did not comment on what
seemed to be significant changes to the composition of 11-strong peer group. Peer
performance over the 2010-2012 performance period is summarized as follows:
𝑇𝑆𝑅(𝐴𝑑𝑑𝑒𝑑2010,𝐵𝑎𝑟𝑐𝑙𝑎𝑦𝑠) = −0.47, 𝑇𝑆𝑅(𝐶𝑜𝑢𝑛𝑡𝑒𝑟𝑓𝑎𝑐𝑡𝑢𝑎𝑙 𝑃2010,𝐵𝑎𝑟𝑐𝑙𝑎𝑦𝑠) = −0.21,
𝑇𝑆𝑅(𝑅𝑒𝑚𝑜𝑣𝑒𝑑2010,𝐵𝑎𝑟𝑐𝑙𝑎𝑦𝑠) = 0.03, 𝑇𝑆𝑅(𝑃2010,𝐵𝑎𝑟𝑐𝑙𝑎𝑦𝑠) = −0.39. This shows that banks
removed from the peer group in 2010 ended up outperforming the rest of the peer group by
about 40 percent in the generally tough market, whereas the banks added to the peer group
36
Table 1. The list of firms used in the study
3i Group Carnival LAND SECURITIES SABMiller
Admiral Group Carphone Whse. GP LEGAL & GENERAL SEVERN TRENT Alliance & Leicester Centrica LLOYDS BANKING
GROUP SHIRE
Amec Compass Group London Stock
Ex.Group SSE
Anglo American Diageo Lonmin Sage Group
Antofagasta Enterprise Inns Man Group Sainsbury (J) Associated Brit.
Foods Experian
Marks & Spencer
Group Schroders
Astrazeneca First Group Morrison(WM)SPMT
KS. Smith &Nephew
Aviva Friends Provident
Group National Grid Smiths Group
BAE Systems G4S Next Standard Chartered
BG Group GlaxoSmithKline Old Mutual Standard Life
BHP Billiton HBOS Pearson Taylor Wimpey
BP HIBU Persimmon Tesco
BT Group HSBC HDG. Prudential Thomas Cook Group
Barclays Hammerson RSA Insurance Tui Travel
British Airways Home Retail Group Reckitt Benckiser Tullow Oil British American
Tobacco ICAP Reed Elsevier Unilever (UK)
British Energy Group ICTL.HTLS.GP. Rentokil Initial United Utilities Group
British Land ITV Resolution Vedanta Resources
British Sky
Broadcasting Group
Imperial Tobacco
GP. Rexam Vodafone Group
Cable & Wireless International Power Rio Tinto WPP Cadbury Johnson Matthey Rolls Royce Whitbread Cairn Energy KELDA GROUP Royal Bank of
Scotland Wolseley
Capita KINGFISHER Royal Dutch Shell Xstrata Capital