Characterization of Electrical Behavior of Ba
5
HoTi
3
V
7
O
30
Ceramic Using Impedance Analysis
Kiran Kathayat1*, Anuradha Panigrahi2, Arvind Pandey3, Susmita Kar1
1Department of Physics, North Orissa University, Baripada, India; 2Department of Physics, D.N. College, Itanagar, India; 3Depart-
ment of Physics, North Eastern Regional Institute of Science & Technology, Nirjuli, India. Email: *[email protected], *[email protected]
Received March 12th,2012; revised April 16th, 2012; accepted May 19th, 2012
ABSTRACT
Polycrystalline sample of Ba5HoTi3V7O30 was prepared using solid-state reaction technique. X-ray structural analysis
indicated a single-phase formation with orthorhombic structure. Microstructural study by SEM showed non-uniform distribution of grains over the surface of the sample. Impedance and modulus spectroscopy studies were carried out, as functions of frequency (42 Hz - 5 MHz) and temperature (RT-773K). The Nyquist plots clearly showed the presence of both bulk and grain boundary effect in the compound. Electrical phenomena in the material can appropriately be mod-eled in terms of an equivalent circuit with R, C and CPE in parallel. The fitting procedure used here allows us to
deter-mine the value of R and C with good precision. Here R2 and R3 correspond to the resistance contributed from the grain
boundary and bulk, respectively. C1 and C2 correspond to the capacitance contributed from the grain boundary and bulk,
respectively. The real part of electrical modulus shows that the material is highly capacitive. The asymmetric peak of
the imaginary part of electric modulus M″, predicts a non Debye type relaxation. The activation energy of the
com-pound (calculated both from impedance and modulus spectrum) is same, and hence the relaxation process may be at-tributed to the same type of charge carriers.
Keywords: Ceramics; X-Ray Diffraction; Impedance Spectroscopy; Electrical Properties
1. Introduction
Ferroelectric compounds of tungsten bronze (TB) struc-tural family covers a large number of ferroelectric mate-rials which are found to be useful for applications in various electronic devices such as transducers, actuators, capacitors, and ferroelectric random access memory [1,2]. They have also some associated properties like pyroelec-tric, piezoelecpyroelec-tric, and nonlinear optical properties [3-5]. The TB structure consists of a skeleton framework of
distorted BO6 octahedral sharing corners in such a way
that a variety of cations can be substituted at three dif-ferent types of interstices (A, B, and C) of a general for-mula (A1)2(A2)4(C4)(B1)2(B2)8O30. Thus it provides scope
for improving the ferroelectric properties in search of new and better materials for device applications .where A-type (mono or divalent) cations can be accommodated
at different types of interstitial (A1, A2) sites. Tri- or
pentavalent atoms are substituted at octahedral sites B1
and B2 [2]. The C site (smallest interstice) is generally
empty.
Detailed literature study reveals that a lot of work has been carried out on ferroelectric niobates, vanadates and
tantalates having TB structure [6-9] such as, Ba5RTi3–x-
ZrxNb7O30 (x= 0, 1, 2, 3) [10,11], Ba5RTi3Nb10O30 (R =
Dy and Sm) [12], Ba5−xSrxDyTi3V7O30 (x = 0 - 5) [13],
Sr5EuCr3Nb7O30 [14], Ba4SrRTi3V7O30 (R = Sm, Dy) [15].
These compounds show many interesting properties like diffuse phase transition with wide variation of transition temperature. One such compound which has drawn our
attention is Ba5HoTi3V7O30 (BHTV) which has already
been examined elsewhere [16] and some of its properties have been reported. To know more about this compound and to explore its application, we have summarized the structural, impedance and modulus properties of the BHTV compound in this paper.
2. Experimental
Preparation of the material. A polycrystalline sample of BHTV was fabricated using solid state reaction technique.
Powders of BaCO3 (Loba chemie, 99%), Ho2O3 (Merck,
99.5%+), TiO2 (Loba chemie, 99.5%) and V2O5 (Loba
chemie, 99%) in stoichiometric proportion were weighed and thoroughly ground in an agate mortar to maintain proper stoichiometry and homogeneity in mixture, and then calcined at 1023 K for 12 hrs. The calcined powder
was pressed into cylindrical pellets 12 - 13 mm in di-ameter and 1 - 2 mm thick under the pressure of 7 tons using a hydraulic press. Polyvinyl butyral (PVB) was used as a binder to reduce the brittleness of the pellets, which was burnt out during sintering. The pellets were then sintered in an air atmosphere at 1073 K for 12 hrs, and then polished with fine emery paper to make their faces flat and parallel. The pellets were finally coated with conductive silver paint and dried at 423 K for 2 hour before carrying out impedance measurements.
Characterization of the material.X-ray diffraction (XRD)
studies of the materials were carried out at room
tem-perature in the Bragg angle range 20˚ - 80˚ by Rigaku
X-ray diffractometer (model: Miniflex). Surface morpho- logy of the compound was studied by scanning electron microscopy (JEOL JSM-5800F). The impedance meas-urements were carried out at an input signal level of 300 mV in the temperature range of RT-773 K using a com-puter-controlled impedance analyzer (HIOKI LCR Hi TESTER, Model: 3532-50) in the frequency range of 42 Hz - 5 MHz along with a laboratory made sample holder and a heating arrangement.
3. Results and Discussion
3.1. Structural Study
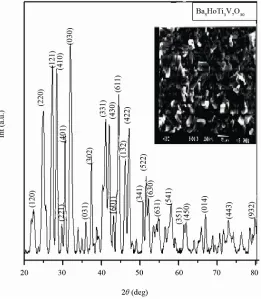
The room temperature XRD patterns (Figure 1) of the
calcined powder of BHTVshow the formation of single-
phase compound with orthorhombic crystal structure. The reflection peaks of the patterns were indexed in tetrago- nal or orthorhombic crystal system using computer soft- ware “POWDMULT” [17] (Since TB compounds have generally tetragonal or orthorhombic crystal structure). The position of the strongest peak in this compound is
around 30˚. An orthorhombic unit cell was selected on
the basis of the best agreement between observed and
calculated interplanar spacing d (i.e., obs –
cal
d (d
d ) minimun
) for this compound. The unit cellparameters of this compound are a = 13.5479 Å, b =
8.3346 Å and c = 5.6697 Å. The crystallite size (Dhkl) of
the powder sample was estimated from the broadening
of the peaks (1 2), using Debye-Scherrer’s equation [18];
1/ 2
9
Dhkl 0.8 coshkl , where λ = 1.5405 Å and θhkl
= Bragg angle. Broadening due to mechanical strain, instrumental error and other factors was ignored during calculation. The average crystallite size of BHTV was found to be 16.61 nm.
The inset of Figure 1 shows the scanning electron
mi-crograph of the BHTV pellet at room temperature. It is found that the grains are of platelet like morphology and size are non-uniform and densely distributed throughout the sample. A certain degree of porosity persists which may be due to the low sintering temperature. The average
[image:2.595.169.430.421.720.2]grain size of the compound was found as ~3 μm. The
Figure 1. Room temperature XRD pattern and SEM micrograph (inset) of BHTV.
shape, size and distribution of grains in the microstruc-ture suggest that the sample has polycrystalline namicrostruc-ture. Similar microstructures are observed with that of some other materials of this family [13].
3.2. Electrical Analysis
Complex impedance analysis technique is an important and powerful tool to investigate the electrical properties of materials over a wide range of frequency (42 Hz - 5
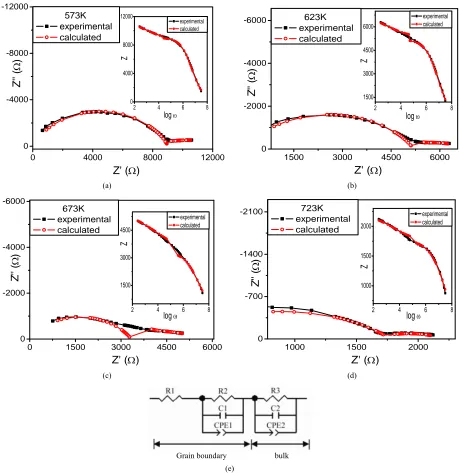
MHz) and temperature (573 K - 773 K). Figure 2 shows
the Nyquist plots (symbol ■) through experiment and
fitted data (symbol □) for 573 K, 623 K, 673 K and 723
K temperature by Equation (1) below:
21 1
CPE1 2 1 2
3 1
CPE2 3 2 3
R
Z R
1 Z R j C R
R
1 Z R j C R
(1)
where ZCPE 1
j C
and Bode plot (Z experi-
mental ■ and calculated □ vs log frequency) is shown in
0 4000 8000 12000
0 -4000 -8000 -12000
2 4 6 8
0 4000 8000 12000
Z
log
experimental calculated 573K experimental calculated Z' ' ( )
Z' ()
1500 3000 4500 6000
0 -2000 -4000 -6000
2 4 6 8
1500 3000 4500 6000
Z
log
experimental calculated 623K experimental calculated Z' ' ( )
Z' ()
(a) (b)
0 1500 3000 4500 6000
0 -2000 -4000 -6000
2 4 6 8
1500 3000 4500
Z
log
experimental calculated 673K experimental calculated Z' ' ( )
Z' ()
1000 1500 2000
0 -700 -1400 -2100
2 4 6 8
1000 1500 2000
experimental calculated
log
Z 723K experimental calculated Z '' ( )
Z' ()
(c) (d)
[image:3.595.68.528.234.707.2]Grain boundary bulk (e)
Figure 2. Nyquist plots (symbol ■) through experiment and fitted data (symbol □) for (a) 573 K; (b) 623 K; (c) 673 K and (d) 23 K temperature; (e) model to an equivalent circuit used in fitting.
7
inset of Figures 2(a)-(d). The complex impedance plots (Figure 2) for all mentioned temperature comprise of two semicircular arcs (due to bulk at high frequency and grain boundary at low frequency) with center below the real axis suggesting the departure from ideal Debye be-havior. This departure is due to the presence of constant phase element (CPE) in RC system. CPE is used in a model to compensate non-homogeneity in the system.
For a rough or porous surface, α value is between 0.9 and
1 which can cause a double-layer capacitance to appear
as a constant phase element. If α equals to 1 than the
equation is identical to that of a capacitor and if α is 0
then Z is equals to R 2 resemble to ideal resistor. The
CPE can also yield to an inductance, if α = –1. For ideal
Debye-like response, the equivalent circuit comprises of a parallel combination of a resistor and capacitor with
single relaxation time. Here, in Figure 2(e) a single se-
micircular arc can be modeled to an equivalent circuit of parallel combination of a resistance, capacitance along with a constant phase element [19]. The values of the temperature dependent electrical parameters
correspond-ing to the equivalent circuit (shown in Figure 2(e)) are
given in Table 1.
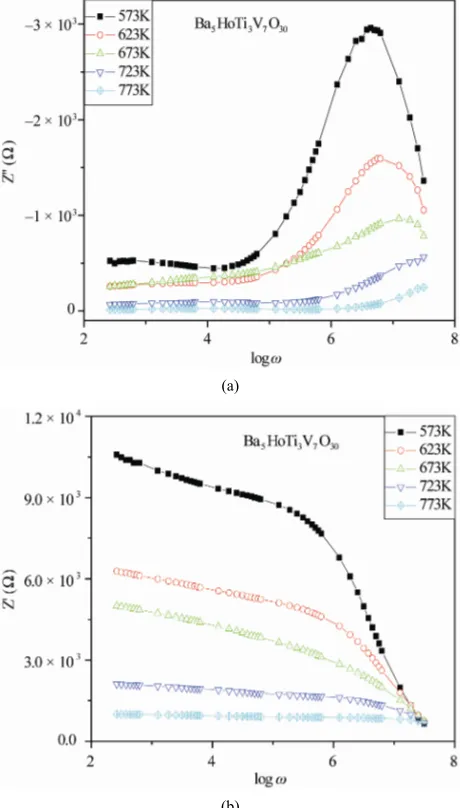
Figure 3(a) shows the variation of imaginary part of
impedance (Z″) with frequency at different temperatures.
The Z″-frequency patterns exhibits some important
fea-tures such as; 1) the value of max (i.e., peak value)
shifts towards higher frequency on increasing tempera-ture; 2) appearance of a peak at a particular frequency
(known as relaxation frequency, fmax); 3) the peak value
of Z″ decreases as the temperature increases and 4) the
peaks in the plot could be observed upto a temperature of 673K. Beyond this temperature peaks could not be ob-served because it shifts towards higher frequencies which overshoots the limits in which our measurements have been carried out. These features may be considered due to occurrence of the temperature-dependent relaxation phenomena in the materials [20].
Z
Figure 3(b) shows the variation of the real part of the
impedance Z′ as a function of the frequency at various
temperatures (573 K - 773 K) for BHTV. It is observed
that Z′ decreases as temperature increases, indicating a
negative temperature coefficient of the resistance in the system. The plateau region of the plot also indicates the
[image:4.595.308.538.162.566.2]presence of a relaxation process in the material.
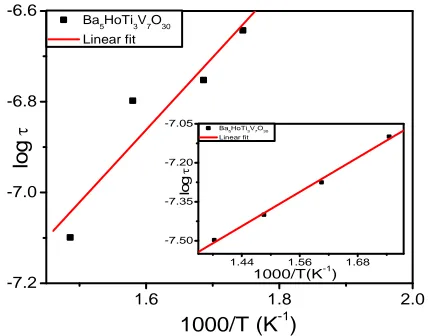
Figure 4 shows the variation of relaxation times as a function of inverse of absolute temperature of BHTV
compound. In a relaxation system, the relaxation times (τ)
were calculated from impedance (Z″) and modulus (M″)
(a)
(b)
[image:4.595.55.539.635.733.2]Figure 3. (a) Variation of imaginary part of impedance (Z″) and (b) real part of the impedance Z′ with frequency at different temperatures.
Table 1. The values of the temperature dependent electrical parameters corresponding to the equivalent circuit.
Temp (K) Electrical parameters
R1 R2 CPE1 α1 C1 R3 CPE2 α2 C2
573 K 7733 5999 5.6093e–5 0.22 1.099e–9 9037 1.6e–9 0.74 0.258e–12
623 K 5277 1540 4.3987e–5 0.4 56.985e–9 5200 3.5e–9 0.7 0.184e–12
673 K 2911 2810 2.6472e–5 0.28 1.957e–9 3340 8.5e–9 0.65 0.640e–12
723 K 1722 485 6.7185e–5 0.41 22.685e–9 1773 2e–8 0.6 0.040e–12
1.6 1.8 2.0 -7.2
-7.0 -6.8 -6.6
1.44 1.56 1.68
-7.50 -7.35 -7.20 -7.05 log
1000/T(K-1)
Ba5HoTi3V7O30
Linear fit
Ba5HoTi3V7O30 Linear fit
lo
g
[image:5.595.65.280.86.254.2]1000/T (K-1)
Figure 4. Variation of relaxation times as a function of in-verse of absolute temperature calculated from the imped-ance spectrum (Z″ vs. frequency) and modulus spectrum (M″ vs. frequency) (inset).
data by using the relation: 11 2πfmax ; where
fmax is the relaxation frequency. It was observed that the
value of τ was found to be decreasing with increase in
temperature, which is a typical semiconductor behavior
of the sample. The activation energy (Ea) of the
com-pound was calculated from the Arrhenius equation [21, 22]; 0exp E K T
a B
, Where, τ0 is the preexpo-nential factor, KB is Boltzmann constant and T is the
ab-solute temperature. The value of the activation energy,
obtained from the slope of the curve in the plot of log τ
against 103 T–1, is found to be ~0.34 eV (From
imped-ance plot) and ~0.22 eV (From modulus plot, inset). It is clear that the activation energy of the compound (as cal-culated from the impedance and modulus spectra) is nearly the same, and the relaxation process may be at-tributed to the same type of charge carriers.
3.3. Modulus Analysis
An electrical response of the samples can be analyzed via
complex dielectric modulus formalism M″ which is
an-other approach based on polarization analysis. Complex impedance spectrum gives emphasis to elements with the larger resistance whereas complex modulus plots
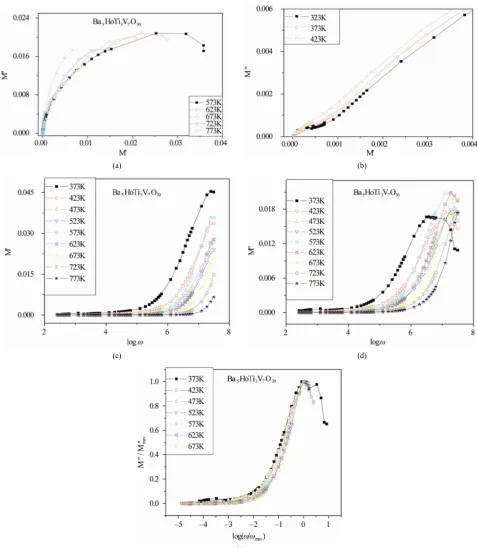
high-light those with smaller capacitance. Figures 5(a) and (b)
(M′ vs M″) depicts that the modulus plane shows a single
semicircle for BHTV at higher temperatures (≥473 K).
Although, at first sight, there appears a single
semicircu-lar arc in modulus spectra at lower temperatures (≤473 K)
of these compounds as well, however, further resolution of these spectra at low frequencies reveal two
semicircu-lar arcs. The small semicircle in the M vs M″ plot
corre-sponds to the high capacitance values. The arc at low frequency is due to the grain boundary whereas the higher frequency arc depicts the bulk effect. With rise in
tem-peratures, both grain and grain boundary effect appears to merge into the single semicircle. The modulus spec-trum shows a marked change in its shape with rise in temperature suggesting a change in the capacitance val-ues of the material. The semicircle in higher frequency region is not complete due to the frequency limit of the measuring instrument (maximum 5 MHz). The intercept on the real axis indicates the total capacitance contrib-uted by the grain and grain boundary.
Figure 5(c) shows the variation of M′ as a function of frequency for BHTV in a wide temperatures range (373
K - 773 K). This shows that M′ approaches to zero in the
low frequency region, and a continuous dispersion on in- creasing frequency may be contributed to the conduction phenomena due to short range mobility of charge carriers. This implies the lack of a restoring force for flow of charge under the influence of a steady electric field [20]. This confirms elimination of electrode effect in the mate-rial.
Figure 5(d) shows the variation of imaginary part of electric modulus with frequency for BHTV at different temperatures 373 K - 773 K. The electrical modulus maxi-
ma (Mmax ) shifts towards higher frequencies side with
rise in temperature ascribing correlation between motions of mobile ions [23]. The asymmetric peak broadening shows that the relaxation is of non-Debye type which can be concluded due to the spreading of relaxation times with different time constant. The low frequency peaks shows that the ions can move over long distances whereas high frequency peaks merge to spatially confinement of ions in their potential well. The nature of modulus spec-trum suggests the existence of hopping mechanism of electrical conduction in the material.
The scaling behavior of normalized imaginary M has
been shown in Figure 5(e) at selected temperatures. The
coincidence of all the curves of different temperatures into a single master curve indicates temperature inde-pendence of dynamic processes [24,25]. The scaling be-havior of the electric modulus of the compounds shows that there is not perfect overlapping of different tem-perature data peaks. This depicts that different relaxation processes are occurring in the compounds. It is to be noted that all the plots have a similar shape with a long and flat tail extending from the low-frequency region up to the intermediate frequency region. The presence of a flat tail is associated with the grain boundary effect while that part of the peaking curve observed at higher fre-quencies is due to the bulk effect. There is both electronic and ionic contribution in BHTV compound. BHTV is less
dispersed (Figure 5(e)) which indicates that conductivity
in this compound is dominated by one type of species. Since, BHTV have shown strong ionic character (as re-vealed by impedance plots) [16], thus, it can be presumed
(a) (b)
(c) (d)
(e)
Figure 5. (a), (b) M′ Vs M″; (c) logω vs M′; (d) logω vs M″; (e) log(ω/ωmax) vs M″/M″max of BHTV at different temperatures.
dominating over the electronic contribution.
4. Conclusion
The polycrystalline sample of BHTV is prepared by solid state reaction. Preliminary X-ray analysis confirms the
orthorhombic crystal structure at room temperature. The surface morphology of the compound is studied through SEM, which gives the average grain size as the order of 3
μm. From the impedance and modulus spectroscopic
[image:6.595.58.535.82.630.2]higher frequency side with increase in temperature. The complex impedance plots reveal the contribution of bulk and grain boundary in it. The activation energy is found to be 0.34 eV (from impedance plot) and 0.22 eV (from modulus plot) are nearly same, and hence the relaxation process may be attributed to the same type of charge car-riers. Modulus spectra indicate that there is both elec-tronic and ionic contribution in BHTV compound.
5. Acknowledgements
Authors thank Director, NERIST to permit to carry out research work and for his encouragement and help. We are grateful to the CRF of IIT, Kharagpur and Dr S. R. Shanigrahi (IMRE, Singapore) for their help in carrying out SEM and XRD, respectively.
REFERENCES
[1] R. R. Neurgaonkar, J. G. Nelson and J. R. Oliver, “Ferro- electric Properties of the Tungsten Bronze M2+
6M4+2Nb8O30
Solid Solution Systems,” Materials Research Bulletin, Vol. 27, No. 6, 1992, pp. 677-684.
doi:10.1016/0025-5408(92)90074-A
[2] R. R. Neurgaonkar and W. K. Cory, “Progress in Photore- fractive Tungsten Bronze Crystals,” Journal of Optical Society of America B, Vol. 3, No. 2, 1986, pp. 274-282. doi:10.1364/JOSAB.3.000274
[3] C. Huang, A. S. Bhalla and R. Guo, “Measurement of Mi- crowave Electro-Optic Coefficient in Sr0.61Ba0.39Nb2O6
Crystal Fiber,” Applied Physics Letters, Vol. 86, No. 21, 2005, Article ID: 211907. doi:10.1063/1.1937997 [4] Y. Yuan, X. M. Chen and Y. J. Wu, “Diffused Ferroelec-
trics of Ba6Ti2Nb8O30 and Sr6Ti2Nb8O30 with Filled Tung-
sten-Bronze Structure,” Journal of Applied Physics, Vol. 98, No. 8, 2005, Article ID: 084110.
doi:10.1063/1.2120891
[5] M. R. Ranga Raju, R. N. P. Choudhary and H. R. Ruk- mini, “Diffuse Phase Transition in Sr5RTi3Nb7O30 (R =
La, Nd, Sm, Gd and Dy) Ferroelectric Ceramics,” Ferro- electrics, Vol. 325, No. 1, 2005, pp. 25-32.
doi:10.1080/00150190500326720
[6] P. S. Sahoo, A. Panigrahi, S. K. Patri and R. N. P. Choud- hary, “Structural and Electrical Properties of Ba5SmTi3
-V7O30 Ceramics,” Journal of Material Science: Material
in Electronics, Vol. 21, No. 2, 2010, pp. 160-167. doi:10.1007/s10854-009-9887-2
[7] M. R. R. Raju and R. N. P. Choudhary, “Structural, Di- electric and Electrical Properties of Sr5RTi3Nb7O30 (R =
Gd and Dy) Ceramics,” Materials Letters, Vol. 57, No. 19, 2003, pp. 2980-2987.
doi:10.1016/S0167-577X(02)01408-8
[8] P. Ganguly, A. K. Jha and K. L. Deori, “Investigations of Dielectric, Pyroelectric and Electrical Properties of Ba5
-SmTi3Nb7O30 Ferroelectric Ceramic,” Journal of Alloys
and CompoundsVolume, Vol. 484, No. 1-2, 2009, pp. 40- 44. doi:10.1016/j.jallcom.2009.05.034
[9] V. Hornebecq, C. Elissalde, J. M. Reau and J. Ravez,
“Relaxations in New Ferroelectric Tantalates with Tetrago- nal Tungsten Bronze Structure,” Ferroelectrics, Vol. 238, No. 1, 2000, pp. 57-63.
doi:10.1080/00150190008008767
[10] N. K. Singh, R. N. P. Choudhary and A. Panigrahi, “Phase Transition of Ba5SmTi3-xZrxNb7O30 (x= 0, 1, 2, 3) Ferro-
electric Ceramics,” Journal of Materials Science Letters, Vol. 20, No. 8, 2001, pp. 707-712.
doi:10.1023/A:1010906907512
[11] N. K. Singh, A. Panigrahi and R. N. P. Choudhary, “Struc- tural and Dielectric Properties of Ba5EuTi3-xZrxNb7O30
Reloxor Ferroelectrics,” Materials Letters, Vol. 50, No. 1, 2001, pp. 1-5. doi:10.1016/S0167-577X(00)00402-X [12] S. R. Shannigrahi, R. N. P. Choudhary, A. Kumar and H.
N. Acharya, “Phase Transition in Ba5RTi3Nb7O30 (R =
Dy, Sm) Ferroelectric Ceramics,” Journal of Physics and Chemistry of Solids, Vol. 59, No. 5, 1998, pp. 737-742. doi:10.1016/S0022-3697(97)00217-5
[13] P. S. Sahoo, A. Panigrahi, S. K. Patri and R. N. P. Choud- hary, “Effect of Strontium Substitution on Electrical Con- duction Properties of Ba5DyTi3V7O30,” The European
Physical Journal Applied Physics, Vol. 52, No. 3, 2010, Article ID: 30601. doi:10.1051/epjap/2010146
[14] M. R. R. Raju, R. N. P. Choudhary and S. Ram, “Di- electric and Electrical Properties of Sr5EuCr3Nb7O30 Nanoceramics Prepared Using a Novel Chemical Route,” Physica Status Solidi (B), Vol. 239, No. 2, 2003, pp. 480- 489. doi:10.1002/pssb.200301832
[15] P. S. Sahoo, A. Panigrahi, S. K. Patri and R. N. P. Choud- hary, “Structural, Dielectric, Electrical and Piezoelectric Properties of Ba4SrRTi3V7O30 (R = Sm, Dy) Ceramics,”
Central European Journal of Physics, Vol. 6, No. 4, 2008, pp. 843-848. doi:10.2478/s11534-008-0112-3
[16] K. Kathayat, A. Panigrahi, A. Pandey and S. Kar, “Effect of Holmium Doping in Ba5RTi3V7O30 (R = Rare Earth
Element) Compound,” Integrated Ferroelectrics, Vol. 118, No. 1, 2010, pp. 8-15.
doi:10.1080/10584587.2010.489461
[17] E. Wu, ‘‘POWD, an Interactive Powder Diffraction Data Interpretation and Indexing Program, Version 2.5,” School of Physical sciences, Finders University of South Austra- lia, Bedford Park, Australia.
[18] H. P. Klug and L. E. Alexander, “X-Ray Diffraction Procedures,” 2nd Edition, John Wiley & Sons Inc., New York, 1974.
[19] J. R. Macdonald, “Impedance Spectroscopy-Emphasizing Solid Materials and Synthesis,” In: J. R. Macdonald, Ed., Theory, John Wiley and Sons Inc., New York, 1987, pp. 13, 77.
[20] P. S. Sahoo, A. Panigrahi, S. K. Patri and R. N. P. Choud- hary, “Structural and Impedance Properties of Ba5DyTi3-
V7O30,” Journal of Material Science: Material in Elec-
tronics, Vol. 20, No. 6, 2009, pp. 565-570. doi:10.1007/s10854-008-9766-2
[21] E. V. Ramana, S. V. Suryanarayana and T. B. Sankaram, “ac Impedance Studies on Ferroelectromagnetic SrBi5−x-
LaxTi4FeO18 Ceramics,” Material Research Bulletin, Vol.
[22] Z. G. Yi, Q. F. Fang, X. P. Wang and G. G. Zhang, “Di- electric Relaxation Studies on the Submicron Crystalline La2Mo2O9 Oxide-Ion Conductors,” Solid State Ionics,
Vol. 160, No. 1-2, 2003, pp. 117-124. doi:10.1016/S0167-2738(03)00143-7
[23] F. Borsa, D. R. Torgeson, S. W. Martin and H. K. Patel, “Relaxation and Fluctuations in Glassy Fast-Ion Conduc- tors: Wide-Frequency-Range NMR and Conductivity Meas- urements,” Physical Review B, Vol. 46, No. 2, 1992, pp. 795-800. doi:10.1103/PhysRevB.46.795
[24] S. Saha and T. P. Sinha, “Low-Temperature Scaling Be- havior of BaFe0.5Nb0.5O3,” Physical Review B, Vol. 65,
No. 13, 2002, Article ID: 134103. doi:10.1103/PhysRevB.65.134103
[25] S. Sen, P. Pramanik and R. N. P. Choudhary, “Impedance Spectroscopy Study of the Nanocrystalline Ferroelectric (PbMg)(ZrTi)O3 System,” Applied Physics A: Materials