Int. J. Electrochem. Sci., 10 (2015) 4461 - 4472
International Journal of
ELECTROCHEMICAL
SCIENCE
www.electrochemsci.org
Three-Dimensionally Structure SnO
2-Nanometer Graphite
Flakes Composite and Its Lithium Storage Properties
Li-lai Liu1,2, Mao-zhong An1,*, Pei-xia Yang1, Jin-qiu Zhang1
1
School of Chemical Engineering and Technology, Harbin Institute of Technology, Harbin, 150001, China
2
College of Environmental and Chemical Engineering, Heilongjiang University of Science and Technology, Harbin 150022, China
*
E-mail: [email protected]
Received: 8 January 2015 / Accepted: 2 March 2015 / Published: 23 March 2015
The SnO2-nanometer graphite flakes composite has been prepared by a one-step
microwave-hydrothermal method. The nanometer graphite flakes and SnO2 nanoparticles form a
three-dimensionally structure. The SnO2 nanoparticles with the size of 3.3 nm uniformly distribute on the
curly graphite flakes. The SnO2-nanometer graphite flakes composite exhibits excellent
electrochemical performances in lithium-ion batteries. The first discharge/charge capacity is 1739.9/973.5 mA h g-1 at a current density of 100 mA g-1, and the discharge specific capacity remains 656.6 mA h g-1 after 100 cycles. The discharge specific capacities at the current densities of 300 and 500 mA g-1 are 635.2 and 477.3 mA h g-1 after 400 cycles, respectively, and all the specific capacities at different current densities begin to increase after the 50th cycle. Its cycling performance is drastically enhanced.
Keywords: nanometer graphite flakes; SnO2; microwave-hydrothermal; lithium-ion batteries; anode materials
1. INTRODUCTION
range of application, much effort has been made to explore new anode materials. Metal and metal oxides, such as Si, Sn, NiO, SnO2, Fe3O4, Co3O4, have attracted much attention because of their high
theoretical lithium storage capacity [5-7]. However large volume change during charge and discharge processes makes the electrochemical active particles crack and lose the electrical contact, which results in fast decline of reversible capacity. In order to overcome this problem, many methods have been developed to buffer or prevent volume changes, such as CNTs-encapsulation [8-9], formation of core-shell nanostructures [10], decrease of particle size, and preparation of carbon-coating composite [11]. The preparation of carbon-coating composite has been suggested an effective way to improve the cycling performance. The carbon in composite can not only buffer the volume changes of metal or metal oxide nanoparticles and prevent them from aggregating to large particles, but also increase electronic conductivity of composites due to its good electronic conductivity [12]. In recent years, a new kind of carbon material, graphene, has gained special attention due to its two-dimensional nanostructure with superior electronic conductivity and high surface area [13]. Graphene-containing composites, such as SnO2/graphene, Fe3O4/graphene, NiO/graphene, ZnO/graphene, Co4O3/graphene,
MnO2/graphene, Mn3O4/graphene, TiO2/graphene, have sparked enormous research for applications in
lithium-ion batteries [14]. These graphene-based composites as anode materials exhibit high capacities and excellent electrochemical performances in lithium-ion batteries. SnO2 is considered as one of the
most promising anode material substitutes due to its high theoretical specific capacity (782 mA h g-1) and low potential for lithium alloying [15-17]. Several varieties of graphene/SnO2 nanoparticle
composites have been reported as anode materials for LIBs, such as flower-like SnO2, SnO2 nanorods,
SnO2 hollow nanosphere composites, ternary hybrids of graphene/SnO2/Au, SnO2-graphene-carbon
nanotube mixtures and graphene/carbon nanosphere composites [18-24]. Extensive attention has been focused on graphene and SnO2 composites, while relatively little attention has been paid to nanometer
graphite flakes and SnO2 composites. The theoretical specific capacity of nanometer graphite flakes is
lower than graphene, but the preparation of nanometer graphite flakes is more simple and easy to control. In addition, It is difficult to prepare graphene used a large flake graphite (particle size is larger than 150 μm) as raw material because of low oxidation efficiency and poor exfoliation degree. Therefore most of the researches used graphite powder as raw material to prepare graphite oxide [25-27]. The application of large flake graphite in lithium-ion batteries has been restricted greatly. Therefore, easy, efficient and general methods for the synthesis of nanometer graphite flakes used large flake graphite as raw material and SnO2-nanometer graphite flakes composite with excellent
electrochemical performance are of great significance. Herein, we report a one-step microwave-hydrothermal method for synthesis of SnO2-nanometer graphite flakes composite used large flake
graphite as raw material. The nanometer graphite flakes after high-power ultrasonic broken and stripping are precursor materials, and the reaction is completed in a microwave reactor (Anton Paar Synthos 3000). The feature of the method is quick heating, easily controlled pressure and temperature, high yield rate, and good homogeneity. Prepared nanometer graphite flakes are thinner, and SnO2
nanoparticles attached to graphite flakes uniformly. The application of SnO2-nanometer graphite flakes
2. EXPERIMENTAL
2.1 Preparation of materials
The expanded graphite was synthesized from natural large flakes graphite by the method reported in our previous work [28]. 2 g SnCl4•5H2O was added to 120 mL deionized water, followed
by stirred for 10 min; 40 mL polyethylene glycol (MW=400) was added to SnCl4•5H2O solution, the
pH was adjusted by ammonia; Then 0.5 g expanded graphite was added to SnCl4•5H2O solution,
followed by high power ultrasonic treatment for 60 min; The supernatant solution was transferred to high pressure Teflon vessels of the microwave reaction system. The system power, temperature, pressure and reaction time were 1000 W, 180 ℃, 20 bar and 60 min, respectively. The product was cleaned several times by centrifugation with ethanol and deionized water, and dried at 120 ℃ for several hours. The solid product was annealed under 500 ℃ for 2 h in Ar atmosphere. As comparison, nanometer graphite flakes were prepared with the microwave-hydrothermal method under the same parameters without the addition of SnCl4•5H2O and ammonia. Pure SnO2 nanoparticles were prepared
by the microwave-hydrothermal method under the same parameters without the addition of expanded graphite.
2.2 Characterization of materials
The materials were characterized by scanning electron microscope (SEM, Quanta 200F), transmission electron microscopy (TEM, FEI TECNAI G2 F20), X-ray diffraction (XRD, Bruker D8 Advance with Cu Kα radiation) operated at 40 kV and 40 mA.
2.3 Electrochemical measurements
The electrochemical measurements were carried out using CR2025 coin-type cells. The working electrode was prepared by coating slurry consisting of active material, PVDF (polyvinylidene fluoride) and acetylene black with a weight ratio of 80:10:10 in NMP (N-methyl-pyrrolidone) solvent. The slurry was uniformly pasted on a copper foil form thin film and dried at 120 ℃ in a vacuum oven for 12 h. The thin film on copper foil was cut into round disks with diameter of 12 mm and pressed under a pressure of approximately 200 kg cm-2. Then dried at 120 ℃ in a vacuum oven for 3 h and used as anodes for the coin cells. The coin cells were assembled inside a glove box filled with pure argon, using lithium metal as the counter/reference electrode and Celgard2325 as the separator. The electrolyte was 1 M LiPF6 dissolved in a mixture of dimethyl carbonate (DMC), diethyl carbonate
voltage of 5 mV in the frequency range of 0.01-100 kHz using an electrochemistry working station (AUTOLAB PGSTAT302).
[image:4.596.105.489.171.478.2]3. RESULTS AND DISCUSSION
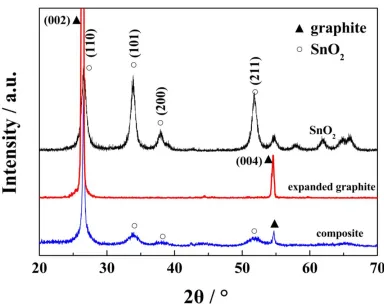
Figure 1. XRD patterns of SnO2 nanoparticles, expanded graphite and SnO2-nanometer graphite flakes
composite.
The XRD patterns of SnO2 nanoparticles, expanded graphite and SnO2-nanometer graphite
flakes composite are illustrated in Fig. 1. For expanded graphite, two diffraction peaks at ~26.2° and ~54.6° of (002) and (004) are distinguishable, which demonstrates that expanded graphite is still hold the structure characteristics of graphite. All strong diffraction lines can be indexed to the standard tetragonal SnO2 phase (JCPDS card no. 41-1445), indicating the crystalline SnO2 nanoparticles can be
formed by the microwave-hydrothermal reaction. It is noticeable that the diffraction peaks of the SnO2
-nanometer graphite flakes composite are broader than that of pure SnO2 nanoparticles, which suggests
that the nanoparticles are very small in size. The mean crystallite size of pure SnO2 nanoparticles and
SnO2-nanometer graphite flakes composite are estimated to be 10 and 3 nm based on the Scherer
Equation, which indicates that graphite flakes can limit grain growth of SnO2 nanoparticles in the
process of the microwave-hydrothermal reaction.
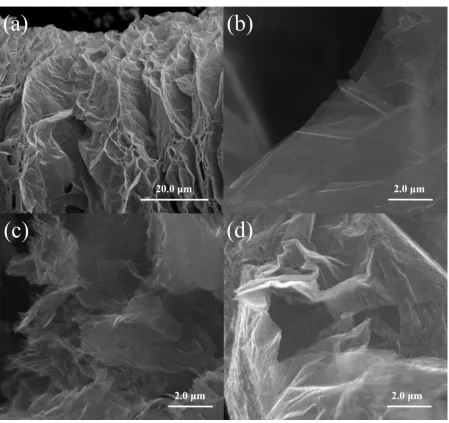
2(a) shows that the expanded graphite is composed of many adhesion flake graphite layers, which reveals the original graphite material is already exfoliated into folded layers. And there is a large amount of free space between the folded layers and formed a 3D network structure. After large power ultrasound treatment, the expanded graphite is stripped piece layer structure and consists of thin transparent graphite sheets with larger area, which can be seen from Fig. 2(b). Fig. 2(c) shows morphology of nanometer graphite flakes. The nanometer graphite flakes are consist of much thin wrinkled paper-like structure nanometer graphite sheets, and the nanometer graphite flakes are substantially disordered, agglomerated and overlapped. The morphology of SnO2-nanometer graphite
flakes composite is observed in Fig. 2(d). The composite is consists of randomly aggregated thin graphite flakes, closely associates with each other and forms a disordered solid. Tiny SnO2
nanoparticles are distributed on the curly graphite flakes.
[image:5.596.75.524.273.696.2]
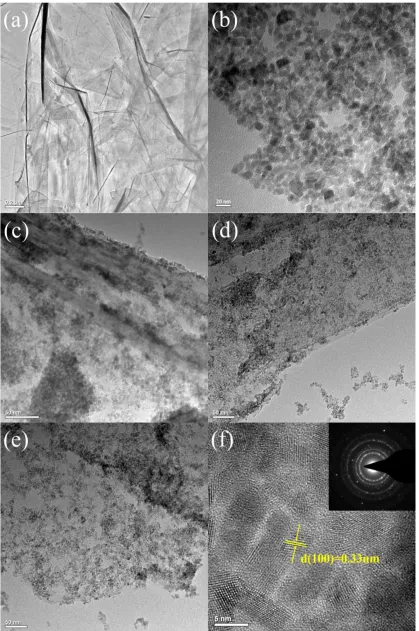
Figure 3. TEM images of (a) expanded graphite sheets after large power ultrasound treatment, (b) SnO2 nanoparticles and (c) (d) (e) SnO2-nanometer graphite flakes composite, HRTEM image
[image:6.596.91.510.68.699.2]
In order to further observe the microstructure of the materials, the expanded graphite sheets after large power ultrasound treatment, SnO2 nanoparticles and SnO2-nanometer graphite flakes
composite are characterized by TEM and HRTEM. Fig. 3(a) shows that expanded graphite sheets after large power ultrasound treatment is stripped to piece layer structure and consist of overlapped thin transparent graphite sheets with larger area. Fig. 3(b) shows that the pure SnO2 nanoparticles are
uniform, and the average diameter is about 10 nm. Fig. 3(c), (d) and (e) show the morphologies of SnO2-nanometer graphite flakes composite. The SnO2 nanoparticles are inserted into layers of the
nanometer graphite flakes, and the nanometer graphite flakes are covered by ultrafine SnO2
nanoparticles. The nanometer graphite flakes and SnO2 nanoparticles forms a 3D network structure.
Compared with pure nanoparticles, the diameter of the SnO2 nanoparticles in composite is smaller, and
less than 3.3 nm. It is illustrated that the nanometer graphite flakes can prevent the SnO2 nanoparticles
from growing effectively. Unlike graphene composites, the number of graphite flakes plies in SnO2
-nanometer graphite flakes composite is different due to expanded graphite flakes at different levels of stripping. From the HRTEM images in Fig. 3 (f), the interplanar distance of 0.33 nm can be identified as d (110) of SnO2 nanoparticles. According to electron diffraction pattern (inset of Fig. 3 (f)), the four
distinct diffraction rings represent (110), (101), (200), and (210) from the rutile phase of SnO2,
[image:7.596.121.472.388.654.2]confirming the highly crystalline nature of SnO2 nanoparticles [2, 29].
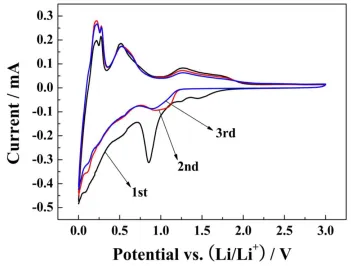
Figure 4. The cyclic voltammetry curves of SnO2-nanometer graphite flakes composite from 0.01 to
3.0 V at a scanning rate of 0.1 mV s-1.
Fig. 4 shows the CV curves of SnO2-nanometer graphite flakes composite electrode in the first
nanometer graphite flakes composite in lithium-ion battery is similar to SnO2/graphene composites. In
the first cycle, there is an obvious peak at 0.85 V in the cathodic progress, which can be attributed to the formation of the solid electrolyte interphase (SEI) film [30]. This peak disappears from the second cycle. The other reduction peaks are located around 0.08 and 0.01 V, which can be ascribed to the formation of a series of LixSn alloys and insertion in graphite flakes, respectively [31]. Three oxidation peaks appear around 0.22, 0.51 and 1.27 V, respectively. The 0.22 V anodic peak corresponds to lithium extraction from graphite flakes (Eq. (3)). The 0.51 V oxidation peak can be assigned to the de-alloying of LixSn (Eq. (2)). The distinguished oxidation at 1.27 V indicates that the Eq. (1) is partially reversible reaction [32]. Accordingly, the reduction peaks at 1.05 V in the second and third cycles are attributed to the formation of Li2O again [33].
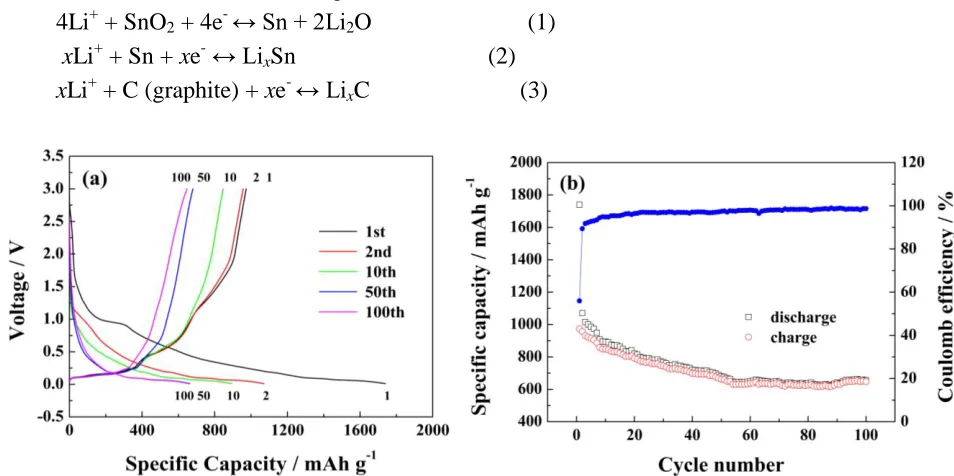
4Li+ + SnO2 + 4e- ↔ Sn + 2Li2O (1)
xLi+ + Sn + xe- ↔ LixSn (2) xLi+ + C (graphite) + xe- ↔ LixC (3)
[image:8.596.58.535.240.478.2]
Figure 5. Discharge/charge profiles of SnO2-nanometer graphite flakes composite at current density of
100 mA g-1. (a) Discharge/charge performances in different cycles of 1st, 2nd, 10th, 50th and 100th. (b) Cycling performance and coulomb efficiency at 100 mA g-1 in 100 cycles.
Fig. 5(a) shows the discharge and charge profiles of SnO2-nanometer graphite flakes composite
at current density of 100 mA g-1 with voltage range of 0.01~3 V. In the first cycle, the discharge and charge specific capacities are 1739.9 and 973.5 mA h g-1, respectively. And there is a classical plateau in the potential ranging from 1.0 to 0.8 V, which is mainly due to the formation of Sn and Li2O. The
following long slope profile indicates the formation of Li-Sn alloys and Li+ intercalation in to graphite flakes [34]. The plateau around 0.85 V almost disappears at the second cycle, demonstrating that major Li2O is formed in the first cycle. Because of this irreversible reaction, as well as the SEI film formed,
the discharge capacity dropped to 1070.8 mA h g-1 in the second cycle. Fig. 5(b) shows cycling performance and coulomb efficiency at 100 mA g-1 in 100 cycles. The initial reversible specific capacity of SnO2-nanometer graphite flakes composite is 973.5 mA h g-1. The reversible specific
composite in the first cycle is 55.9 % and then keeps increasing. It is over 95 % after 12 cycles and maintains a high coulomb efficiency of more than 98.5 % after 60 cycles.
[image:9.596.99.498.132.430.2]
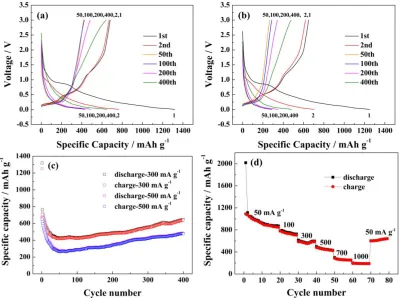
Figure 6. Electrochemical performances of SnO2-nanometer graphite flakes composite at high current
densities. (a) Discharge/charge profiles at 300 mA g-1; (b) Discharge/charge profiles at 500 mA g-1; (c) Cycling performances at 300 and 500 mA g-1 in 400 cycles; (d) Rate performance.
Electrochemical performances of SnO2-nanometer graphite flakes composite at high current
densities are investigated. Fig. 6(a) and (b) show the discharge/charge of composite at the current densities of 300 and 500 mA g-1. The same as the Fig. 5(a), there is a classical plateau in the potential ranging from 1.0 to 0.8 V in the first cycle, and the plateau almost disappears at the second cycle. The presence of the plateau can be attributed to the formation of SEI film on the surface of electrode and the conversion reaction between SnO2 and Li. In the first cycle, the discharge/charge specific
capacities at 300 and 500 mA g-1 are about 1319.8/680.8 and 1250.7/650.1 mA h g-1 with the coulomb efficiencies of 51.58% and 51.98%, respectively. The cycling performances of SnO2-nanometer
graphite flakes composite at 300 and 500 mA g-1 are shown in Fig. 6(c). The discharge specific capacities at the current of 300 and 500 mA g-1 are 635.2 and 477.3 mA h g-1 after 400 cycles, respectively. It is worth noting that all the specific capacities at different current densities begin to increase after the 50th cycle. The decay of reversible capacity of the SnO2-nanometer graphite flakes
composite during the first 50 cycles can be attribute to the pulverization of original SnO2 and in situ
contact well with each other, as a result, the reversible specific capacity decreases. With Li insertion and extraction, the formed Sn nanoparticles became smaller and smaller due to electrochemical milling effects and strong attached to the graphite flakes. In addition, the activation energies for solid-state double decomposition reactions decreased with the decreasing reagent particle size [35]. The conversion reaction of SnO2 in the SnO2-nanometer graphite flakes composite, SnO2 + 4Li+ + 4e
-→2Li2O + Sn, should be reversible to a certain extent due to the very small Sn nanoparticles.
Therefore, the specific capacities begin to increase after the 50th cycle. Fig. 6(d) shows the rate performance of SnO2-nanometer graphite flakes composite at various current densities. The electrode
exhibits reversible capacities of 873.0, 726.5, 598.1, 430.6, 252.9 and 190.0 mA h g-1 at 50, 100, 300, 500, 700 and 1000 mA g-1, respectively. Additionally, when the current density reduced to 50 mA g-1 after completed charge/discharge at different rates, the specific capacity increases back to 642.4 mA h g-1, and the specific capacity shows an obviously rising trend. The reversible capacities of SnO2
-nanometer graphite flakes composite at different current densities are lower than part of SnO2
-graphene anode materials, but the cycle performance and rate performance are much better than the graphene anode materials. The excellent cycling performance and rate performance should be related to the porous network structure of SnO2-nanometer graphite flakes composite. The high conduction of
graphite can increase the electronic conductivity of the composite, and the porous structure can facilitate liquid electrolyte diffusion into the electrode material. Meanwhile, SnO2 nanoparticles in the
[image:10.596.108.484.421.700.2]SnO2-nanometer graphite flakes composite can reduce the path length for Li+ transport.
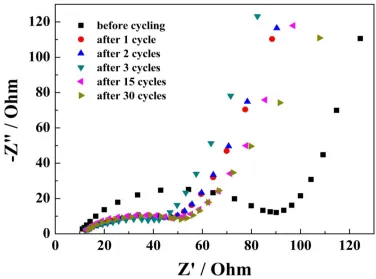
Figure 7. EIS of SnO2-nanometer graphite flakes composite by applying an AC voltage of 5 mV in the
Fig.7 shows the EIS of SnO2-nanometer graphite flakes composite, consists of a semicircle at
the high frequency zone and an inclined line at the low frequency region, representing charge transfer and lithium ion diffusion processes, respectively. The diameters of the semicircles in both high and medium frequency areas are much smaller than that of before discharge/charge cycling, indicating that the charge transfer resistances become smaller. The decreased resistance indicates the enhanced ionic conductivity in the composite, which is beneficial for Li+ insertion/extraction into the anodes. From the high frequency region, the Ohmic resistance values of SnO2-nanometer graphite flakes composite are
around 12 Ohm, which is associated with the graphite cannot be exfoliated totally.
4. CONCLUSIONS
SnO2-nanometer graphite flakes composite with 3D structure is synthesized successfully by a
microwave-hydrothermal method used a large flake graphite as raw material. Compared with SnO2/graphene composite, the preparation method of SnO2-nanometer graphite flakes composite is
more simple and controllable. As an anode material in lithium-ion batteries, the SnO2-nanometer
graphite flakes composite exhibits excellent electrochemical performance. With Li insertion and extraction, the formed Sn nanoparticles became smaller and smaller due to electrochemical milling effects and strong attached to the graphite flakes. The conversion reaction of SnO2 in the SnO2
-nanometer graphite flakes composite is reversible to a certain extent due to formed very small Sn nanoparticles. Therefore, all the specific capacities at different current densities begin to increase after the 50th cycle. The discharge specific capacities at the current densities of 300 and 500 mA g-1 are 635.2 and 477.3 mA h g-1 after 400 cycles, respectively. This approach provides a new pathway for preparing graphite-based nanomaterial. The preparation of SnO2-nanometer graphite flakes composite
can be expanded the application of natural large flake graphite in lithium-ion batteries.
ACKNOWLEDGEMENT
The work is supported by National Science and Technology Support Project (no. 2013BAE04B03), Science Youth Fund in Heilongjiang Province (no. QC2013C010), and Science and Technology Research Project of the Heilongjiang Province Department of Education (no. 12531587).
References
1. Y. Z. Su, S. Li, D. Q. Wu, F. Zhang, H. W. Liang, P. F. Gao, et al, ACS Nano, 6 (2012) 8349. 2. D. N. Wang, X. F. Li, J. J. Wang, J. L. Yang, D. S. Geng, R. Y. Li, et al, Journal of Physical
Chemisty C, 116 (2012) 22149.
3. P. C. Lian, X. F. Zhu, S. Z. Liang, Z. Li, W. S. Yang, and H. H. Wang, Electrochimica Acta, 55 (2010) 3909.
4. S. Q. Chen, Y. Wang, H. Ahn, and G. X. Wang, Journal of Power Sources, 216 (2012) 22. 5. D. H. Wang, R. Kou, D. Choi, Z. G. Yang, Z. M. Nie, J. Li, et al, ACS Nano, 4 (2010) 1587. 6. Y. Wang, H. C. Zeng, and J. Y. Lee, Advanced Materials, 18 (2006) 645.
(2011) 7340.
8. G. Derrien, J. Hassoun, S. Panero, and B. Scrosati, Advanced Material, 19 (2007) 2336. 9. F. D. Wu, and Y. Wang, Journal of Materials Chemistry, 21 (2011) 6636.
10. A. Basch, and J. H. Albering, Journal of Power Sources, 196 (2011) 3290. 11. M. M. Atabaki, and R. Kovacevic, Electonic Materials Letters, 9 (2013) 133.
12. P. C. Lian, X. F. Zhu, S. Z. Liang, Z. Li, W. S. Yang, and H. H. Wang, Electrochimica Acta, 56 (2011) 4532.
13. Z. F. Du, X. M. Yin, M. Zhang, Q. Y. Hao, Y. G. Wang, and T. H. Wang, Materials Letters, 64 (2010) 2076.
14. C. H. Xu, B. H. Xu, Y. Gu, Z. Q. Xiong, J. Sun, and X. S. Zhao, Energy and Environmental Science, 6 (2013) 1388.
15. T. Q. Chen, L. K. Pan, X. J. Liu, K. Yu, and Z. Sun, RSC Advances, 2 (2012) 11719. 16. A. K. Yang, Y. Xue, Y. Zhang, X. F. Zhang, H. Zhao, X. Q. Li, et al, Journal of Materials
Chemistry B, 1 (2013) 1804.
17. S. K. Park, S. H. Yu, N. Pinna, S. Woo, B. Jang, Y. H. Chung, et al, Journal of Materials Chemistry, 22 (2012) 2520.
18. H. D. Liu, J. M. Huang, X. L. Li, J. Liu, Y. X. Zhang, and K. Du, Applied Surface Science, 258 (2012) 4917.
19. H. D. Liu, J. M. Huang, X. L. Liu, J. Liu, Y. X. Zhang, and K. Du, Physica E, 44 (2012), 1931. 20. C. H. Xu, J. Sun, and L. Gao, Nanoscale, 4 (2012) 5425.
21. X. S. Zhou, Y. X. Yin, L. J Wan, and Y. G. Guo, Journal of Materials Chemistry, 22 (2012) 17456.
22. J. Zhang, X. H. Liu, L. W. Wang, T. L. Yang, X. Z. Guo, S. H. Wu, et al, Carbon, 49 (2011) 3538. 23. B. Zhang, Q. B. Zheng, Z. D. Huang, S. W. Oh, and J. K. Kim, Carbon, 49 (2011) 4524.
24. Y. Q. Yang, R. Q. Pang, X. J. Zhou, Y. Zhang, H. X. Wu, and S. W. Guo, Journal of Materials Chemistry, 22 (2012) 23194.
25. X. R. Wang, X. L. Li, L. Zhang, Y. Yoon, P. K. Weber, H. L. Wang, et al, Science, 324 (2009) 768.
26. M. J. Allen, V. C. Tung, and R. B. Kaner, Chemical Reviews, 110 (2010) 132. 27. S. Park, and R. S. Ruoff, Nature Nanotechnology, 4 (2009) 217.
28. L. L. Liu, M. Z. An, P. X. Yang and J. Q. Zhang, International Journal of Electrochemical Science, 10 (2015) 1582.
29. J. H. Kong, W. A. Yee L, L. P. Yang, Y. F. Wei, S. L. Phua, H. G. Ong, et al, Chemical Communications, 48 (2012) 10316.
30. I. R. M. Kottegoda, N. H. Idris, L. Lu, J. Z. Wang, and H. K. Liu, Electrochimica Acta, 56 (2011) 5815.
31. J. Yao, X. P. Shen, B. Wang, H. K. Liu, and G. X. Wang, Electrochemistry Communications, 11 (2009) 1849.
32. X. J. Zhu, Y. W. Zhu, S. Murali, M. D. Stoller, and R. S. Ruoff, Journal of Power Sources, 196 (2011) 6473.
33. B. Wang, D. W. Su, J. Park, H. Ahn and G. Wang, Nanoscale Research Letters, 7 (2012) 215. 34. H. J. Kim, Z. H. Wen, K. H. Yu, O. Maob, and J. H. Chen, Journal of Materials Chemistry, 22
(2012) 15514.