Automatic Wood Classification using a Novel Color
Texture Features
Shivashankar S.
Department of Computer Science, Karnatak University, Dharwad-580003,
Karnataka, India
Madhuri R. Kagale
Department of Computer Science, Karnatak University, Dharwad-580003,
Karnataka, India
ABSTRACT
A variety of texture classification approaches have been reported in the literature but many of them are focused on gray-scale textures. The aim of this work is to develop a novel color texture features by constructing a histogram based on the combined intensity and color channel information to effectively classify color texture images. Five features are computed from the histogram bin values to reduce the computational complexity. Experiments are conducted on a set of 164 color texture images from VisTex database. The K-Nearest Neighbor (K-NN) classification method is used as a classifier. The classification results are encouraging to use the proposed scheme with reduction in features. Further the proposed scheme is used in automatic wood classification to show the usefulness of the proposed scheme in industrial applications.
Keywords
Intensity and color channel, Histogram bins, Feature computation, Wood classification, Color texture features, K-NN classifier.
1.
INTRODUCTION
Texture classification is largely explored topic in the field of texture analysis. Color and texture are the two main attributes used to deal with real world images for color texture classification problems. Various color texture classification approaches have been developed and implemented in numerous tasks comprising Medicine, Content Based Image Retrieval (CBIR), Industry and many other computer vision applications.
Barata, Ruela, Francisco, Mendonca and Marques [1] have published two systems for skin lesion classification by employing color and texture features to diagnose the melanoma in dermoscopy images. Sertel, Kong, Catalyurek, Lozanski, Saltz and Gurcan [2] have extracted tissue properties at pixel level by combining model-based intermediate representation with texture features to develop a new color texture analysis method in medicine field. Hiremath, Shivashankar and Pujari [3] have introduced a CBIR application, in which wavelet based color texture features have been extracted and used in the classification step to obtain better results. Yadav, Roy and Kumar [4] have presented a study of content based image retrieval systems and texture analysis applications.
The industrial applications utilize the pattern recognition methods to yield better classification results with less computational complexity. In industrial applications, automatic grading of products namely ceramic tile [5], fabric [6], leather [7] and paper [8] have been discussed. Wood and granite are widely used industry products for the development of automatic machine vision system to identify the quality of the product. In the literature, applications of computer vision
to the wood industry have been proposed [9-11]. Bombardier and Schmitt [12] have implemented fuzzy rule classifier to deal the color texture classification of an industrial product wood for color recognition. Akhloufi, Larbi and Maldague [13] have introduced a new framework for industrial product inspection (wood, roofing shingles) by extracting statistical features from combined color and texture information. A method which employed spectrophotometer to evaluate inter-class color differences of wood surfaces is described in [14]. In paper [15], colour-based classification of rubber wood boards for fingerprint manufacturing has demonstrated. In the present study, our prime motive is to develop a novel color texture features by constructing a histogram based on the combined intensity and color channel information to effectively classify color texture images. Five features are computed from the histogram bin values to reduce the computational complexity. Experiments are performed on a set of 164 color texture images from VisTex database. The K-Nearest Neighbor (K-NN) classification method is used as a classifier. The classification results are encouraging to use the proposed scheme with reduction in features. Further the performance analysis of the proposed scheme in automatic wood classification is examined to show its usefulness in industrial applications.
The major contributions of this paper are organized as follows, section 2 presents proposed scheme with details of histogram construction and feature computations. Texture classification is explained in section 3. Section 4 describes experiments and results along with the use of proposed scheme in wood classification as an industrial application. Finally, conclusions are mentioned in section 5.
2.
PROPOSED SCHEME
The proposed scheme is divided into two parts, histogram construction and feature computations.
2.1
Histogram Construction Using
Intensity and Color Channel Information
A histogram (H) is constructed using the intensity and color channels of a color texture image. We consider pair of images says (I, R), where I is the intensity image and R is the red channel image and compute the histogram (H). It captures intensity variations as a texture along with color variations for given directions as described in [16], the detailed algorithm is presented in Appendix (section 6). The bin values of the histogram are further used for the computations of features.2.2
Feature Computations
The five features namely, mean, standard deviation, homogeneity, slope and entropy are computed using the histogram bins. The computations of features are as follows:
ii.
(2) iii. (3) iv. Slope of the regression line fitted across the
normalized cumulative histogram of H [17]. (4) v. (5) where n is the number of bins in the histogram and hb is the b
th
bin value of the histogram H. The schematic diagram of the proposed scheme is shown in Fig. 1. The proposed features are further used for the industrial application namely, wood classification.
3.
TEXTURE CLASSIFICATION
Classification of texture images consists of two stages, training and testing. The 50% randomly selected samples from each class are used for training and remaining 50% samples are used for testing.
3.1
Training
The features are computed for each of the train samples using the proposed scheme and are stored in the feature library, which are further used for texture classification.
3.2
Testing
The features are computed for a test sample using the proposed scheme and compared with the features of all the training samples stored in the feature library using l1-norm as the distance metric [18], given in (6),
(6) where pi and qi represents the feature vectors of training and testing samples respectively. Then the test sample is classified using K-Nearest Neighbor (K-NN) classifier. In the present work, it is chosen as K=1.
4.
EXPERIMENTS AND RESULTS
The experimental tests are performed using 164 color texture images with size 128×128 from Vision Texture (VisTex)
database [19]. Each image is considered as one class for classification purpose. The image from the database has been subdivided into 20 overlapping randomly selected sub images of size 100×100 which results into a set of 3280 (164*20) samples. Further 10 randomly chosen samples from each class were used for training and the remaining 10 samples for testing [20]. The classification performance is evaluated by using proposed method as described in section 2. Table 1 shows the correct classification rate averaged over 10 experiments. It can be observed from the Table 1 that the maximum correct classification rate of 98.12% is achieved for the combination (I, R), (I, G), (I, B) at distance d = 1 and θ = 0°, 45°, 90°, 135°. It is observed that the correct classification rate of 97.93% is obtained when θ = 0° is considered.
Hence, there is a reduction in number of features from 60 to 15 but there is no significant reduction in the correct classification rate. These reduced feature set are further used for an industrial application, wood classification, to show the effectiveness of the proposed scheme..
4.1
Application to Wood Classification
Wood is widely used material in variety of applications namely, construction, furniture, shipbuilding and interiors. The selection of wood is done using two properties like quality and price based on its visual surface appearance. While choosing the wood for flooring, strict selection methods are employed to achieve better results. The grading of wood is determined by fiber type and color tone for selecting beautiful and uniform surfaces. In order to satisfy this requirement, producers have made efforts to increase the quality standards of the wood. Thus wood classification is the major part in the analysis of wood textures as an industry product. The manual inspection of wood quality takes longer time, hectic work and subjective. So there is a need of developing computer vision techniques for automatic wood classification. Bianconi, Fernandez, Gonzalez and Saetta [21] presented wood surface grading using statistical properties on the parquet hardwood image database.Fig1: Schematic diagram of the histogram construction for the color texture image
Intensity Image (I) Color Image
Red channel (R) Green channel (G) Blue channel (B)
(I,R)
Histogram (H)
Feature computations
Mean
Std_dev
Homogeneity
Slope
Entropy
Table 1. Correct classification rate (%) of the proposed method using five features for intensity and color channel combinations at distance d=1, angle θ = 0°
, 45°, 90°, 135° and θ = 0°
Intensity and color channel combination
θ = 0°
, 45°, 90°, 135° θ = 0°
No. of features
Correct classification
rate(%)
No. of features
Correct classification
rate(%)
(I,R) 20 96.17 5 93.55
(I,G) 20 95.70 5 93.17
(I,B) 20 94.88 5 91.04
(I,R),(I,G) 40 97.63 10 97.39
(I.R),(I,B) 40 97.76 10 97.08
(I.G),(I,B) 40 97.70 10 95.83
(I,R),(I,G), (I,B) 60 98.12 15 97.93
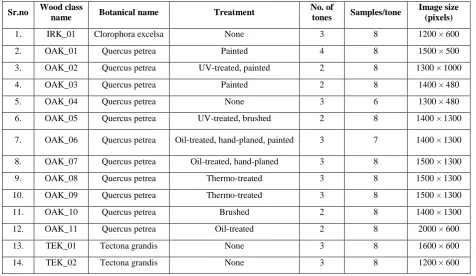
Table 2. Details of Parquet hardwood images used in experimentation
Sr.no Wood class
name Botanical name Treatment
No. of
tones Samples/tone
Image size (pixels)
1. IRK_01 Clorophora excelsa None 3 8 1200 × 600
2. OAK_01 Quercus petrea Painted 4 8 1500 × 500
3. OAK_02 Quercus petrea UV-treated, painted 2 8 1300 × 1000
4. OAK_03 Quercus petrea Painted 2 8 1400 × 480
5. OAK_04 Quercus petrea None 3 6 1300 × 480
6. OAK_05 Quercus petrea UV-treated, brushed 2 8 1400 × 1300
7. OAK_06 Quercus petrea Oil-treated, hand-planed, painted 3 7 1400 × 1300
8. OAK_07 Quercus petrea Oil-treated, hand-planed 3 8 1500 × 1300
9. OAK_08 Quercus petrea Thermo-treated 3 8 1500 × 1300
10. OAK_09 Quercus petrea Thermo-treated 3 8 1500 × 1300
11. OAK_10 Quercus petrea Brushed 2 8 1400 × 1300
12. OAK_11 Quercus petrea Oil-treated 2 8 2000 × 600
13. TEK_01 Tectona grandis None 3 8 1600 × 600
14. TEK_02 Tectona grandis None 3 8 1200 × 600
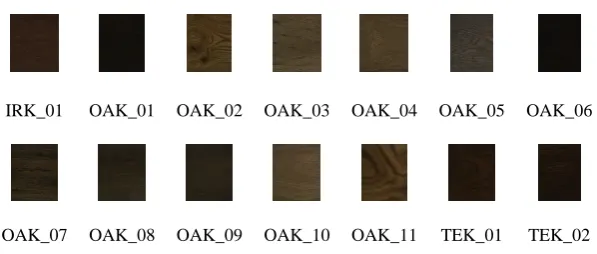
In the present work, we have performed experiments on RGB color space images from Parquet database [22] for flooring wood texture to evaluate the proposed scheme. The database contains fourteen classes of common parquet hardwood with different type, treatment and finish. The number of color tones for class ranges from two to four. The number of samples for tone ranges from six to eight. This creates the database of 295 images in all. The Fig 2. depicts the sample wood images, one from each class. The Table 2 shows the details of Parquet hardwood images used in the experimentations. The features are obtained using the proposed scheme for the combination (I, R), (I, G), (I, B) at distance d = 1 and angle θ = 0°
and
classification results are presented in the Table 3. The first column in the Table 3 shows the feature combinations, the number of corresponding features is shown in the second column. Experimental results obtained for varying number of samples used for training and testing to achieve deterministic estimation of the classification accuracy are given in subsequent columns.
IRK_01 OAK_01 OAK_02 OAK_03 OAK_04 OAK_05 OAK_06
[image:4.595.149.448.65.192.2]OAK_07 OAK_08 OAK_09 OAK_10 OAK_11 TEK_01 TEK_02
Fig 2: The sample images of 14 classes from hardwood parquet database (one per class)
Table 3. Correct classification rate (%) obtained by using proposed method on Parquet database for wood classification
Feature combinations No. of
features
No. of training samples
1 2 3 4 5 6 7
100 bins 300 31.20 37.12 38.49 41.94 46.16 39.64 45.39
Mean 3 83.83 87.61 88.03 89.31 89.89 90.30 89.14
Std_dev 3 41.59 50.33 54.21 60.53 62.61 64.14 64.47
Slope 3 26.36 29.11 28.55 30.84 34.65 28.78 33.55
Mean+Std_dev 6 73.03 82.07 85.26 86.68 88.38 89.31 87.83
Mean+Slope 6 84.68 86.84 88.36 90.13 90.90 90.63 91.12
Std_dev+Slope 6 57.19 68.37 72.17 76.32 79.17 76.15 80.59 Mean+Std_dev+Slope 9 77.40 84.70 87..63 88.73 90.02 89.14 89.80 Mean+Std_dev+Homo+Slope+Entropy 15 75.38 83.17 85.26 87.34 89.04 87.50 89.47
It can also be seen from the Table 3 that as the number of training samples increase, it gives more information about the pattern, hence gives better classification results.
5.
CONCLUSIONS
This work presents a novel color texture features obtained by constructing a histogram based on intensity and color channel information along with their neighboring pixel in an image. The five features namely mean, standard deviation, homogeneity, slope and entropy are computed from the histogram bin values. The classification is carried out using K-Nearest Neighbor (K-NN) classifier. We have performed experimentation on 164 images from VisTex color texture database. The classification results exhibit the success of the proposed scheme. Experiments are also conducted on wood texture database to examine the suitability of the proposed scheme in an industrial application. The experimental results validate the efficacy of the proposed scheme for wood classification. The classification results may be verified for different classification techniques.
6.
APPENDIX
The algorithm for histogram construction of a color texture image is described below:
1. Input the color texture image X= (R, G, B) 2. Compute I = 0.299*R + 0.587*G + 0.114*B 3. Histogram construction
a. Consider the pair of images (I, R) as depicted in Fig 1. b. Consider a pixel Xij with its 8 neighbors in I and the
a4 a3 a2 a5 Xij a1 a6 a7 a8
I R c. Initialize the vector of b bins, H = 0; for i = 1 to P
for j = 1 to Q
Let M=maximum(minimum(Xij,b1),minimum(Yij,a1)); if M = = minimum(Xij, b1)
H(Xij) = H(Xij) + 1; end
end end
where P, Q is the size of the intensity image (I), Xij is the ijth element in I,
Yij is the ijth element in R,
a1 is the neighbor of Xij at distance d = 1 and angle θ = 0°, b1 is the neighbor of Yij at distance d = 1 and angle θ = 0°, nb is the number of bins considered while histogram construction.
7.
ACKNOWLEDGMENTS
Authors thank the referees for their helpful comments and suggestions.
8.
REFERENCES
[1] Barata, C., Ruela, M., Francisco, M., Mendonça, T., and Marques, J. S. 2014. Two systems for the detection of
[2] Sertel, O., Kong, J., Catalyurek, U. V., Lozanski, G., Saltz, J. H., and Gurcan, M. N. 2009. Histopathological image analysis using model-based intermediate representations and color texture: Follicular lymphoma grading. Journal of Signal Processing Systems, 55(1-3), 169.
[3] Hiremath, P. S., Shivashankar, S., and Pujari, J. 2006. Wavelet based features for color texture classification with application to CBIR. International Journal of Computer Science and Network Security, 6(9A), 124-133.
[4] Yadav, A. K., Roy, R., and Kumar, A. P. 2014. Survey on content based image retrieval and texture analysis with applications. International Journal of Signal Processing, Image Processing and Pattern Recognition, 7(6), 41-50.
[5] Kukkonen, S., Kailviaiinen, H., and Parkkinen, J. 2001. Color features for quality control in ceramic tile industry. Optical Engineering, 40(2), 170-177.
[6] Semnani, D., and Sheikhzadeh, M. 2009. New intelligent method of evaluating the regularity of weft-knitted fabrics by computer vision and grading development. Textile research journal, 79(17), 1578-1587.
[7] Yeh, C., and Perng, D. B. 2001. Establishing a demerit count reference standard for the classification and grading of leather hides. The International Journal of Advanced Manufacturing Technology, 18(10), 731-738. [8] Maldonado, J. O., and Grana, M. 2009. Recycled paper
visual indexing for quality control. Expert Systems with Applications, 36(5), 8807-8815.
[9] Sobey, P. J., and Semple, E. C. 1989. Detection and sizing visual features in wood using tonal measures and a classification algorithm. Pattern Recognition, 22(4), 367-380.
[10]Lycken, A. 2006. Comparison between automatic and manual quality grading of sawn softwood. Forest products journal, 56(4), 13.
[11]Piuri, V., and Scotti, F. 2010. Design of an automatic wood types classification system by using fluorescence spectra. IEEE Transactions on Systems, Man, and Cybernetics, Part C (Applications and Reviews), 40(3), 358-366.
[12]Bombardier, V., and Schmitt, E. 2010. Fuzzy rule classifier: Capability for generalization in wood color recognition. Engineering Applications of Artificial Intelligence, 23(6), 978-988.
[13]Akhloufi, M. A., Larbi, W. B., and Maldague, X. 2007. Framework for color-texture classification in machine vision inspection of industrial products. In Systems, Man and Cybernetics, 2007. ISIC. IEEE International Conference on (pp. 1067-1071). IEEE.
[14]Buchelt, B., and Wagenfuhr, A. 2012. Evaluation of colour differences on wood surfaces. European Journal of Wood and Wood Products, 70(1-3), 389-391.
[15]Kurdthongmee, W. 2008. Colour classification of rubberwood boards for fingerjoint manufacturing using a SOM neural network and image processing. Computers and electronics in agriculture, 64(2), 85-92.
[16]Shivashankar S., Kagale M. R., and Hiremath P. S. “Inter intensity and color channel co-occurrence histogram for color texture classification”, In Springer proceedings of the third international conference on Cognitive Computing and Information Processing (CCIP) , Dec 2017, Bengaluru, in press.
[17]Hiremath P. S., and Shivashankar S. 2008. Wavelet based co-occurrence histogram features for texture classification with an application to script identification in a document image. Pattern Recognition Letters 29, 1182-1189.
[18]Duda, R. O., Hart, P. E., and Stork, D. G. 2012. Pattern classification. John Wiley & Sons.
[19]VisTex, 1995. Vision Texture Database, vision and modeling group. MIT media laboratory. http://wwwwhite.media.mit.edu/vismod/imagery/VisionT exture/vistex.html
[20]Paschos, G., and Petrou, M. 2003. Histogram ratio features for color texture classification. Pattern Recognition Letters, 24(1), 309-314.
[21]Bianconi, F., Fernández, A., González, E., and Saetta, S. A. 2013. Performance analysis of colour descriptors for parquet sorting. Expert Systems with Applications, 40(5), 1636-1644.