J. Range Manage 45:148-152, March 1992
Evaluation of microhistological analysis for deter-
mining ruminant diet bbtanical composition
DANIEL ALIPAYO, RAUL VALDEZ, JERRY L. HOLECHEK, AND MANUEL
CARDENAS
Authorsareformergraduate research assistant andprofessor, Dept. of Fishery and Wildlife Sci.. New Mexico State Univ., Las Cruces 88003; professor, Dept. of Animal and Range Science; and professor, Dept. of Experimental Statistics, New Mexico State Univ.
Abstract
The accuracy of microhiitological techniques for analysis of herbivore diets was evaluated with cattle, sheep, and Angora goats fed grass, forb, and shrub mixtures of known botanical composi- tions. Two observers performed microhistological analyses on undigested diets as offered and on feces collected. Similarity indi- ces and chi-square tests were used to determine if differences existed among actual diets, estimated diets, and fecal samples. Botanical compositions of diets fed to all 3 anhnal species generally were accurately estimated by fecal analyses. In some other studies, shrubs in ruminant diets have been inaccurately estimated by the microhistological technique. However, in our study, shrubs were accurately estimated with no differences between actual and observed compositions. We attribute this to the fact that shrub materials used in our study had a high proportion of current growth relative to woody materials. Woody plant parts had lower proportions of identifiable epldermal material than leaves and young stems. In grass-forb diets, forbs sometimes were overesti- mated and differentiation among grasses was difficult. However, In most cases, observers could precisely estimate diets of the 3 herbi- vore species.
Key Words: cattle, sheep, Angora goats, food habits, feces, grasses, forbs, shrubs
In the past 50 years, the microhistological technique introduced by Baumgartner and Martin (1939) has been widely used to deter- mine range herbivore diet botanical composition. The accuracy of this technique was tested by Sparks and Malechek (1968) and found satisfactory. They reported a nearly 1:l correspondence between relative density of species fragments and the actual per- centage composition by weight of hand-compounded diets. How- ever, other researchers report this relationship does not occur for all forages (Holechek and Valdez 1985a, 1985b). Some factors that have a confounding effect on the accuracy of the microscopic technique include (1) differential digestibility of plant species (Ste- wart 1970, Slater and Jones 1971, Vavra et al. 1978, McInnis et al. 1983); (2) presence of woody materials (Holechek and Valdez 1985a, 1985b); (3) observer errors (Holechek et al. 1982); (4) proce- dures used in calculating the diet botanical composition (Holechek and Gross 1982b); and (5) sample preparations (Vavra and Hole- chek 1980, Holechek et al. 1982). The objective of our study was to evaluate the accuracy of the microhistological technique for analy- sis of fecal samples from cattle, sheep, and Angora goats fed several known diets containing grasses, forbs, and shrubs.
Journal Article 1535 of the New Mexico Agr. Exp. Sta., Las Cruces. Manuscript accepted 25 July 1991.
Methods
The diets and fecal samples used in this study were obtained from various nutritional studies (Nunez-Hernandez 1987, Tembo 1987, Rafique 1988, Saiwana 1988, Arthun 1989, Boutouba 1989, Vernet 1989). Species used in the diets include blue grama (Boute- Zoua grucilis (H.B.K.) Lag.), barley straw (Hordeurn vulgure L.), leatherweed croton (Croton corymbulosus Engelm.), scarlet globe- mallow (Sphuerulceu coccineu (Pursh) Rydb.), alfalfa (Medicugo sutivu L.), four-wing saltbush (Atriplex cunescens (Pursh) J.T. Howell), juniper (Juniperus monospermu (Engelm.) Sarg., moun- tain mahogany (Cercocurus montunus Raf.), oak (~Quercus turbi- nellu Greene), and sagebrush (Artemisiu tridentutu Nutt.). The actual composition of the diets offered to the 3 species of herbi- vores is shown in Table 1. Diets were cornposited from forages ground through a 254-mm screen to minimize animal selection. Diets and fecal samples were dried and ground with a Wiley mill to pass a l-mm screen. A composite sample of the ground fecal material was made for each diet in each experiment. Slide prepara- tions followed the method of Sparks and Malechek (1968) as modified by Holechek (1982). The ground material for each sample was soaked in hot water for 10 minutes, followed by bleach (sodium hypochlorite) for 5 minutes to remove plant pigments. The bleached sample was rinsed with warm water until the bleach- ing agent smell was eliminated. Five microscope slides were pre- pared for each composite diet and fecal sample. Hoyer’s mounting solution was used to mount cover slips on the slides. The slides were air dried for 5 to 7 days before analysis. Reference slides were made in the same manner from plant species used in cornpositing diets.
Two observers, trained by the procedures of Holechek and Gross (1982a), analyzed both diet and fecal samples using Nikon binocular microscopes. Samples were analyzed at 100X, although 200X magnification was sometimes used for higher resolution (Holechek and Valdez 1985a). Systematically selected fields were observed on each slide and species were recorded as being present or absent until a total of 100 frequency observations were recorded. The frequency addition procedure described by Holechek and Gross (1982b) was used to calculate the percentage composition by weight. A mean was calculated for each sample from the 2 observers’ readings and was taken to represent estimates for the diet and fecal samples.
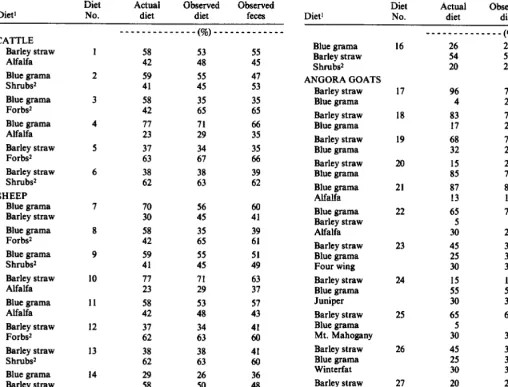
Table 1. Percent compositions by weight of actuai diets, observed diets, and fewa of cattle, sheep, and Angora goats.
Diet1
l-c_. ._..._I _L-- -> T X , ~~ ->
“ltrl ACwaI uoservea umervea
No. diet diet feces Diet’
Diet Actuai Observed Observed
No. diet diet feces
CATTLE Barley straw Alfalfa Blue grama Shrubs* Blue grama Forbsr Blue grama Alfalfa Barley straw Forbsr Barley straw Shrubs2 SHEEP Blue grama Barley straw Blue grama Forbsr Blue grama Shrubs2 Barley straw Alfalfa Blue grama Alfalfa Barley straw Forbs* Barley straw Shrubs2 Blue grama Barley straw AlCalf. ‘,YUnaU Blue grama Barley straw Forbs* 1 2 3 4 5 6 7 8 9 10 ii 12 13 14 15 _____________(%)_____________ 58 42 59 41 58 42 I: 37 63 38 62 :: 58 42 59 41 77 23 58 42 37 62 38 62 29 58 !3 26 54 20 53 48 55 45 35 65 71 29 34 67 z 55 45 47 53 35 65 66 35 35 66 39 62
56 60
45 41
35 39
65 61
55 51
45 49
71 63
29 37
53 57
48 43
34 41
63 60
38 41
63 60
26 36
50 48
25 17
29 25
34 32
38 44
Blue grama Barley straw Shrubs2 ANGORA GOATS
Barley straw Blue grama Barley straw Blue grama Barley straw Blue grama Barley straw Blue grama Blue grama Alfa!fa Blue grama Barley straw Alfalfa Barley straw Blue grama Four wing Barley straw Blue grama Juniper Barley straw Blue grama Mt. Mahogany Barley straw Blue grama Winterfat Barley straw Blue mama Oak p_-___- Barley straw Blue grama Sagebrush 16 17 18 19 20 21 22 23 24 25 26 27 28
26 22 27
54 50 52
20 28 22
96 4 83 17 68 32 15 85 87 !3 65 5 30 45 25 30 15 :: 65 5 30 45 25 30 20 50 30 40 72 28 73 27 ;: 25 76 83 !? 70 6 25 37 30 33 18 52 31 63 2 35 35 32 34 25 45 30 38 35 28 :: 68 32 58 42 25 76 77 23 67 5 29 42 zt 20 48 33 58 8 34 ;: 37 22 48 30 39 33 29 ______________(%)_____________
1Botanical compositions of some diets do not add to 100 because of rounding off. ZForbs = Leatherweed croton + scarlet globemallow (I:]).
2Shrobs = Fourwing saltbush + Mountain mahogany (1:I).
also segregated into grasses, forbs, and shrubs for tests of differen- ces among forage classes. Scientific names of plants followed _ _ _ ^ ^ . Mabberiey (1987) and a field guide by Aiired (1988).
Results and Discussion
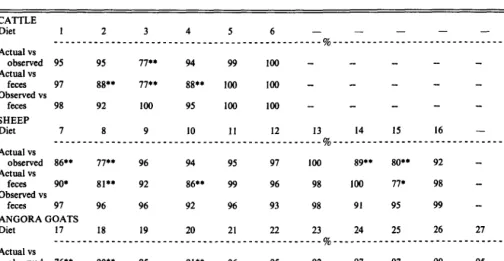
Results from cattle (Table 2) show high average similarities (93,
92, and 98%) for actual/observed, actual/feces, and observed/fe- ces, respectively. Observed values of diets were similar to actual values (p>O.OS), except for the blue grama + forbs diet. Forbs (ieatherweed croton, scariet giobemauow) were overesrnnarea ana blue grama was underestimated in this particular diet. Both observers in our study and in Holechek et al. (1982) found leather- weed croton scarlet globemallow easy to identify because of pres- ence of stellate trichomes in most fields, which may explain why forbs were overestimated. Fecal compositions differed (P<O.O5) from actual compositions in blue grama + forbs, blue grama + shrubs, and blue grama + alfalfa diets. These differences were the results of overestimating shrubs, forbs, and alfalfa in the feces, which in turn caused underestimation -__-___- _____ -__-_. _. -.-. of blue mama. p----mm--- The epider-
ma1 distribution of cutin differ among the plant species (Storr 1961). This difference in the distribution of cutin has been attrib- uted to the observed difference in digestibility of plant species. We believe digestion may have caused the shrubs, forbs, and alfalfa to
break into clusters of cells and hairs or trichomes, which increased their presence relative to blue grama. However, we attribute the accuracy probiem to observer error rather than differentiai diges- tibility because estimates of feces were highly (98%) similar to those of observed diets.
Results from sheep (Table 2) were similar to those from cattle. Among the diets with differences, forbs, (leatherweed croton, scar- let globemallow) and alfalfa were overestimated, while grasses (blue grama, barley straw) were correspondingly underestimated (Tabie i j. Forbs were overestimated in the sheep diets for the same reasons suggested for the cattle diets. Leatherweed croton, scarlet globemallow, and other species with dense stellate hairs or tri- chomes can be overestimated because these parts are easy to iden- tify @later and Jones 1971, Sanders et al. 1980, Holechek et al. 1982). There was no consistent trend for over or underestimation of individual grass species in diets with 2 or more grass species. In some diets, blue grama and barley straw were overestimated because of the difficulty in distinguishing between the 2 species.
The chane. aim and *.__ I ---=-, ----, -__- - _____ arrannement of the ordinarv eaidermai ceils ~ __.._... _. ..- _.-..._-, -~---..~ for the 2 grasses were about the same. Our observers noted that a better feature for distinguishing blue grama from barley straw was stomata1 cells. Stomata cells within each species are much more constant in size and shape than ordinary epidermal cells (Storr
Table 2. Percent similarity between botanical composition of actual diets and from observed diets and feces of cattle, sheep, and Angora goats. (See Table 1 for diet compositions).
CATTLE
Diet _!______“______‘.____._“.______5____.._”______~,____~_____~_____.____.__________~_____“““_.. - -
Actual vs
observed 95 95 77.. 94 99 lot) - - - 93
Actual vs
feces 97 88’5 77++ 88+* 100 )oL) - - - 92
Observed vs
feces 98 92 100 95 100 lt)rJ - - - 98
SHEEP
Diet 7 8 9 10 11 12 13 14 15 16 - - Mean
~___~__________~___~~__~~___~~~__________~~___ %_______________________________________________ Actual vs
observed 86** 77+* 96 94 95 97 loo 89,. 80** 92 - - 91
Actual vs
feces 90. 81** 92 86** 99 96 98 100 775 98 - - 92
Observed vs
feces 97 96 96 92 96 93 98 91 95 99 - - 95
ANGORA GOATS Diet
!~__.___1”._____!~______“______2!____._”_____T’,____“____’I_....“_....“._..__2~.._.._Mean___ Actual vs
observed 76** 90** 95 91** 96 95 92 97 97 90 95 96 93
Actual vs
feces 77*+ 85** 90* 91** 90 99 95 93 93 93 98 98 92
Observed vs
feces 99 95 85** 100 94 97 95 97 94 95 97 99 96
*Si@icantly different (P<O.OS) using chi-square test. **Significantly different (P<O.Ol) using chi-square test.
1961). However, in some instances, it is impossible to separate 2 or more grass species on the basis of their epidermal features alone (Dabo et al. 1986). Sheep data showed a high average similarity (95%) between observed diets and feces.
Angora goat data were consistent with that for cattle and sheep. High average similarity indices (93,92, and 96%) were exhibited for actual/ observed diets, actual diets/feces, and observed diets/- feces, respectively. Based on these data, digestion has little or no influence on proportions of identifiable plant fragments. Our results are in contrast to those reported by Slater and Jones (1971), Vavra et al. (1978), Smith and Shandruk (1979), Leslie et al. (1983) and McInnis et al. (1983). They reported reduced fecal estimates for some plant species, especially forbs because of differential digestibility. However, our findings support results from Free et al. (1970), Todd and Hansen (1973), Anthony and Smith (1974) and
Dearden et al. (1975). They analyzed feces of other ruminants with considerable success. We attribute the accuracy of our results to (1) systematic training of observers (Holechek and Gross 1982a), which accounted for correct identification of the plant species in most of the diets; (2) use of bleach as a blending medium (Holechek 1982, Hinnant and Kothmann 1988) reduced pigment masking of epidermal fragments and increased the percentage of identifiable epidermal fragments; (3) use of actively growing perennial plants with a high proportion of epidermal material, which allowed for complete recovery of epidermal parts; and (4) use of the frequency addition procedure (Holechek and Gross 1982b), which provided reliable representation of dry weight composition.
Table 3. Overall comparison of actual diets, observed diets, and feces on forage class basis using chisquue test.
Grasses
CATTLE
Actual vs observed NS Actual vs feces l
Observed vs feces NS
SHEEP
Actual vs observed ** Actual vs feces ** Observed vs feces NS
ANGORA GOATS
Actual vs observed +* Actual vs feces +* Observed vs feces NS
*Significantly different (P<O.O5). **Significantly different (P<O.Ol). NS = No significant difference (M.05).
Forbs
l * ** NS
** ** NS
NS * NS
Shrubs
NS NS NS
NS NS NS
NS NS NS
Table 3 compares actual diets, observed diets, and feces on forage class basis. Shrubs were accurately estimated in diets of all 3 ruminants. A high proportion of stemmy materials in a browse diet is reported to cause underestimation of shrubs (Holechek and Valdez 1985a). Browse fed to cattle, sheep, and Angora goats in our study involved leaves and twigs from current growth, which, unlike old stems, have a high proportion of epidermal material, Differences in grasses and forbs reflect overestimation of leather- weed croton and scarlet globemallow, which reduced the grass estimates.
Comparison (Table 4) between the 2 observers revealed their observations were similar for all 3 ruminant species, although minor differences occurred for some diets because of problems in differentiating among grass species. In general, high precision was achieved by the 2 observers. We attribute this to the fact they were systematically trained in procedures of Holechek and Gross (1982a). Westoby et al. (1976) also stressed that accuracy of microscopic analysis of diets depends on systematic training of observers.
Table 4. Percent similarity between observer 1 and 2 for observed diets and feces of cattle, sheep, and Angora goats.
CATTLE
Diet 1 2 3 4 5 6 Mean
___________________________-_--_--- ______%_____________-_- _____________________-_____-_-- Observer
ivs2 91 96 100 98 100 95 - - - -
(Observed) Observer
1 vs 2 86* 92 100 91 97 95 _ - - -
(Feces) SHEEP
Diet 7 8 9 10 11 12 16
_______________~____~~~~~_~~_~~~~~~~~~-~- ____i”_,___!4_____!I________ Observer
1 vsi 83* (Observed)
100 90 98 91 100 95 93 85 98
Observer 1 vs 2 832 W=)
ANGORA GOATS
Diet 17
-_-_ Observer
1 vs 2 s4** (Observed) Observer
1 vs 2 55** (Feces)
98 98 80** 90 96 93 85 84* 96
26 _1.“______!9____.“_______‘.‘_____Tt______2~_,___‘“.____..’I.__.___.
78** 100 85* 94 96 90 87 100 86
85* 74** 89 100 95 96 852 92 99
_____
,_-_-- ____
27 __-_
86
90 ___
_-_
96
94
Mean _______________
93
90
28 Mean
_-_____________
86 87
92 88
l Significantly different (P<O.OS) using chi-square test. l *Significantly different (P<O.Ol) using &i-square test.
fecal analysis can be a useful tool to estimate ruminant diet botani- cal composition. Accurate estimates of the diet composition of large herbivores depend on systematic training and adequate prac- tice by the observers. The microscope technique can only be a useful tool if observers have a 90% or more recognition level of the plant species being examined, and if they become careful not to overestimate species with stellate trichomes or hairs. Identification of such species should be based only on those trichomes attached to recognizable epidermal tissues and cell pattern and/or stomata pattern on peridermal tissues.
Literature Cited
Aiired, K. 1988. Afield guide to the flora of the Jomada Plain. New Mexico State Univ. Agr. Exp Sta. Bull. 739.
Anthonv. R.G.. and N.S. Smith. 1974. Comnarison of rumen and fecal analysis to describe deer diets. J. Wildl. Manage. 38:535-540. Artimn, D. 1989. Influence of forbs and shrubs on intake, digestibility,
energy and nitrogen balance, ruminal fermentation and digesta kinetics in beef steers fed low-quality forages. Ph.D. Diss., New Mexico State Univ., Las Cruces.
Baumgartner, L.L., and A.C. Martin. 1939. Plant histology as an aid in sauirrel food-habit studies. J. Wiidl. Manage. 3:266-268.
Boutouba, A. 1989. Evaluation of two diet& levels of high and low phenoiic native shrubs on the nutritive value of Angora goat diets. M.S. Thesis. New Mexico State Univ.. Las Cruces.
Dabo, SM., R.J. Tyri, and F.O. Tbetford. 1986. Identification of grass epidermal fragments. Oklahoma State Univ. Agr. Exp. Sta. Res. Rep. Proj. 1698.
Dearden, B.L., R.E. Pagau, and R.M. Hansen. 1975. Precision of micro- histological estimates of ruminant food habits. J. Wildl. Manage. 39402407.
Free, J.C., R.M. Hansen, and P.L. Sims. 1970. Estimating dry weights of food plants in feces of herbivores. J. Range Manage. 23:300-302. Hhmant, R.T., and M.M. Kothmamr. 1988. Collecting, drying and preserv-
ing feces for chemical and microhistological analysis. J. Range Manage. 41:168-171.
Hoiecbek, J.L. 1982. Sample preparation technique for microhistological analysis. J. Range Manage. 35:267-268.
Hoiechek, J.L., and B.D. Gross. 1982~. Training needed for quantifying diets from fragmented range plants. J. Range Manage. 35:644-X148.
Hoiecbek, J.L., and B.D. Gross. 1982b. Evaluation of diet calculation procedures for microhistologicalanalysis. J. Range Manage. 46~502-505. Hoiechek, J.L., B. Gross, S.M. Dabo, and T. Stephenson. 1982. Effects of sample preparation, growth stage and observer on microhistological analysis of herbivore diets. J. Wiidl. Manage. 46502-505.
Hoiechek, J.L., and R. Vaidez. 198%. Magnification and shrub stemmy materials influences on fecal analysis accuracy. J. Range Manage. 38:350-352.
Hoiechek, J.L., and R. Vaidez. 1985b. Evaluation of in vitro digestion for improving botanical estimates of mule deer fecal samples. J. Mamm. 66~574-577.
Leslie, D.M., Jr., M. Vavra, E.E. Starkey, and R.C. Siater. 1983. Correct- ing for differential digestibility in microhistological analysis involving common coastal forages of the Pacific Northwest. J. Range Manage. 36~730-732.
Mabberiey, D.J. 1987. The plant book: A portable dictionary of the higher plants. Cambridge Univ. Press, London.
McInnis, M.L., M. Vavra, and W.C. Krueger. 1983. A comparison of four methods used to determine the diets of large herbivores. J. Range Man- age. 36:302-306.
Nunez-Hernandez, G. 1987. Effect of low and high phenolic browse plants on the nutritive value of Angora goat diets. MS. Thesis, New Mexico State Univ., Las Cruces.
Oosting, H.J. 1956. The study of plant communities. W.H. Freeman and Co., San Francisco.
Raflque, S. 1988. Influence of forbs and shrubs on intake, digestibility, energy and nitrogen balance, ruminal fermentation and digesta kinetics in sheep fed low quality forages. Ph.D. Diss., New Mexico State Univ., Las Cruces.
Saiwann, L.L. 1988. Effect of non-phenolic and phenolic browse plants on the nutritive value of Angora goat diets. M.S. Thesis, New Mexico State Univ., Las Cruces.
Sanders, K.D., B.E. Dal, and G. Scott. 1980. Bite-count versus fecal analysis for range animal diets. J. Range Manage. 33:146-149. Siater, J., and R J. Jones. 1971. Estimation of the diets selected by grazing
animals from microscopic analysis of the feces-A Warning. J. Austrai- ian Inst. Agr. Sci. 37:238-240.
Smith, A.D., and L.J. Shandruk. 1979. Comparison of fecal, rumen and utilization methods for ascertaining pronghorn diets. J. Range Manage. 321275-279.
Sparks, D.R., and J.C. Maiechek. 1968. Estimating percentage dry weight in diets using a microscope technique. J. Range Manage. 21:264-265.
Steel, R.G.D., and J.H. Torrie. 1980. Principles and procedures of statis- tics. McGraw-Hill Book Co., New York.
Stewart, D.R.M. 1970. Survival during digestion of epidermis from plants eaten by ungulates. Rev. Zoo. Bot. Afr. 82:343-348.
Starr, GM. 1961. Microscopic analysis of faeces, a technique for ascertain- ing the diet of herbivorous mammals. Australian J. Biol. Sci. 14: 157- 164. Tembo, H. 1987. Determining intake and forage quality by evaluating fecal characteristics of Angora goats. M.S. Thesis, New Mexico State Univ., Las Cruces.
Todd, J.W., and R.M. Hansen. 1973. Plant fragments in the feces of bighoms as indicators of food habits. J. Wild]. Manage. 37:363-366. Vavra, M., and J.L. Holechek. 1980. Factors influencing microhistological
analysis of herbivore diets. J. Range Manage. 33:371-374.
Vavra, M., R.W. Rice, and R.M. Hansen. 1978. A comparison of esopha- geal fistula and fecal materials to determine deer diets. J. Range Manage. 31:11-13.
Vernet, M.A. 1989. Influence of low phenolic native shrubs on Angora goat nutrient retention. M.S. Thesis, New Mexico State Univ., Las Cruces. Westoby, M., G.R. Rost, and J.A. Weis. 1976. Problems with estimating