Symposium on Animal Genetics: X I I I International Congress of Genetics
SELECTION FOR GROWTH RATE, FEED EFFICIENCY
AND BODY COMPOSITION I N MICE
T. M. SUTHERLAND, PATRICIA E. BIONDINI AND G. M. WARD Colorado State University,
Fort Collins, Colorado 80521
ROWTH
rate and efficiency of feed utilization are two of the most economi- cally important characters in the production of meat animals. In these days of world shortage of both plant and animal protein, and with an energy crisis looming on the horizon, the necessity both to reduce maintenance costs by speed- ing up growth rate and to improve the efficiency of growth by improving the efficiency of conversion of plant feed to animal protein, has become more urgent than ever.Many studies have been reported on efficiency of feed conversion, dealing with the physiological parameters which affect it and which could conceivably show genetic variability. These parameters include the efficiency with which ingested nutrients are absorbed through the gut (Digestibility), the energy required to maintain body weight (Maintenance), and the efficiency with which absorbed nutrients are converted into a given body tissue, principally protein and fat, and the relative efficiencies of the deposition of these two. Perhaps the most important influences treated have been the differences in feed intake (appetite), and the ratio of fat to lean in the tissue gained. Many individual studies have also been carried out on growth rate and body composition, but few have attempted to relate these to each other or to the physiological factors affecting efficiency.
The present paper attempts to synthesize our knowledge by treating the phys- iological characters mentioned above and the interrelationships among the three characters of growth rate, feed consumption, and composition of the body, along with the “synthetic character” generally called feed efficiency, the ratio of gain in weight of body to the amount of feed consumed over a given period of time. A review of published results will be presented and compared to the results from our own mouse laboratory in Colorado. Projections from mice to large animals will be made periodically to see what insights may be offered on an economic scale.
PHYSIOLOGICAL PARAMETERS AFFECTING EFFICIENCY
Digestibility: Differences in the ability of animals to extract nutrients from feed appear to be slight when the same feed in the same physical form is fed at similar levels of intake. This is true not only within species but also the digesti- bility by sheep and cattle for all practical purposes is the same (BAXTER 1964). FOWLER (1962), however, found that her rapidly growing large strain of mice
526 T. M. S U T HE R L A N D , PATRICIA E. B I O N D I N I A N D G. M. WARD
absorbed more protein, more fat, but less carbohydrate from the feed than did her small strain. The net result was that energy digestibility was essentially the same for both strains.
Maintenance considmations: Maintenance requirement is defined as the en- ergy necessary to maintain body weight, without either gain or loss of tissue, and represents basal heat loss plus an energy cost €or activity. Extra energy required to metabolize higher nutrient intake is not included; this cost is borne as part of the cost of gain. Maintenance requirements are a function of the metabolically active weight of the body rather than body weight.
BRODY
(1945) proposed a uni- versal figure of 70 kcal/ (kg body weight) . 7 3 . Although there are differences among species, the variation of mature age animals within species is minimal(
BLAXTER
1962).There are technical problems in partitioning energy use between maintenance and growth, but the primary consideration is basal heat production, which ac- counts for the major portion (about 80%) of the maintenance requirement, and which shows a very small standard deviation among animals. Activity unques- tionably varies among animals but can hardly be an overwhelming source of total variability in maintenance requirement.
Eficiency of tissue growth: The most important question of energy efficiency in quantitative terms is whether there are differences between animals in the conversion to body tissue of metabolizable energy above maintenance. I t is here that the need for information on body composition becomes apparent. Animal nutritionists and physiologists have been interested in the variability of these traits but not in the genetics of the problem. Animal breeders have looked at the genetic variation in efficiency of animal production but in nearly all cases the terms used to express efficiency were too imprecise to be of great value, for the reasons outlined below.
TAYLOR
andYOUNG
(1964) studied the efficacy as determined by feedJgain ratio of monozygous and dizygous twin cattle. The composition of body tissue, however, was unknown and, therefore, energetic or net efficiency could not be calculated. KOCH et al. (1963) concluded that feed efficiency was more heritable than feed consumption in beef cattle, although these two parameters were highly correlated. Their conclusion likewise was based only upon body weight changes and did not consider differences in body composition. Genetic differences in the ability to convert metabolizable energy to tissue energy in cattle and sheep are probably minimal, but no clear statement can be made based o n data available at present.SELECTION I N M I C E 527
ably, therefore, might result in fatter animals rather than leaner, potentially larger animals which we have assumed in the past would be the result.
GROWTH RATE, FEED I N T A K E A N D E F F I C I E N C Y
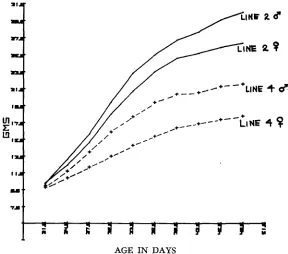
I n discussing growth rates and feed efficiencies, certain parameters need to be kept in mind. The typical growth curve shown by mammals on ad libitum feed- ing regimes is approximately as shown in Figure 1, the exact shape depending on the strain measured. The concomitant changes in feed intake on an ad libitum
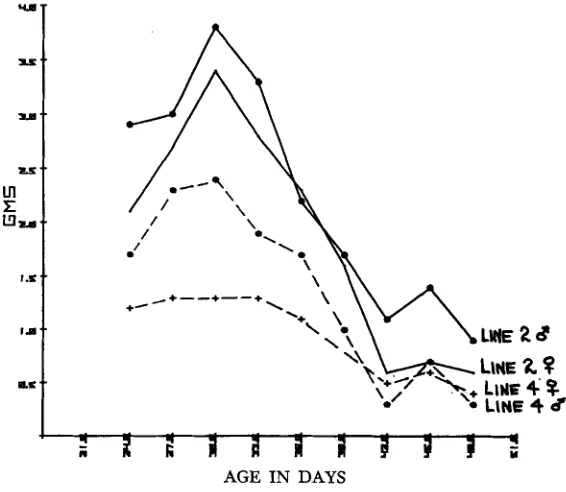
regime follow a pattern as shown in Figure 2. For a high gaining line such as in Line 2, the rapid increase tapers off sharply and then even decreases slightly.
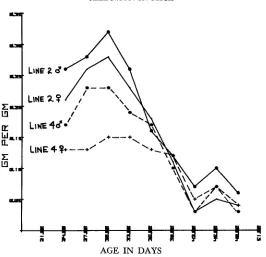
When weight gains per period of several days or per week are plotted against age, the slope after day 30 for mice appears almost linear, and is approximately as shown in Figure 3 . When these consistently decreasing gains are divided by the feed intake which, as we saw, increases then essentially levels off
,
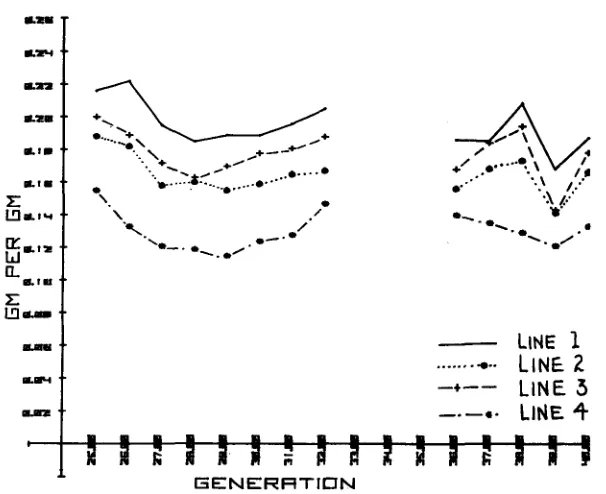
the result- ing gross efficiencies (ratio of gain/feed) show a brief increase during the most rapid growth, then a consistent decrease over age, as pointed out by SUTHERLAND and OLLIVIER (1969) f o r swine, by TIMON and EISEN (1970) for mice, and cor- roborated by the results from our own laboratory (see Figure4).
When weight gains cease, of course “gross efficiency” is forced to zero, but this point is essenti- ally never reached in the production of meat animals for slaughter.7.m
t
AGE IN DAYS
528 T. M. S U T H E R L A N D , PATRICIA E. B I O N D I N I A N D G . M. WARD
AtiE IN BAYS
FIGURE 2.-Feed intake per 3-day period by Line 2 and Line 4.
AGE IN DAYS
SELECTION I N MICE
-7
529
\
AGE IN DAYS
FIGURE 4.-Feed intake per 3-day period by Line 2 and Line 4.
The net result of these patterns of gro,wth is that in comparing strains o r lines of animals, the period of the growth curve studied makes a great deal of differ- ence in the conclusions likely to be reached.
In studying growth rate and feed efficiency, too, the maintenance requirements always complicate the picture. If the comparison between two lines of different growth rates is made over a constant age interval, the more rapidly growing lines weigh more, at least by the end of the test period, and therefore, have more weight to maintain. The ratio of gain/feed, or gross efficiency would seem, therefore, to penalize the faster gaining lines. Despite this handicap, faster gaining lines al- most invariably show a gross efficiency superior to slower gaining lines. This claim is supported by the findings of
FALCONER
(1 959), FOWLER (1 962),RAHNE-
FELD et al. ( 1965), LANG and LEGATES (1 969), SUTHERLAND et al (1 970), and by TIMON and EISEN (1970), who have done perhaps the most exhaustive analysis thus far of the interrelationships among growth, appetite and efficiency. The difference between the least squares means of the efficiencies of the High gaining and control lines of TIMON and EISEN over the period 21-57 days of age was .Oleg m
per which was highly significant. When broken into three periods of 12530 T. M. SUTHERLAND, PATRICIA E. BIONDINI A N D G . M. WARD
credit f o r maintaining extra weight. During period I1 (33-45 days), the differ- ence was significant even at the .001 level.
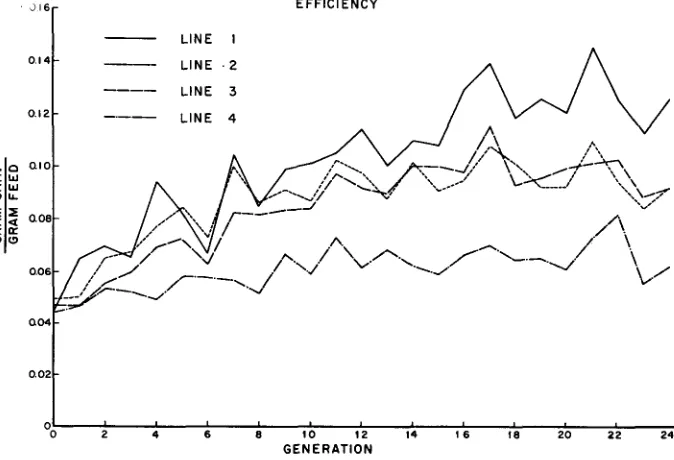
Turning to the Colorado results, SUTHERLAND et al. (1970) analyzed the results of 21 generations of selection and obtained a realized genetic correlation of .91, identical to that calculated from a variance component analysis, for the association of rate of gain and gross efficiency. The high gaining lines showed an ever increasing efficiency over the generations of .0031 f .0007, .0006 f .0006, and .0013 f .0005 (regression of gross efficiency on generation number)
compared to a very trivial change in the control line of .0002
As shown in Figure 5, selection for efficiency was indeed the most effective in changing efficiency; Line 1 was consistently the most efficient. Line 2 selected for appetite was, over the generations, approximately equal to Line 3, selected for growth rate, the test period being from weaning at 4 weeks to the age of 11 weeks. All three lines were greatly superior in gross efficiency to the control, the mean values in generation 21 being about twice as high as the control line.
An alternate way of examining relative efficiencies of fast and slowly gaining lines is over a weight constant test. Again a complication appears because al- though the weight maintained is now identical, the time period during which it is maintained becomes variable. Fewer studies have been conducted on this basis.
TIMON and EISEN (1970) again, however, examined their data over a weight constant period of 10 gms between the weights of 15 g m s and 25 gms. Predictably, the High line was still superior, the least squares mean difference of .062 being significant at the .001 level. When number of days to gain the 10 gms was intro- duced as a covariate, the difference dropped to a non-significant .01; this adjust-
.0004.
0
W L
z w
a w
a a z s E K o w
EFFICIENCY
LINE I
:I
, , , , , , , , , , ,0
2 4 6 8 10 12 14 16 18 20 2 2 24
GENERATION
SELECTION I N MICE 531
ment appears to be valid, for the maintenance requirements should be strictly proportional to the number of days required to gain the 10 gms. Using the assump- tions that growth was linear in both lines between the weights of 15 and 25 gms. (which appeared to be so in the growth curves) and that maintenance costs as a function of body weight were the same in both lines (which appears to be a reasonable but undocumented assumption, at least in their data), the authors conclude, “This result suggests that selection f o r postweaning gain has caused a change in gross efficiency but not in net efficiency of tissue growth”, since the two lines are thereby compared over a constant weight gain made over a constant time period, and show little difference in efficiency. We may further suggest that the small remaining difference (which admittedly was statistically non-significant) could be due to slight residual differences in the age of the animals, the faster gaining being younger, resulting in the deposition of a tissue of lower energetic value.
From an intensive study of digestibility and energy expenditure in FALCONER’S large and small strains of mice,
FOWLER
(1962) concluded that ‘‘inherent differ- ences in growth rate between the selected lines could not be attributed to basic changes in energy metabolism increasing o r decreasing the amount of food avail- able for growth purposes,” (italics ours) and that “the main difference thus lay in the amount of food consumed”.The net conclusion, then, from these studies is that in tissue growth there seems to be relatively little if any variation in net efficiency among animals. Such in- creases in gross efficiency as do appear seem to be the result of increased capacity to ingest nutrients; the increased intake can virtually all be utilized for tissue growth since basic maintenance requirements are already met. When total weight gain is expressed as a ratio to total feed intake, the gross eficiency automatically appears to have been markedly improved, and of course from an economic stand- point, this is a very valuable circumstance.
Increasing appetite, therefore, should lead to increased gains and improved gross efficiency. Paradoxically, however, in selecting for appetite in one line of
mice, SUTHERLAND et a2 (1970) obtained a realized heritability of only 0.20. The realized genetic correlation between feed and gain was .71, but between feed intake and efficiency was only .36. Genetic variation in feed intake in these selec- tion studies would therefore account for only 50% and 13% respectively of the variation in gain and efficiency.
532 T. M. S U T H E R L A N D , PATRICIA E. B I O N D I N I A N D G. M. WARD
...
-t
FIGURE &--Gain in body weight during the test period for generation 25 to generation 40.
I +
I \
LINE 1
e... LINE 2,
4-
-
LINE 3*.
LINE 4...
-.-
SELECTION IN M I C E 533
E 1 1
-
LIHE1
...,..e-.
LINE
2
LINE
3
-.
-..
LINE4
-,-e
A
GENERRTIUN
FIGURE S.-Eficiency ob feed use during the test period for generation 25 to generation 40.
creased gains were ever larger increases in feed consumption-between genera- tions 25 and 27 intake increased by almost 50
%
(Figure 8), with the result that gross efficiency showed drastic declines between generations 25 and 28.A
stepwise multiple regression analysis was carried out in many combinations. The model included weight gain or efficiency as the dependent variable, and linear and quadratic terms for such traits as feed consumption, body weight at3, 5 , and 7 weeks and generation number as the independent variables. All vari- ables except generation number were considered as deviations from the control line value f o r the particular generation. The r2 values ranged from .64 to .76 be- tween gain and feed, and further variables introduced to the model made virtu- ally no difference in improving
R2
over r2.The overall conclusions appear to be that both growth rate and appetite are under genetic control and are rather highly correlated. Selection for increased growth rate is effective and is mandatorily accompanied by increased appetite, which results in improved gross efficiency but no change in net efficiency of tissue growth. Selection for appetite, on the other hand, is less effective in changing
growth rate and results in somewhat lower p s s efficiency, but presumably also unchanged net efficiency of tissue growth.
GROWTH RATE A N D BODY COMPOSITION
534 T. M. SUTHERLAND, PATRICIA E. BIONDINI A N D G. M. WARD
are frequently ignored in growth and carcass composition studies, especially by geneticists! When one considers the fat-free tissue, comprising water, protein and ash, from conception, the percentage of water decreases while the percentage of protein and ash increases to a point which ~ L ~ O U L T O N described as the point of “chemical maturity.” MOULTON postulated this point to occur at approximately 4%
%
of the life from conception to death and thus should be near 30 days of age for mice with a life span of three years and 150 days in cattle with a life span of 25 years. From chemical maturity until old age, the fat free body has a remark- ably constant composition as illustrated ideally in Figure 9 and shown in reality by the compositions of a sample of mice from generation 42 from our laboratory(Figure 10). Our data appear to indicate day 45 as the point of maturity.
When fat is considered, the picture becomes much less consistent, for fat is much more variable than the other body constituents. The percentage of €at in- creases consistently and well beyond the normal slaughter age.
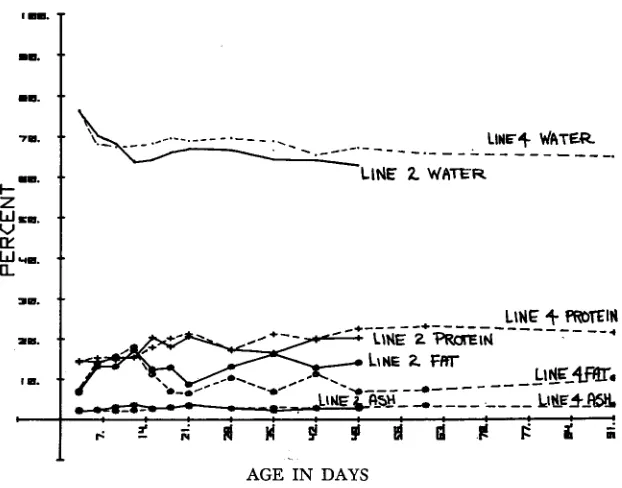
Altering the shape of the growth curve, as has been done in many selection ex- periments with mice, also modifies the pattern of deposition of fat. Figure 11 shows the weights at which a sample of mice from generation 42 of the Colorado appetite line, Line 2, and the Control, Line 4, were sacrificed; these weights are reasonably representative of the growth curves which we previously saw (Figure
1). At sacrifice at 49 days, Line 2 males had reached 33 grams while Line 4 males were at 21 gms. Chemical analysis at successive intervals gave the values shown in Figure 12. Line 4 was also analyzed at 60 to 90 days to see if it would ever reach the weights of Line 2. As expected, Line 2 had heavier weights of water, protein and fat since they were heavier at slaughter at each age beyond 15 days.
I-” Z U Vlm. n: U nu am 1- Y IL m I
.-
II
.-
I
.-
:
I
rz
I I I
I
t
r)! 3 ..r\
I
I
I II
SELECTION I N MICE
535
A%
! Y ! ! i # I A $ C i G i
AGE IN DAYS
FIGURE IO. Actual percentage composition O S the fat-free body.
N. r
n .-
m
U. U
..
..
--
__ _ _
-
-
- -
-
- 4aa
.'
---'
,---'LIPJE 4
9
* *ILI. - * LINE 4 eP
I W . . '
I I .
I3
-.
c
-
6
r
i
d
M
!
$
i
$
d
l
!
f
f
i
AGE IN DAYS536
T. M. SU T H E R L A N D , PATRICIA E. B I O N D I N I A N D G . M. WARDIt.'
11.
--
1u--1 1 .
--
1 7 . "
. _ _ _ _ _ _ - - - ,
I-... LINE 4 WPT(FR
IS.
19:-
* -
I a.
..
a
1. 7.
.-
.-
LINE 4 " Z i t 4
-.
a----
- - _ _ _ _ _ _
_ _ - +
_ _ _ -
- - - 4LINE 4 FAT
-
AGE IN DAYS
FIGURE 12.-Average weight ol components of mice analyzed for body compositioa.
7m.
m.
c
t
sm.
rY
w
LIE.U
I 6.
c-
I
SELECTION I N M I C E 537 When all four components are expressed as percentages of body weight (Figure 13), Line 2 shows a higher percentage of fat, and a slightly lower percentage of all other components. Because all four must add up to
loo%,
when one com- ponent increases in percentage, the others must give, and much has been unneces- sarily written and published on the striking negative correlation between percent- age of fat and percentage of water! After chemical maturity, the proportions of water, protein, and ash in the fat free body are rather constant, and fat "displaces" not only water, but protein and ash in their relative proportions at the same time, as is shown rather nicely in Figure 13.Closer examination of the absolute weights of fat for each sex in each line (Figure 14) reveals the rather striking differences in fat deposition between the ages 28,35,42, and 49 days. Line 2 virtually explodes in comparison to the gentle increase in the control Line 4. An interesting and very fundamental relationship is shown by plotting weight of fat against weight of fat free body (Figure 15). At weights below 12 g m s , there are essentially no differences between Line 2 and Line 4 in the relationship. At higher weights of fat free body, there is a suggestion of more fat in Line 2, which is heavier at comparable ages, than in Line 4 for the same weight of fat free body, though the separation is by no means clear. The linear regressions which fit these points are respectively y = -.08 I+ .16X and
y = .25
+
.09Xwith
r2 values of .87 and .61. Mean weight od fat was 1.7 f 1.45and 1.25 f 31, while mean weight of fat free body were essentially equal at 10.9
and 11.3.
In our laboratory, analysis of the energetic efficiencies in the two lines at 7-day intervals between weaning and 49 days gave an average value for Line 2 males of
I
LINE
ZP
/ LINE 2
d
538 T. M. SUTHERLAND, PATRICIA E. BIONDINI A N D G. M. WARD
1
F R T FREE W E I G H TFIGURE 15.-Weight of fat plotted against the weight of the fat-free body far all mice analyzed. Weights are in grams.
.176. The Line 9 values averaged .149. There is, thus, despite the large amount of extra fat deposited by Line 2, only a .027 difference in energetic efficiency be- tween the two lines. These values also support the recent findings concerning the higher efficiency of fat deposition relative to protein (REID 1971 and GARRET 1970).
The results of
FOWLER
(1958) agree partially with these data. Her Figure 11 shows the large line clearly fatter at all ages from weaning to 90 days. On a weight constant basis, hcwever, the reverse appears to be true; although FOWLERdid not interpret the data in this way, her Figure 9 shows the small line to be clearly fatter at carcass weights between 10 and 18 gms-at a degree of fatness indeed not reached by the large line until a carcass weight of 22 to 25 gms.
SELECTION I N MICE 539
When MCCLEAN and
FRAHM
(1973) attempted to increase hindleg muscle sys- tem weight, they were successful. But the ratio of hind to front muscle weights remained constant. Likewise, body composition was completely unchanged from the control after seven generations of selection. They had simply produced larger mice; presumably because selection was for muscle weight, the percentage of fat did not increase.In pigs, genetic progress has apparently been made in increasing the percent- age of the ham and the loin; more critical analysis seems to indicate that what has been accomplished has been a reduction in the amount of fat i n the body; since pigs have more fat in the front end than in the rear, more weight reduction occurs in the €ront, leaving a higher proportion of ham and loin, though muscle ratios are apparently unchanged.
REID
and his co-workers (1968 and 1971) are convinced that weight of the body essentially tells the whole story on composition of the body. Their experi- ments show that the body components are unaffected by age, length of the feed- ing period or level of intake, provided continuous growth occurs. Their conclu- sions seems valid for animals genetically destined to attain the same mature body weight. But selection which radically alters rate of growth seems mandatorily to alter mature body weight; we have seen no growth curves, including our own, which demonstrate that growth rate can be greatly increased and still lead to the same mature body weight. For example, increased growth rate at early ages in broiler chickens has at the same time led to an average increase of almost 50% in the mature hen weights(JAPP
1969). The correlated changes wrought in body composition at a given age show important species differences which may call in question the validity of results with rodents for extrapolation tc! farm animals. The increased growth rate in mice leads to severe increases in fatness at a given age; on a weight constant basis the results are less clear cut, although the fast gainers seem to be at least as fat in most experiments. On the other hand, ample evidence supports the conclusion that the large rapidly growing breeds of cattle, such as Holstein and Charolais are much leaner, not only at a given weight but also at a given age, than are the breeds such as Hereford and Angus ( CRAMER andHECKER
1973). Some fundamental differences in the genetic regulation of growthand body composition must, therefore, be operative.
540 T. M. SUTHERLAND, PATRICIA E. B I O N D I N I A N D G. M. WARD
L I T E R A T U R E CITED
BLAXTER, K. L., 1962 The Energy Metabolism of Ruminants. London, Hutchinson.
BLAXTER, K. L. and F. W. WAINMAN, 1964. Utilization of the energy of different rations by sheep and cattle for maintenance and for fattening. J. Agric. Sci. 63: 113-128.
BRODY, S., 1945
CRAMER, D. A., A. L. HECKER and D. P. CORNFORTH, 1973 Intramuscular fat deposition in cattle. Proc. West. Sec., A.S.A.S. 24.
FALCONER, D. S., 1959 Selection of mice for growth on high and low planes of nutrition. Genet. Res. 1: 91-113.
FOWLER, RUTH E., 1958 The growth and carcass composition of strains of mice selected f o r
large and small body size. J. Agric. Sci. 51: 137-148. 1962 The efficiency of food utilization, digestibility of foodstuffs and energy expenditure of mice selected for large o r
small body size. Genet. Res. 3: 51-68.
GARREIT, W. N., 1970 Energetic efficiency of beef and dairy steers. J. Anim. Sci. 32: 46-466. JAAP, R. G., 1969 Large broilers from smaller hens. World's Poultry Sci. J. 2 5 : 140-143. KOCH, R. M., L. A. SWIGER, D. CHAMBERS and K. E. GREGORY, 1963 Efficiency of feed use in
LANG, B. J. and J. E. LEGATES, 1969 Rate, composition and efficiency of growth in mice selected
MCCLELLAN, C. REID, JR. and R. R. FRAHM, 1973 Direct and correlated responses to two way
MOULTON, C. R., 1923 Age and chemical development in mammals. J. Biol. Chem. 5 7 : 79-97. RAHNEFELD, G. W., R. E. COMSTOCK, W. J. BOYLAN and M. SINGH, 1965 Genetic correlations
between growth rate and feed per unit gain in mice. J. Anim. Sci. 24: 1061-1066.
REID, 5. T., A. BENSADOUN, L. S. B u J. ~H. BURTON, P. A. GLEFSON, I. K. HAN, Y. D. Joo, D. E. JOHNSON, W. R. MCMANUS, 0. L. PALADINES, J. W. STROUD, H. F. TYRELL, B. D. H. VAN NIEKEFLK and G. W. WEUINGMN, 1968 Some peculiarities in the body composition of animals. pp. 19-44. In: Body Composition in Animals and Man. Nat'l. Acad. Sci. Publ. REID, J. T. and J. ROB% 1971 Relationship of body compositian to energy intake and energetic
efficiency. J. Dairy Sci. 5p: 553-564..
REID, J. T., 1971 The Effects of Nutrition on B d y Compmition of Animals. Georgia Nutrition Conference Publ., Atlanta, Georgia.
SUTHERLAND, T. M. and L. OLLIVIER, 1970 Etude de quelques causes de la variation de la consommation alimentaire du porc engraissk du 25 B 100 kg. en rbgime semi ad libitum.
Journkes de la Recherche Porcine en France. pp. 143-151. Edited by the Institut Technique du Porc, I.N.R.A. 8, Rue d'Astorg. Paris, 86me.
Selection for growth rate, appetite and efficiency of feed utilization in mice. J. Anim. Science 31:
1M9-1057.
Variation in growth and efficiency in twin calves. J. Agric.
Comparisons of ad libitum and restricted feeding of mice selected and unselected for postweaning daily gain. I. Growth, feed consumption and feed efficiency. Genetics 64: 41-57.
TIMON, V. M., E. J. EISEN and M. M. LEATHERWOOD, 1970 Comparisons of ad libitum feeding of mice selected and unselected for postweaning gain. 11. Carcass composition and energetic efficiency. Genetics 65: 1%-155.
Bioenergetics and Growth. New York, Reinhold.
-
,
beef cattle. J. Anin. Sci. 22: 486-494.
for large and small body weight. Theor. App. Genet. 39: 306-314.
selection for hindleg muscle system weight in mice. J. Anim. Sci. 36: 44.2-451.
SUTHERLAND, T. M., P. E. BIONDINI, L. H. HAVERLAND and D. PETTIJS, 1970
TAYLOR, S. C. and G. B. YOUNG, 1964