Page 34
CLASSROOM EXPERIMENTS AS SOLUTION FOR UNDERSTANDING SOLUTIONS Theodoros Philippidis1, Eleutheria Balbouzi2, Anastasia Koumoutsi3, Pericles Akrivos2
1Gymnasio of Kassandra, GR-630 77 Chalkidiki, Greece
2Aristotle University of Thessaloniki, Department of Chemistry, P.O.B. 135, GR-541 24,
Thessaloniki, Greece
3Geniko Lyceio of Agria, GR-373 00 Magnesia, Greece
Abstract
Validation is provided to the assumption that Chemistry, being an experimental subject taught to secondary education students, is better understood via the performance of relevant experiments within the classroom. The case of solution Chemistry, especially solubility, description of solutions in terms of their concentration as well as estimation of concentrations following dilution or mixing is studied by means of a questionnaire addressed to first year senior high school students who have been exposed to varying degree of experimentation during their junior high school studies. The questionnaire is tested as of its validity for drawing conclusions and of its potential use as a test for future evaluation of senior high school students referring to their understanding of nomenclature and properties of solutions. A total of 208 students in three different schools in Northern Greece have been subjected to the study.
Keywords: secondary education, solutions, solution concentration, understanding evaluation
1. INTRODUCTION
Misconceptions, mainly based on erroneous understanding of novel topics currently taught or on previously acquired alternative explanations, present one of the major obstacles that a teacher has to overcome, especially during the course of secondary education where the latter are firmly established and recurring albeit the effort placed on their contradiction and confutation. Misconceptions in Science are common since from an early age kids attempt to rationalize the surrounding world and the phenomena occurring in it intuitively, that is in terms of simple ideas, very often supported by their family members who lack the ability or knowledge to describe in the scientifically correct way the observations made. This type of alternative ideas are extremely hard to deal with, especially at a later age since it has been argued and to large extent proved that in many cases it does not matter how long or how intensely somebody is taught about a specific topic (Ahtee & Varjola 1998, Bodner 1991). Their influence to the total learning process of the young students has been shown to be significant since usually they are used as a core around which newly acquired knowledge it attempted to be incorporated and amalgamated through a process of conceptual change (Eggen at al 2017). In Chemistry in particular, misconceptions are further initiated or maintained due to the complicated and strict terminology which makes use of words or expressions with a particular meaning for the scientific realm, differing to a lesser or greater degree than their meaning in everyday life. Furthermore, the scientific dictionary is full of derived words referring to a specific topic, which although bearing a discrete meaning for the scientist may appear quite similar even interchangeable to a non-scientist as well as a young student. Teachers who may continue following their own preconceptions (Canpolat et al 2006, Pinarbasi et al 2009) and curricula that are ill-defined or loosely followed are some additional factors that may promote misconceptions among elementary and secondary education students.
Page 35
mathematical ones that prove to be problematic in practically every level of education (Devetak et al 2009, deBerg 2012). As expected, misconceptions are present in this topic of Chemistry and they have been studied in detail by many researchers. In a typical survey (Mulford et al 2002) one out of three students believed that upon evaporation of a sugar solution its concentration remains constant and 4% that it is diminished. In a subsequent question regarding the phenomena occurring during the evaporation process 40% of the students believed that the concentration of the solute in the remaining water was matching the initial one while another 30% concentrated on the solute molecules defining that they did not evaporate like water molecules did.
Following our previous recent studies on the misconceptions related to Chemistry in the Greek high-school as to their origin and factors of their conservation (Katsikis et al 2015, Vandoulaki et al 2016) and in view of the well-established and widely accepted idea that misconceptions in Chemistry may be best confronted by chemical means, i.e. by experimentation, we have proposed the utilization of some simple and cheap experiments which can be carried out safely in the classroom and which are expected to promote understanding of some key aspects of solution content, expressions of solution concentration and the subsequent interchange between them (Koumoutsi et al 2018). In the current study we report on the evaluation of the application of the above proposal through the distribution of questionnaires to secondary education students who have been exposed to a varying degree of experimentation during their studies.
1.1 Solution Chemistry in the Greek secondary educational system
Solution Chemistry appears in the secondary education curriculum along with the first appearance of the subject of Chemistry, during the second year of junior high school. The topics covered are divided in two sections, the first one entitled “Water as solvent-mixtures” and the second “Content of solutions and its expressions”. The first one is expected to be presented over a period of two hours and involves teaching about
Water as solvent of many solid, liquid and gaseous substances Mixtures in general
Homogeneous and heterogeneous mixtures Properties of mixtures, solutions-solute-solvent
The section is accompanied by a proposed experiment where several substances are investigated in relation to their solubility in water while investigation of the dissolution mechanism is sought by the macroscopic observation of the changes following the addition of a potassium permanganate crystal or a drop of ink in a water tank. The students are expected to realize the capability of water to dissolve or not a specific substance, understand its nature as the main solvent both in the laboratory and in the environment, prepare solutions by adding substances to water and identify certain everyday substances as solutions, further identifying the solvent and the solute.
The second section is related to “solution content – content expressions” and is scheduled for 3 hours of teaching. Expressions of solution content include percent per weight, percent per volume and the experiments proposed to be carried out are related to preparation of NaCl solutions of desired percent concentration, as well as aqueous alcohol solution expressed in %v/v. Indications are also given for the tracking by the students of the content expression in various everyday used items like beverages, cleaning liquids, commercially available juices and vinegar. It is therefore expected that the students are able to determine the content of a solution from quantitative information and partition it into solvent and solute content. Furthermore they are expected to be able to prepare a solution of a specific compound when its desired content is given as well as interpret information provided in the labels of commercial products.
Page 36
initial solution or the mixing of two solutions bearing the same solute. An experiment is also expected to be carried out in order to aid the acquiring and practicing of the required skills.
2. DESCRIPTION OF THE STUDY
2.1 Tools applied to the study
The aim of the current study is to define the extent to which conducting classroom experiments related to the content of solutions and its expression in various formats contributes to the better understanding of solutions. The study was carried out through questionnaires that were distributed early in the school year to grade A senior high school students in three schools in Northern Greece. Two of the schools are situated in rural areas and the third one in the suburbs of a big city, however their basic difference lies in the fact that in one of them due to lack of facilities there are no experiments carried out except some demonstration ones. The only personal information required was the sex of the student since in almost all related studies this is included in the independent variables of the query although it has not proved to give statistically significant results in all of them. Of the questionnaires retrieved a 2.3% had to be disregarded on the grounds of totally irrelevant (not wrong) answers given.
Following a typical assessment, the resulting grades were normalized to a 0-10 scale and the normal descriptive statistics parameters were derived. However, in an effort to better rationalize the results a series of other indices were also taken into account, namely
Index of easiness,
c N P
N
Where Nc is the number of the correct answers given for each specific question and N the total number of answers given. This simple index takes into consideration the true fraction of individuals among the population studied giving the correct answer to a specific question. It is more appropriate to term this index as “easiness” rather than “difficulty” which is usually in practice (Eggen et al 2017). Several criteria have been applied to the range of values that should be acceptable for this index, for which a mean value of 0.5 would represent a question not too easy and not to difficult for the population studied to attempt answering. Limit values vary among studies with 0.3 and 0.9 being more accepted. Of course, this index is related to a specific question, however for a questionnaire, there should be a collective measure of relative easiness and in this respect the average of the easiness indexes for the questions included may be used in the form of
Average easiness index, 1 1 M
i i
P P
M
Where M is the number of the individual questions provided. The same as above general criteria are applied and there is expected to be a difference in the obtained values for the same set of questions when addressed to different populations, however, this may serve as a criterion of assessment of these populations, provided that the resulting index values do not fall outside the accepted limits.
A further step towards validating the results of a questionnaire is the application of reliability indices where correlation is attempted between the total grade of students and their score in individual questions. Such a reliability index may be formulated as
1
c oX
X
P
r
P
Page 37
likely to answer correctly the specific question than those with low total score. In a questionnaire incorporating several questions, however, there might be a small number of questions with reliability index lower than the generally accepted limit if the average is well above it (Kiviniemi et al 2018).
Further, a discrimination index is utilized, formulated as
H L
K
D N N
N
where NH and NL are the number of correct answers given to the specific item by two equal in number groups of the population studied, one that achieved the highest (NH) and one the lowest (NL) total scores respectively. A typical distinction between the two groups should be the use of the median of the scores achieved, however it has been indicated (Persson 2015, Eggen et al 2017) that limiting the sub-populations to 25% each provides an even better discrimination between them. Therefore, the total number of the cases taken into account is not N but N/K, in the above case N/4. This index ranges between -1 and 1, positive values being desirable while values above 0.3 providing presumably greater discrimination. Furthermore, the average of the individual D parameters can be used as a measure for the discriminating ability of a specific test just like in the case of easiness index.
2.2 The questionnaire used
In brief, the questionnaire distributed is as follows:
1. Students are asked about the amount of water required to dissolve 2 g of compound A aiming at the preparation of a 2% w/w solution. Answers provided are 2g in 100, (100-2), (100+2) or (100/2) g of solvent.
2. Given the density of the above solution as 1.25 g/mL its concentration in %w/v is required. Answers offered are (2+1.25), (2-1.25), (2x1.25) or (2/1.25) g/mL.
3. 50 g of the above solution are required for an experiment but there is no balance so the students are asked a) what to do and b) in which way.
4. When 100 g of the initial solution are diluted to 1 L with water the content of the new solution is requested as % w/v.
5. Following the previous question, the quantity of compound A in the second solution is required. Answers provided are 0.02, 0.2, 2 or 20 g.
6. The density of the new solution has to be guessed as being smaller, equal, larger than or indifferent to the one of the first solution.
7. Compound A in the initial solution decomposes upon dilution to two fragments of equal molar mass. The %w/w content of the solution is asked for each of the two compounds.
8. The additional amount of A that has to be introduced to 100 g of the initial solution in order to prepare a 5% w/w solution of the same compound A.
9. Students are asked to give detailed calculations for the answer to 8 above.
3. RESULTS AND DISCUSSION
Page 38
and 7.07 respectively. The result is further supported by the values of the corresponding standard deviations, which are 1.56, 1.85 and 1.51 respectively.
Figure 1. Percent of score distribution for the total population studied partitioned among the three schools involved. School B is in the suburbs of a large city while A, and C are in rural areas.
The most obvious discrimination between the schools resides with the experimentation carried out during the school year with respect to the chapters related to the study of solutions. In rural school A no experiments have been carried out due to the lack of appropriate facilities, while in urban school B, some time has been devoted to carrying out a number of the experiments proposed by the authorities. In school C finally, the full set of experiments and discussions proposed earlier (Koumoutsi et al 2018) have been performed.
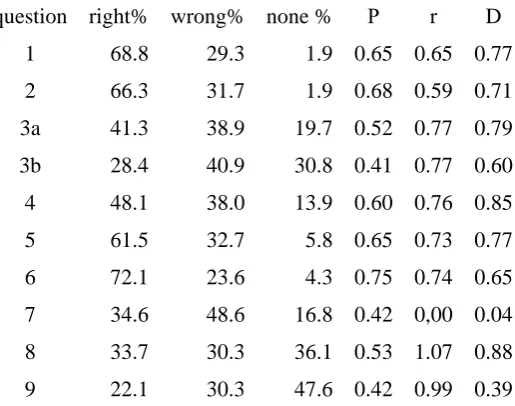
Table 1. Sorting of answers to the questions in the full population studied. Indices P, r and D are calculated as described in the text. Percent of right answers, wrong answers and no answers is given
for every question.
question right% wrong% none % Ρ r D
1 68.8 29.3 1.9 0.65 0.65 0.77
2 66.3 31.7 1.9 0.68 0.59 0.71
3a 41.3 38.9 19.7 0.52 0.77 0.79
3b 28.4 40.9 30.8 0.41 0.77 0.60
4 48.1 38.0 13.9 0.60 0.76 0.85
5 61.5 32.7 5.8 0.65 0.73 0.77
6 72.1 23.6 4.3 0.75 0.74 0.65
7 34.6 48.6 16.8 0.42 0,00 0.04
8 33.7 30.3 36.1 0.53 1.07 0.88
Page 39
Some of the observations made based on the data reported in Table 1 merit discussion at this point. First of all, there is not a single question where even a small number of students avoid answering. Second, questions where some elaboration is required (i.e. not closed-type questions) attract small interest from the students and most of them choose to pass on them. Questions 3b, 8 and 9 fall into this category and the data in Table 1 confirm the above argument. In the first part of question 3 the problem is addressed that a certain weight of a specific solution is required but there is no balance available. The percentage constitution both per weight and per volume of the solution have been discussed in the preceding questions, and interconnected through the density of the solution. Only a 19.7% of the population abstains from answering this question (3a), however their number rises to 30.8% when in 3b they are asked to describe the way to actually do it. The percentage of right answers follows the inverse order, diminishing from 41.3% for 3a to 28.4% for 3b. Question 8 presents a case of concentrating a given solution by the addition of solute. Although the idea is simple and is mentioned in the textbooks, in the relevant chapters the vast majority of the text refers to dilution of a solution and therefore many students appeared not acquainted with the idea of performing the task even at a theoretical level. In the final question of the test, details are required about the math and the procedure that was discussed in the previous question, whereupon the right answers fall from 33.7% to 22.1% and a consequent neglect of answering elevation from 36.1|% to 47.6%. A typical dilution process is described in question 4 and it succeeds in driving off just 13.9% of the students while a 48.1% give the correct answer, verifying the above argument. Finally, the findings about question 7 merit some discussion since it appears as inappropriate for the current assessment due to the slightly negative value of the reliability index r. The question asks for the determination of the %w/w content of each of two fragments with equal molar mass, produced upon dissolving a certain amount of an initial compound for which the %w/w content is known. Unfortunately, the distribution of the questionnaires was not synchronized in the three schools and in the case of school C (where the best average scores were realized) was carried out late during the school year. At that point the students had been taught about the molar concentration of solutions and mistook the concentration given in percent per weight for molar and suggested in their answers that the concentration of each of the fragments is equal to the concentration of the original solute at an outstanding 85.7%.
The above argument is further supported by the discrimination factor value for the specific question, which under the circumstances, renders it as inappropriate for discriminating students with high total score from those with a low one. In fact 63 of the total 101 wrong answers to the question originate from the school with the highest overall achievement and in this respect complicates the
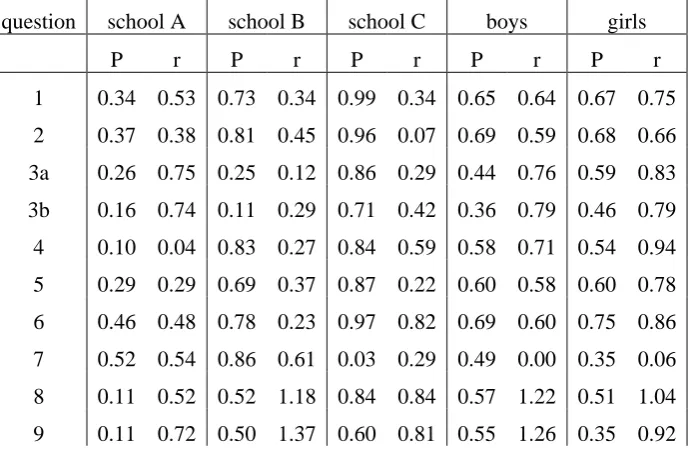
Table 2. Evaluation indices for the easiness (P) and reliability (r ) of each specific question categorized by school and sex of students respectively.
question school A school B school C boys girls
P r P r P r P r P r
1 0.34 0.53 0.73 0.34 0.99 0.34 0.65 0.64 0.67 0.75
2 0.37 0.38 0.81 0.45 0.96 0.07 0.69 0.59 0.68 0.66
3a 0.26 0.75 0.25 0.12 0.86 0.29 0.44 0.76 0.59 0.83
3b 0.16 0.74 0.11 0.29 0.71 0.42 0.36 0.79 0.46 0.79
4 0.10 0.04 0.83 0.27 0.84 0.59 0.58 0.71 0.54 0.94
5 0.29 0.29 0.69 0.37 0.87 0.22 0.60 0.58 0.60 0.78
6 0.46 0.48 0.78 0.23 0.97 0.82 0.69 0.60 0.75 0.86
7 0.52 0.54 0.86 0.61 0.03 0.29 0.49 0.00 0.35 0.06
8 0.11 0.52 0.52 1.18 0.84 0.84 0.57 1.22 0.51 1.04
Page 40
The data of Table 1 provide information about the “easiness” of each specific question in the form of the P index tabulated. The average easiness of the questionnaire can be directly calculated and its value (0.56) lies approximately in the middle of the accepted range of values, indicating that the assessment attempted is not out of bounds regarding the level of skills possessed by the students. The reliability index for all items lies well above the accepted limit confirming that the questionnaire may be regarded as a valuable tool for the assessment planned. There is a single question with a negative r value, extremely close to zero and its emergence which has been discussed.
The truth about laboratory experiments and the extent to which they contribute to the better understanding of chemical principles is something yet to be discovered. However, the results of the current study are indicative of the positive influence of experiments at least as far as solutions and their description in terms of constitution is concerned. School A where no experiments have been carried out yields an average P value of 0.27 and average r value of 0.50. School B with typical breadth and depth experimentation being carried out gives average P value of 0.61 and average r value of 0.52. Finally for school C where the previously proposed experiments have been carried out (Koumoutsi et al 2018) the related average P and r values are 0.77 and 0.47. It is apparent that the assessment tool devised appears to be more difficult for students who had less laboratory experience, therefore supporting the necessity of conducting laboratory experiments in the school classroom even at the demonstration mode.
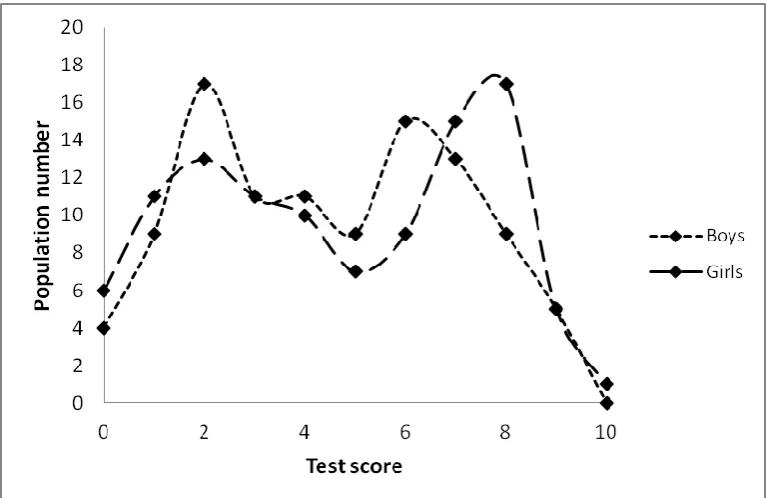
Figure 2. Percent score distribution for the total population studied partitioned among boys and girls.
Boys produce average p value 0.56 and average r value 0.72 while girls yield values of 0.55 and 0.76 respectively. Like in several of our recent studies involving groups of secondary school students it appears that sex does not play an important role in discriminating students likely to achieve better scores in chemistry oriented questionnaires. The above information is summarized from the data presented in Table 2.
4. CONCLUSIONS
Page 41
content in terms of percent solute content. The questionnaire is investigated as of its adequacy and relevance with the aid of literature provided indices (Eggen et al 2017) and proves to be moderately easy and reliable for the purpose of discriminating between students who have understood the underlying facts and laws governing the action of dissolving a compound and manipulating its solution. There appears to be no statistically significant difference depending on the sex of the students while a substantial difference is observed between students who have carried out classroom experiments on the preparation and description of solution content. There is no relation to the location of the school since two schools located in small rural areas occupy the two limiting cases of complete lack and full scale targeted experimentation on the topic, in accordance to prior proposals (Koumoutsi et al 2018).
REFERENCES
Ahtee, M, Varjola, I 1998, “Students' Understanding of Chemical Reactions” International Journal of Science Education, vol. 20, no. 3, pp. 305-316.
Bodner, GM 1991, “I have found you an argument: the conceptual knowledge of beginning chemistry graduate students”, Journal of Chemical Education, vol.68, pp. 385-388.
Canpolat, N, Pinarbasi, T, Bayrakceken, S, Geban, O 2006, “The conceptual change approach to teaching chemical equilibrium”, Research in Science & Technological Education, vol. 24, no 2, pp. 217-235.
de Berg, KC 2012, “A study of first-year chemistry students' understanding of solution concentration at the tertiary level”, Chemistry Education Research and Practice, vol. 13, pp. 8-16.
Devetak, I, Vogrinc, J, Glazar SA., 2009, “Assessing 16-Year-Old Students’ Understanding of Aqueous Solution at Submicroscopic Level”, Research in Science Education, vol. 39, pp. 157–179.
Eggen, P-O, Persson, J, Jacobsen, EE, Hafskjold, B 2017, “Development of an inventory for alternative conception among students in cChemistry”, LUMAT, vol. 5, no 1, pp. 1-11.
Katsikis, H, Savvidou, E, Schizodimou, A, Akrivos, PD, Keloglou, G 2015, “Student misconceptions in the 21st century. Chemistry related conceptions of Greek senior high school students”, Educational Alternatives, vol. 13, pp. 384-394.
Kiviniemi, T, Eggen, P-O, Persson, J, Hafskjold, B, Jacobsen, E 2018, “Development of a Chemistry Concept Inventory for General Chemistry Students at Norwegian and Finnish Universities”, in A. Palsdottir (ed.), Science competencies for the future: Proceedings of the 12th Nordic Research Symposium on Science Educatin (NFSUN 2017) pp. 73-79.
Koumoutsi, A, Soulioti, A, Akrivos, PD 2018, “Utilization of the experiment within the classroom. Seeking to develop understanding over love towards Chemistry”, Educational Alternatives, vol. 16, pp. 215-221.
Persson, RJ 2015, “Evaluating the Force Concept Inventory for different student groups at the Norwegian University of Science and Technology” retrieved from https://www.researchgate.net/publication/275364821
Pinarbasi, T, Sozbilir, M, Canpolat, N 2009, “Prospective chemistry teachers’ misconceptions about colligative properties: boiling point elevation and freezing point depression”, Chemical Education Research & Practice, vol. 10, pp. 273-280.