Article
The impact of collaborative innovation on ecological efficiency
—
Empirical research based on China
’
s regions
Jianqing Zhang
1,2, Song Wang
1,3,#,
Fei Fan
1,3,*,
Peilei Yang
4,*1 Institute for the Development of Central China, Wuhan University, Wuhan 430072, China; 2 Economics and Management School, , Wuhan University, Wuhan 430072, China;
3 School of Earth and Environmental Sciences, the University of Queensland, Brisbane 4072,
Austrilia;
4 School of Urban and Regional Sciences, Shanghai University of Finance and Economics,
Shanghai 200433, China.
Abstract: Taking capital, manpower, and natural resources as inputs, regional GDP as expected output, and industrial pollution as undesired output, this study measures the ecological efficiency of various regions in China through the Global-Malmquist model. The results show a trend of an initial sharp decline in ecological efficiency followed by a gradual increase in the time dimension, but there is no significant correlation in the spatial dimension. Using the gravity model to quantify the attractiveness of the regions’ capital and human resources for collaborative
innovation, it estimates the impact of collaborative innovation on eco-efficiency through the system-Generalized Method of Moments (GMM) model. The results show that technological innovation capital in other regions has a negative “U” relationship with local ecological efficiency,
while scientific and technological innovation human resources have a positive “U” relationship. In
addition, government financial support in science and technology and the ecological efficiency of the previous period serve as promoting factors of the current local ecological efficiency, while the introduction of foreign technological innovation is likely to inhibit improvements in ecological efficiency. Based on these findings, this study puts forward corresponding policy recommendations for local governments to advance their development agendas alongside their environmental priorities in line with their specific circumstances.
Keywords: Ecological efficiency; collaborative innovation; Global-Malmquist; gravity model; system-GMM
1.
Introduction
In the context of weak global economic recovery, currently, ecological environment and technological innovation are the two most important themes in global development [1,2]. On the one hand, the computer and information technology revolution has greatly promoted the transformation of human society, politics, and culture and has caused the global economy to explode, making people think that technological innovation is an important way to mitigate the impact of the current economic crisis [3]. Countries around the world strive to establish national
innovation systems that meet their own development demands [4,5]. On the other hand, prior to the subprime mortgage crisis, there had been a notable improvement in people’s living standards,
and thus more and more attention was being paid to the impact of the ecological environment on human sustainable development. This concern for the environment has continued until the present. The 2018 Nobel Prize in Economics was awarded to Paul M. Romer and William D. Nordhaus in recognition of their contributions to innovation, the ecological environment, and economic growth, which is a demonstration of the public's focus on technological innovation and the ecological environment.
In the field of technological innovation, the evolution of innovation has gone from closed innovation to open innovation, and now it is more collaborative in nature [6]. Collaboration is a new trend in the world's technological innovation activities and an effective way to integrate innovation resources and accelerate technological innovation. Many scholars have conducted research on various aspects and applications of collaborative innovation. Scherngell and Hu analyzed the spatial connection of China's collaborative innovation through a gravity model and believed that geographical distance hindered China's cross-regional research cooperation [7]. Wang discusses the problem of knowledge integration in collaborative innovation and proposes a new comprehensive classification method [8]. Connell et al. believe that industrial agglomeration can effectively promote knowledge sharing and collaborative innovation [9]. Xie et al. analyzed the relationship between China's high-tech enterprise collaborative innovation network and knowledge transfer performance and considered that the scale of the collaborative innovation network and other factors can determine the level of knowledge transfer performance [10]. Liu et al. found that the collaborative innovation strategy and the company's innovation performance take on an inverted U-shape based on a survey of Chinese high-tech companies [11]. Feranita et al. believe that collaborative innovation can solve the innovation dilemma of family businesses and improve innovation performance in the face of resource constraints [12]. In addition, according to a survey of Iranian high school technology manufacturing, Najafi-Tavani et al. found that collaborative innovation has an impact on the ability to innovate products or processes only when there is absorptive capacity [13].
In the field of ecological environmental studies, the value of ecological services [14], sustainable development [15], and ecological efficiency [16] are both hot spots in the academic world and an important basis of development for the country to quantify and upgrade the level of the ecological environment. As the materials, resources, and energy needed for economic development are limited [17], efficiency is of great significance in ecological economics [18]. Since its introduction in 1992 [19], eco-efficiency has been defined as the pursuit of value creation while reducing environmental impact [20], which is also the goal pursued by countries around the world in economic growth [21]. Ecological efficiency covers economic growth and ecological environmental protection [22], which is considered as the gold standard for making decisions in the environmental context [23]. The improvement of ecological efficiency is regarded as an important path to achieve sustainable development [24] and is also the environmental theme and target of today's society [25]. In recent years, research on eco-efficiency has emerged in abundance, involving production processes [26], intensive management [27], enterprises [28,29], industries [30-32], regions [33,34], and countries [35,36]. It has also increasingly focused on the role of technological innovation in improving eco-efficiency.
means for China and India to improve the eco-efficiency of the cement industry. Sarkis and Cordeiro measured the combined ecological and technical efficiency of the 437 largest fossil fuel power plants in the United States and evaluated whether innovation contributes to joint technology and environmental performance improvements, considering that innovation has a direct impact on the organization's technological and ecological environment [38]. Gómez-Limón
et al. considered that low technical efficiency is the main cause of low ecological efficiency when analyzing the ecological efficiency of olive farms in Andalusia, Spain [39]. Arabi et al. found that the eco-efficiency that emerged during the restructuring of the Iranian power industry was mainly due to technological advancement [40]. Sun et al. believe that green technology innovation not only improves the efficiency of energy and natural resource utilization, but also enhances the eco-economic efficiency of strategic emerging industries [41]. Hu et al. believe that the adoption of advanced technology can significantly improve the ecological efficiency of China's sewage treatment plants [42]. After analyzing the agricultural eco-efficiency in Shandong, China, Deng and Gibson believe that promoting agricultural technology development according to the specific conditions of different regions is an important method to improve agricultural eco-efficiency [43].
and believe that technological innovation is crucial for improving ecological efficiency [57]. The above research shows that collaborative innovation is an important innovation model in the face of resource constraints and also confirms the role of innovation in promoting eco-efficiency, but, in general, the studies do not link collaborative innovation with eco-efficiency. In an analysis of regional industrial eco-efficiency in China, Yu et al. proposed that strengthening regional exchanges and cooperation can promote the improvement of ecological efficiency [58]. Will inter-regional collaborative innovation then promote local ecological efficiency? How will it happen? In this study, the regional ecological efficiency of China is measured by the Global Malmquist - Luenberger model, and the level of collaborative innovation between regions is quantified by the gravity model. Finally, the mechanism of collaborative innovation on ecological efficiency is analyzed.
2.
Measurement of Ecological Efficiency
2.1. Global Malmquist - Luenberger model
Data Envelopment Analysis, DEA, considers the alternative possibilities between different natural resources and emissions and does not require subjective judgments on weights [59]. Therefore, DEA can measure the ecological efficiency of different regions to help the government find the optimal solution to protect the environment and improve ecological efficiency [60]. Since the scientific and technological spillovers from other regions absorbed by geographical, economic, and technological distances in each province are dynamic, the ecological efficiency calculated in this study should also be able to dynamically meet the mutual correspondence of various variables in the regression equation. The Malmquist model analyzes ecological efficiency from the input-output perspective, indicating that a larger total output can be obtained through the same factor input level in the previous period and reflecting the dynamic incremental level of total factor production [61]. Based on the traditional Malmquist model, Chung et al. constructed the Malmquist-Luenberger model according to the shortage function [62] of Luenberger [63], which can solve the problem of unproductive output efficiency evaluation. However, there may be no solution to linear programming, and problems such as transitibility and additivity may not be encountered in the Malmquist-Luenberger model [64]. In addition, Oh constructed the Global Malmquist-Luenberger model to overcome these shortcomings [65]. The Global Malmquist-Luenberger model first constructs a global frontier of the production probability sets through the envelope method:
)
(
)
(
)
(
)
(
1 1 2 2 T TG
x
P
x
P
x
P
x
P
=
∪
∪
∪
(1)where, Pt is a set of production possibilities in the t period. It is assumed that the decision-making
unit (DMU) with a sample size of n uses I kinds of production inputs, of which the data set is
+
∈
=
x
x
x
IR
Ix
(
1,
2,
,
)
, to produce O kinds of expected outputs, of which the data set is+
∈
=
y
y
y
OR
Oy
(
1,
2,
,
)
, and simultaneously produces U kinds of undesired outputs, of whichthe data set is
=
∈
+ U UR
b
b
b
b
(
1,
2,
,
)
. Thus, the global directional distance function can be)}
(
)
,
(
|
max{
)
,
;
,
,
(
x
y
b
g
g
y
g
b
g
P
x
D
b Gt y t b y t t t
G
=
γ
+
γ
−
γ
∈
(2)where, γ is the value of the directional distance function of the t period with the goal of maximizing expected output and minimizing undesired output, while
(
g
y,
g
b)
is the directionvector. Therefore, the directional distance functions can be abbreviated as
D
t(
x
t,
y
t,
b
t)
and)
,
,
(
t t tG
b
y
x
D
. On this basis, the Global Malmquist - Luenberger model can be expressed as:)
,
,
(
1
)
,
,
(
1
1 1 1 1 + + + ++
+
=
G Gt t tt ttt t
b
y
x
D
b
y
x
D
GML
]
)
,
,
(
1
)
,
,
(
1
)
,
,
(
1
)
,
,
(
1
[
]
)
,
,
(
1
)
,
,
(
1
[
1 1 11 1 1 1 1 1 1
1 + + +
+ + + + + + + +
+
+
×
+
+
×
+
+
=
t t t t tt t t Gt tt tt tt tG tt tt ttb
y
x
D
b
y
x
D
b
y
x
D
b
y
x
D
b
y
x
D
b
y
x
D
=
+1×
t+1t t
t
GTC
GEC
(3)From the above equation, it can be found that the relative change rate index t+1
t
GML
ofthe total factor productivity from t to t+1 can be decomposed into the technical efficiency change
index t+1
t
GEC
and the technological progress indexGTC
tt+1. According to Oh's method, thecurrent directional distance and global distance function values of the t period can be obtained by solving the following two types of linear programming problems. Subsequently, the value of
1 + t t
GML
is obtained:
D
t(
x
t,
y
t,
b
t)
=
max
γ
z
y
y
o
O
N n t o t no t
n
(
1
)
,
1
,
2
,
,
1
=
+
≥
∑
=γ
s.t.
z
b
b
utu
U
Nn t nu t
n
(
1
)
,
1
,
2
,
,
1
=
−
=
∑
=γ
∑
==
≤
N n t i t ni tn
x
x
i
I
z
1,
,
2
,
1
,
z
tn≥
0
,
n
=
1
,
2
,
,
N
(4)γ
max
)
,
,
(
t t t=
G
b
y
x
D
∑∑
= ==
+
≥
N n T t t o t no tn
y
y
o
O
s.t.
∑∑
= =
=
−
=
N
n T
t
t u t
nu t
n
b
b
u
U
z
1 1
,
,
2
,
1
,
)
1
(
γ
∑∑
= =
=
≤
N
n T
t
t i t ni t
n
x
x
i
I
z
1 1
,
,
2
,
1
,
N
n
z
nt≥
0
,
=
1
,
2
,
,
(5)2.2. Indicator selection
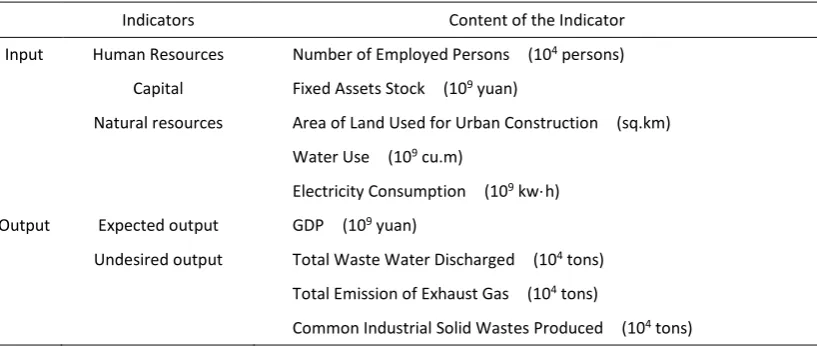
In accordance with the related research [66-68], this study selects indicators from three aspects of human resources, capital, and natural resources to reflect the input of ecological efficiency and divides output into expected output and undesired output. Expected output is measured by regional GDP, while undesired output is characterized by industrial solid waste, waste gas, and wastewater, as shown in Table 1. Also, the fixed assets stock is calculated by the perpetual inventory method, in accordance with Wang et al. [69]. The data of each indicator comes from the China Statistical Yearbook (2004-2018), which covers 30 provinces, municipalities and autonomous regions in mainland China (excluding Tibet, Hong Kong, Macau, and Taiwan due to data loss and statistical caliber), and the time span is from 2003 to 2017.
Table 1. Input and Output Indicators of Ecological Efficiency
Indicators Content of the Indicator Input Human Resources Number of Employed Persons (104 persons)
Capital Fixed Assets Stock (109 yuan)
Natural resources Area of Land Used for Urban Construction (sq.km) Water Use (109 cu.m)
Electricity Consumption (109 kw·h)
Output Expected output GDP (109 yuan)
Undesired output Total Waste Water Discharged (104 tons)
Total Emission of Exhaust Gas (104 tons)
Common Industrial Solid Wastes Produced (104 tons)
2.3. Analysis of changes in ecological efficiency
2004 2009
2013 2017
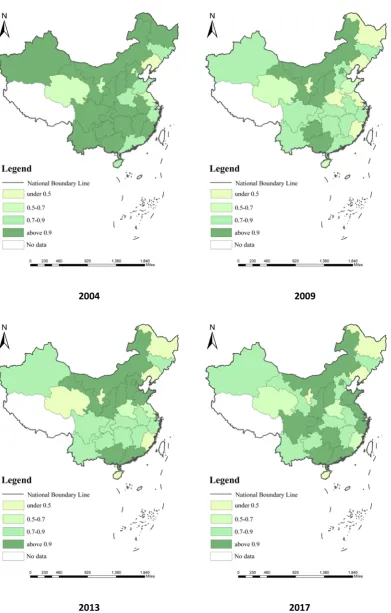
Figure 1. Regional Ecological Efficiency in China
eco-efficiency values below 0.7. Only one province, Liaoning, had an ecological efficiency value below 0.5. In 2009, the number of regions with eco-efficiency values above 0.9 sharply reduced to 7, while nearly half of the regions were in the range of [0.8, 0.9], and the eco-efficiency of 6 regions were below 0.5. In 2013, regional eco-efficiency improved overall, with values greater than 0.9 in 11 regions and reductions in 4 regions with eco-efficiency values between 0.5 and 0.9. In 2017, regional eco-efficiency was further improved, and the number of regions with eco-efficiency values above 0.9 increased to 13. The number of regions with eco-efficiency values below 0.5 decreased to 4. From a specific regional point of view, the eco-efficiency levels of four of the provinces, such as Guangxi, have been stable above 0.9, while the eco-efficiency of Liaoning has consistently been below 0.5 throughout the measurement period.
The ecological efficiency levels of Beijing, Jiangsu, and Guangdong have increased rapidly, while the ecological efficiency of Heilongjiang has shown a cliff-like decline. From the perspective of agglomeration, the ecological efficiency of the eastern region is higher, and the ecological efficiency of the western region shows a downward trend, while the ecological efficiency of the central region is stable. However, the overall spatial correlation is not strong. The reason for the above changes in China's ecological efficiency may be that the period prior to 2009 was the fastest period of China’s economic development. During that time, economic development
efforts were more focused on the increase in expected output, ignoring the resources consumed and the environmental pollution generated. After 2009, due to the global economic crisis and the deterioration of the ecological environment (especially the decline in air quality), China has paid more attention to improving the quality of economic development and has also strengthened its ecological protection policies, thereby achieving the continuous improvement of regional ecological efficiency. Then, does the regional innovation resource network accumulated by China during the period of rapid economic development promote the improvement of ecological efficiency? This study will analyze this issue from the perspective of collaborative innovation.
3. The Influence Mechanism of Collaborative Innovation
The development of regional collaborative innovation mainly depends on the flows of R&D capital and personnel. The R&D personnel level in different regions can be characterized by the full-time equivalent of R&D personnel for the region, while the R&D capital level is generally reflected by the R&D capital stock. The R&D capital stock can be calculated through the internal expenditure of regional R&D activities [70], and the formula is:
t t
t
K
I
K
=
(
1
−
ϕ
)
−1+
(6)In Formula (6), the R&D stock Kt of the t period is equal to the product of the R&D stock Kt-1
and 1-φ at the t-1 period plus the internal expenditure of the current R&D activity, I, while φ
represents the depreciation rate, which is 15%. The R&D stock K0 of the base period can be
expressed as:
)
(
0
0
=
+
ϕ
g
I
K
(7)In Formula (7), I0 is the internal expenditure of R&D activities for the base period, and g is
depreciation rate. The data for the full-time equivalent of R&D personnel and internal expenses of R&D activities are derived from the China Science and Technology Statistical Yearbook.
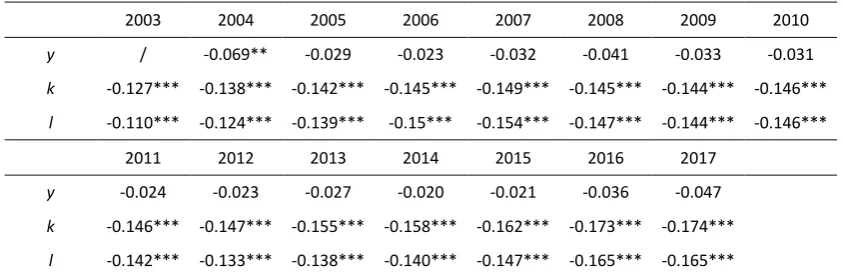
In order to explore the impact of collaborative innovation on the change in ecological efficiency, this study measures the spatial correlation of ecological efficiency change y in each year through the Moran’I index. The results show that there is no significant correlation between
ecological efficiency changes in various regions, but there is a significant spatial correlation between regional innovation capital k and human resources l, as shown in Table 2. So how does collaborative innovation affect the change in ecological efficiency? This study uses the gravity model and the system GMM model to carry out specific calculations.
Table 2. Spatial Relationship Between Changes in Ecological Efficiency and Innovative Resources
2003 2004 2005 2006 2007 2008 2009 2010 y / -0.069** -0.029 -0.023 -0.032 -0.041 -0.033 -0.031 k -0.127*** -0.138*** -0.142*** -0.145*** -0.149*** -0.145*** -0.144*** -0.146***
l -0.110*** -0.124*** -0.139*** -0.15*** -0.154*** -0.147*** -0.144*** -0.146*** 2011 2012 2013 2014 2015 2016 2017
y -0.024 -0.023 -0.027 -0.020 -0.021 -0.036 -0.047 k -0.146*** -0.147*** -0.155*** -0.158*** -0.162*** -0.173*** -0.174*** l -0.142*** -0.133*** -0.138*** -0.140*** -0.147*** -0.165*** -0.165***
Note: *, **, *** indicates statistical significance at the 10%, 5% and 1% level, respectively. The following tables are the same.
3.1. Gravity model
The gravity model can reflect the relationship of economy [71], ecology [72], and technological innovation [73] between various regions and can also measure the strength of spatial connections [74]. In order to reflect the ability of inter-regional science and technology flows, this study draws on Wang and Liu’s research [75] and constructs a gravity model from two
aspects: R&D capital flow and R&D personnel flow. The gravity model of R&D capital flow can be expressed as:
2
·
ate
ij j i ij
d
K
r
G
FK
=
(8)In Formula (8), considering that R&D capital has the characteristics of “profit-for-profit,” the
R&D capital attraction FCij of region i from region j is equal to the ratio of the product of the profit
margin level, ratei, and the above-scale enterprises of region i and the R&D stock Kj of region j, to
the squared term of the regional distance, d2. G is the gravitational constant and generally takes a
value of 1. Then, the overall R&D capital attractiveness of the region i, FCi, can be expressed as
the sum of the attractiveness of R&D capital in each region:
∑
=
=
301
j ij i
FK
FK
(9)Accordingly, the gravity model of R&D personnel flow can be expressed as:
2
·
ij j i ij
d
L
wage
G
In Formula (10), the attraction of the R&D personnel of region i from region j, FLij is equal to
the ratio of the product of the average wage level of region i, wagei, and the full-time equivalent
of the R&D personnel of region j, Lj, to the squared term of the regional distance, d2. Then, the
overall R&D personnel attraction FLi in region i can be expressed as the sum of the attractiveness
of the R&D personnel in each region:
∑
=
=
301
j ij i
FL
FL
(11)Due to the particularity of innovation activities, the existing research has different values for
d, and different value methods have their own advantages. In this study, geographical, economic, and technical distances are used to calculate the values, and the standardized averaged values of these three are used to characterize the distance d between regions.
Geographic distance d1. Geographic distance is the most direct data point to characterize the
physical distance between two places, which can objectively reflect the spatial distance between them. Geographic distance can be reflected by the linear distance, road distance, railway distance, or time distance between the two places. However, road distance, railway distance, and time distance between locations are not same in different years due to road construction, high-speed railway construction, and aircraft route setting, and this may lead to statistical errors. Therefore, this study selects linear distance to reflect the geographical distance. The specific operation is to calculate the linear distance between the provincial capitals through their latitude and longitude coordinates [76], and the data is derived from the National Basic Geographic Information System’s 1:4×10⁶ terrain database.
Economic distance d2. The quality of economic development ultimately affects the spillover
level and absorption capacity of innovation activities in different regions through a series of methods, such as infrastructure and education. When the economic gap between two regions is small, the innovation activities of the two regions are more likely to spill over into each other and be absorbed, but it is difficult for two regions with a large economic gap to realize the same. Referring to Wang and Xu’s research [77], the economic distance between two places can be
expressed as:
|
|
2
j i
ij
pcgdp
pcgdp
d
=
−
(14)The economic distance between region i and region j is the absolute value of the average per capita GDP (pc gdp) of each year. Therefore, the greater the economic gap between two places, the more difficult it is for innovation activities to spill over and be absorbed.
Technical distance d3. Similar to economic distance, the greater the gap in technology
between two places, the more difficult it is to achieve the absorption and spillover of innovation between them. Conversely, the closer the technical level, the easier it is for the two places to learn from each other. However, in contrast to economic distance, the technology gap also involves the similarity of technology between the two places. Therefore, this study simplifies Liu and Shan’s measurement method of technical distance and characterizes the technical distance
[78] by the authorized quantity of three patents: invention patent, utility patent, and design patent:
/
(
)
3
1 2 3
1 2 3
1
3
∑
∑
∑
= = =
=
k jk k
ik k
jk ik
ij
f
f
f
f
The technical distance between region i and region j is the difference between the number of k (k=1, 2, 3) kinds of patent grants, f, in the periods. When the technical structure of the two places is more similar, d3 is closer to 1, and closer to 0 if less similar. The technical gap in the same
region is 0, so this study calculates the reciprocal of the technical distance and then subtracts 1. The above data on per capita GDP and various patents are from the China Statistical Yearbook.
3.2. System GMM model
Regional ecological efficiency changes are not spatially significant (as shown in Table 2), but they are affected by the degree of ecological efficiency changes of different periods in the region. Therefore, this study does not use the spatial econometric model, but instead, adopts the system GMM model considering the impact of the lag period of ecological efficiency change. In this study, the ecological efficiency change y of each region is taken as the explanatory variable, and the R&D capital and personnel's absorptive capacity, FK and FL, respectively, are used as the core explanatory variables. Considering that the impact of innovation resources on changes in ecological efficiency may be non-linear, the squared terms of FK and FL are also used as core explanatory variables. In addition, this study also uses the first-phase lag term L.y of eco-efficiency changes as the core explanatory variable, as previous results tend to reflect a certain impact on the latter period, and the eco-efficiency changes in various regions are likely to experience hysteresis effects due to the inertia of regional eco-efficiency changes.
In terms of control variables, the impact of innovation on changes in ecological efficiency is also reflected in the government's support for innovation in the region. Therefore, the science and technology expenditure in government fiscal expenditure is selected as the proxy variable,
Gov, for government-supported innovation. The level of regional innovation is not only affected by the level of innovation in other parts of the country, but also by the level of innovation abroad. Therefore, FDI in each region is selected to characterize the foreign influence of the region [79]. The activity of the innovation market also affects the level of local innovation. This study selects the market turnover of technology to characterize this effect. The data of the control variables are from the China Statistical Yearbook, and the control variables and explanatory variables other than L.y are processed logarithmically. The ecological efficiency change impact model constructed in this study can be expressed as:
2 4
3 2 2
1
0
.
itln
it(ln
it)
ln
it(ln
it)
it
C
L
y
FK
FK
FL
FL
y
=
+
β
+
β
+
β
+
β
+
β
it it it
it
FDI
Market
Gov
β
β
µ
β
+
+
+
+
5ln
6ln
7ln
(16)In Formula (16), C is a constant term, and μi, ηi, and εit represent individual effects, time
change L.y of the lag phase as the instrumental variable and conducts empirical research through the sys-GMM model.
3.3. Analysis of regression results
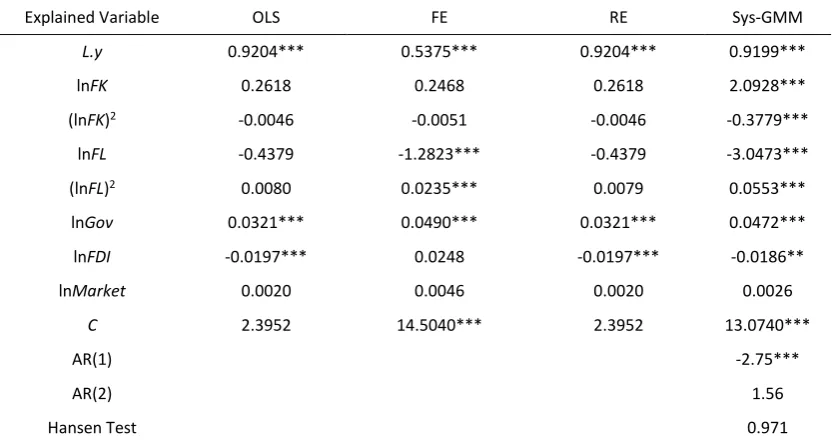
In order to compare the rationality of the sys-GMM model, this study also performs OLS regression, fixed effect regression (FE), and random effect regression (RE) on Formula (16) after the flattening of the economic data. The results are shown in Table 3. The correlation coefficient of AR(1) is significant at the level of 1%, while the correlation coefficient of AR(2) is not significant, indicating that there is a first-order autocorrelation for the difference of random disturbance terms. However, there is no second-order autocorrelation, so it accepts the original assumption that there is no autocorrelation in random interference terms, εit, which is the main premise
behind the sys-GMM. Due to the small sample size of this study, the Hansen test is used for the over-identification of instrumental variables. The P-value cannot reject the null hypothesis that
“all instrumental variables are valid,” indicating that the model is set properly, and there is no
over-identification of instrumental variable selection. In sys-GMM, the first-order lag coefficient of the interpreted variable, L.y, is 0.9199, which is between the fixed effect (0.5375) and the mixed OLS (0.9204), indicating that the GMM method is reasonable and robust, and the parameter estimation is true and effective. Under comprehensive judgment, the use of sys-GMM estimates is reasonable and can better reflect the impact of collaborative innovation on ecological efficiency.
Table 3. Regression Results of Collaborative Innovation on Ecological Efficiency Changes
Explained Variable OLS FE RE Sys-GMM
L.y 0.9204*** 0.5375*** 0.9204*** 0.9199***
lnFK 0.2618 0.2468 0.2618 2.0928***
(lnFK)2 -0.0046 -0.0051 -0.0046 -0.3779***
lnFL -0.4379 -1.2823*** -0.4379 -3.0473*** (lnFL)2 0.0080 0.0235*** 0.0079 0.0553***
lnGov 0.0321*** 0.0490*** 0.0321*** 0.0472*** lnFDI -0.0197*** 0.0248 -0.0197*** -0.0186**
lnMarket 0.0020 0.0046 0.0020 0.0026
C 2.3952 14.5040*** 2.3952 13.0740***
AR(1) -2.75***
AR(2) 1.56
Hansen Test 0.971
Note: AR(1) and AR(2) are the coefficient of the first-order autocorrelation and second-order autocorrelation of random interference terms, respectively. Hansen test is the P value of the instrument variable over-identification test.
efficiency, indicating that the estimated results are consistent with reality.
The coefficient of technological capital flow and its squared terms of collaborative innovation are 2.0928 and -0.3779, respectively, and both are significant at the 1% level, indicating that the flow of scientific capital has an inverted "U" relationship with ecological efficiency. This phenomenon occurs because under the current economic base level in China, regions are more willing to absorb green technology capital from other regions, which has improved local ecological efficiency. However, with the continuous accumulation of green technology capital, the characteristics of capital profit-seeking have been further enhanced, resulting in a decline in regional ecological efficiency. The coefficient of human resources’ flow
and its squared term of collaborative innovation are -3.0473 and 0.0553, respectively, and both are significant at the 1% level.
Contrary to the flow of technological capital, the flow of scientific and technological human resources has a positive "U" relationship with ecological efficiency. Although at the macro level, the region is more interested in attracting green technology innovation, for technology innovation practitioners, higher personal economic output means higher income levels, and green technology is relatively less important. Only when the human resources of scientific and technological innovation have been accumulated to a high degree, will they be able to effectively promote the improvement of ecological efficiency. The different impacts of capital and human resources of scientific and technological innovations on eco-efficiency also reflect the impacts of the larger GDP aggregates in various regions of China and the lower per capita GDP on the ecological environment.
In terms of control variables, the impact coefficient of science and technology expenditure in government public expenditure is 0.0472, and it is significant at the 1% level, indicating that the government's science and technology expenditure has a positive effect on local ecological efficiency, but the degree of promotion is low. This is because the government has the dual tasks of developing the economy and protecting the ecology. The government must ensure that scientific and technological innovation can promote economic development and also support the development of green science and technology innovation to a certain degree. However, the lower impact coefficient reflects that the green technology innovation supported by the government needs to be improved.
The influence coefficient of FDI on ecological efficiency in China is -0.0186, and it is significant at the 5% level, indicating that FDI has a small, but negative impact on ecological efficiency improvement. The technological innovation factors in FDI also adhere to the characteristics of capital profit-seeking. Although there will be some foreign green technology innovation spillovers, the spillover of non-green technology innovations dominates and inhibits the improvement of eco-efficiency. The coefficient of activity in the market for technological innovation is 0.0026, but this effect is not significant. The activities of the science and technology innovation market not only includes the activities of green technology innovation, but also the activities of non-green technology innovation. The structures formed by these two types of technology innovation are difficult to change in the short term, so there is no significant impact, positive or negative, on the overall improvement of ecological efficiency.
With the continuous deterioration of the environment and the tightening of resource constraints, the improvement of ecological efficiency is of great significance to the coordinated development of economy and ecology in various regions of China. Taking capital, human resources, and natural resources as inputs, this study uses regional GDP as the expected output and industrial waste, waste gas, and waste water as undesired outputs, and measures the ecological efficiency of various regions in China through the Global-Malmquist model. The ecological efficiency of the various regions shows an evolutionary trend of an initial rapid decline followed by a slow improvement in the time dimension. There is no obvious correlation feature in space, which is verified by spatial autocorrelation. The study also finds that the capital and human resources of technological innovation have obvious spatial correlation characteristics and includes empirical research on the impact of collaborative innovation on ecological efficiency.
In view of the particularity of the flow of scientific and technological innovation, this study first selects the comprehensive distance (geographical distance, technical distance, and economic distance) and quantifies the attraction of science and technology innovation capital and human resources in various regions of China through the gravity model. Then, the eco-efficiency is used as the explanatory variable, and the attractiveness of the scientific and technological innovation human resources and capital and their squared terms are used as explanatory variables, while the explanatory variables also include first-order lag terms of ecological efficiency. Taking the scientific and technological expenditures of government public spending, FDI, and technology market turnover as control variables, the sys-GMM estimation method is used to empirically analyze the impact of collaborative innovation on regional ecological efficiency. The results show that the flow of scientific and technological capital has a “U”-type relationship, while the flow of
scientific human resources has a positive “U” relationship with ecological efficiency. At the same
time, the ecological efficiency of the previous period has a positive impact on the current ecological efficiency. In addition, the government's public spending on science and technology has a small positive effect on the eco-efficiency, while FDI has the opposite effect. The activity of the technology market has no significant impact on eco-efficiency. Based on the above research conclusions, this study proposes some policy recommendations for decision makers.
Technological innovation has a greater promotion effect on ecological efficiency improvement before reaching the inflection point of the inverted U-shaped curve. Therefore, for regions with low technological innovation capital, it can serve as an important means to improve ecological efficiency, and it is important to effectively screen for and attract scientific and technological innovation capital. For regions with already higher levels technological innovation capital, it has less impact than other methods on the environment. These regions should also increase the attractiveness of science and technology innovation capital, but their main focus should be on the continuous improvement of the threshold for green technology innovation in order to ensure the coordinated development of the region's economy and ecology. Although, it must be noted that the profit-seeking nature of science and technology innovation capital is inevitable and is likely to act as an inhibitor to improvements in ecological efficiency.
regions should relax their talent introduction policies and encourage the introduction of human resources for scientific and technological innovation and reach the level of the inflection point as soon as possible.
Regarding the government's science and technology expenditure, although it has a promoting effect on ecological efficiency, the effect is relatively small. Some governments with better economic bases should appropriately increase the proportion of science and technology spending in public expenditures, and rationally adjust the structure of such spending, so that government-led technological innovation can play a more important role in the improvement of ecological efficiency and form the policy orientation that encourages the development of green technology innovation. For FDI, China has not completely shaken off the ecological and environmental impacts caused by the lower-end activities of the global value chain, and the country remains the best choice for developed countries seeking to transfer their low-end industries. However, with the improvement of scientific and technological innovation, China should formulate corresponding laws and regulations to ensure that the environmental damage caused by the introduction of foreign technological innovation is within a controllable range. Regions with better scientific and technological innovations should be selective in their screening of foreign science and technology, and reject certain technological innovations causing a greater degree of environmental damage. Regions with poorer scientific and technological innovation should make decisions on how to deal with the introduction of foreign non-green technology innovations and seek to minimize the damage to the ecological environment.
Funding: This work was supported by the National Science Foundation of China (NSFC) Funded Projects for Distinguished Young Scholars (Grant No. 41501141 and 41501136); Major program of the Chinese National Social Science Foundation (Grant No. 18ZDA040); China Scholarship Council (CSC) Project (Grant No. 201806270084 and 201706275035); Wuhan University Research Fund for Young Scholar Teams in Humanities & Social Sciences (Grant No. WHU2016024); Wuhan University Humanities and Social Sciences Independent Research Project (Grant No. 2018QN089). China Association for Science and Technology High-end Science and Technology Innovation Think Tank Doctoral Program (Grant No. CXY-ZKQN-2019-052).
Conflicts of Interest: The authors declare no conflict of interest.
References
1. Schiederig, T.; Tietze, F.; Herstatt, C. Green innovation in technology and innovation management - an exploratory literature review. R&D Management, 2012, 42(2), 180-192. 2. Wang, X.; Sun, C.; Wang, S.; Zhang, Z.; Zou, W. Going Green or Going Away? A Spatial Empirical
Examination of the Relationship between Environmental Regulations, Biased Technological Progress, and Green Total Factor Productivity. Int. J. Environ. Res. Public Health. 2018, 15, 1917.
3. Filippetti, A.; Archibugi, D. Innovation in times of crisis: National Systems of Innovation, structure, and demand. Res. Policy. 2011, 40(2), 179-192.
5. Wu, J.; Zhuo, S.; Wu, Z. National innovation system, social entrepreneurship, and rural economic growth in China. Technol. Forecast. Soc.2017, 121, 238-250.
6. Lee, S. M.; Olson, D. L.; Trimi, S. Co-innovation: convergenomics, collaboration, and co-creation for organizational values. Manage. Decis.2012, 50(5), 817-831.
7. Scherngell, T.; Hu, Y. Collaborative Knowledge Production in China: Regional Evidence from a Gravity Model Approach. Reg. Stud.2011, 45(6), 755-772.
8. Wang, Z. Knowledge integration in collaborative innovation and a self-organizing model. Int. J. Inf. Tech. Decis.2012, 11(02), 427-440.
9. Connell, J.; Kriz, A.; Thorpe, M. Industry clusters: an antidote for knowledge sharing and collaborative innovation? J. Knowl. Manag. 2014, 18(1), 137-151.
10. Xie, X.; Fang, L.; Zeng, S. Collaborative innovation network and knowledge transfer performance: A fsQCA approach. J. Bus. Res.2016, 69(11), 5210-5215.
11. Liu, Y.; Ying, Y.; Wu, X. Catch-up through Collaborative Innovation: Evidence from China.
Thunderbird International Business Review, 2016.
12. Feranita, F.; Kotlar, J.; De Massis, A. Collaborative innovation in family firms: Past research, current debates and agenda for future research. J. Fam. Bus. Str. 2017, 8(3), 137-156.
13. Najafi-Tavani, S.; Najafi-Tavani, Z.; Naudé, P.; Oghazi, P.; Zeynaloo, E. How collaborative innovation networks affect new product performance: Product innovation capability, process innovation capability, and absorptive capacity. Ind. Market. Manag. 2018, 73, 193-205.
14. Sun, C.; Wang, S.; Zou, W. Chinese marine ecosystem services value: Regional and structural equilibrium analysis. Ocean Coast. Manage.2016, 125, 70-83.
15. Wang, S.; Sun, C.; Li, X.; Zou, W. Sustainable Development in China’s Coastal Area: Based on
the Driver-Pressure-State-Welfare-Response Framework and the Data Envelopment Analysis Model. Sustainability, 2016, 8, 958.
16. Zurano-Cervelló, P.; Pozo, C.; Mateo-Sanz, J. M.; Jiménez, L.; Guillén-Gosálbez, G. Eco-efficiency assessment of EU manufacturing sectors combining input-output tables and data envelopment analysis following production and consumption-based accounting approaches. J. Clean. Prod. 2018, 174, 1161-1189.
17. Costanza, R.; Daly, H.; Bartholemew, J. A. Goals, agenda and policy recommendations for ecological economics. Ecological Economics: The Science and Management of Sustainability, Columbia University Press, New York, 1991, 1-20.
18. Jollands, N. Concepts of efficiency in ecological economics: Sisyphus and the decision maker.
Ecol. Econ. 2006, 56(3), 359-372.
19. Willard, B. The sustainability advantages: seven business case benefits of a triple bottom line. New Society Publishers, Gabriola Island, 2002.
20. Huppes, G.; Ishikawa, M. Eco-efficiency and Its xsTerminology. J. Ind. Ecol.2005, 9(4), 4. 21. Qin, X.; Sun, Y. Cross-Regional Comparative Study on Environmental–Economic Efficiency and
Driving Forces behind Efficiency Improvement in China: A Multistage Perspective. Int. J. Environ. Res. Public Health.2019, 16(7), 1160.
22. Yang, L.; Yang, Y. Evaluation of eco-efficiency in China from 1978 to 2016: Based on a modified ecological footprint model. Sci. Total Environ.2019, 662, 581-590.
24(4), 387-400.
24. Mickwitz, P.; Melanen, M.; Rosenström, U.; Seppälä, J. Regional eco-efficiency indicators - a
participatory approach. J. Clean. Prod.2006, 14(18), 1603-1611.
25. Kielenniva, N.; Antikainen, R.; Sorvari, J. Measuring eco-efficiency of contaminated soil management at the regional level. J. Environ. Manage.2012, 109, 179-188.
26. Winter, M.; Li, W.; Kara, S.; Herrmann, C. Determining optimal process parameters to increase the eco-efficiency of grinding processes. J. Clean. Prod. 2014, 61, 644-654.
27. Basset-Mens, C.; Ledgard, S.; Boyes, M. Eco-efficiency of intensification scenarios for milk production in New Zealand. Ecol. Econ. 2009, 68(6), 1615-1625.
28. Hahn, T.; Figge, F.; Liesen, A.; Barkemeyer, R. Opportunity cost based analysis of corporate eco-efficiency: A methodology and its application to the CO2-efficiency of German companies. J. Environ. Manage.2010, 91(10), 1997-2007.
29. Song, S. Ship emissions inventory, social cost and eco-efficiency in Shanghai Yangshan port.
Atmos. Environ. 2014, 82, 288-297.
30. Neto, J. Q. F.; Walther, G.; Bloemhof, J.; van Nunen, J.A.E.E.; Spengler, T. A methodology for assessing eco-efficiency in logistics networks. Eur. J. Oper. Res. 2009, 193(3), 670-682.
31. Van Caneghem, J.; Block, C.; Van Hooste, H.; Vandecasteele C. Eco-efficiency trends of the Flemish industry: decoupling of environmental impact from economic growth. J. Clean. Prod.
2010, 18(14), 1349-1357.
32. Picazo-Tadeo, A. J.; Gómez-Limón, J. A.; Reig-Martínez, E. Assessing farming eco-efficiency: A Data Envelopment Analysis approach. J. Environ. Manage.2011, 92(4), 1154-1164.
33. Chen, J.; Song, M.; Xu, L. Evaluation of environmental efficiency in China using data envelopment analysis. Ecol. Indic.2015, 52, 577-583.
34. Masternak-Janus, A.; Rybaczewska-Błażejowska M. Comprehensive Regional Eco-Efficiency Analysis Based on Data Envelopment Analysis: The Case of Polish Regions. J. Ind. Ecol. 2016, 21, 180-190.
35. Wursthorn, S.; Poganietz, W. R.; Schebek, L. Economic–environmental monitoring indicators for European countries: A disaggregated sector-based approach for monitoring eco-efficiency. Ecol. Econ.2011, 70(3), 487-496.
36. Camarero, M.; Castillo, J.; Picazo-Tadeo, A. J.; Tamarit, C. Eco-Efficiency and Convergence in OECD Countries. Environ. Resour. Econ.2013, 55(1), 87-106.
37. Oggioni, G.; Riccardi, R.; Toninelli, R. Eco-efficiency of the world cement industry: A data envelopment analysis. Energ. Policy.2011, 39(5), 2842-2854.
38. Sarkis, J.; Cordeiro, J. J. Ecological modernization in the electrical utility industry: An application of a bads - goods DEA model of ecological and technical efficiency. Eur. J. Oper. Res.2012, 219(2), 386-395.
39. Gómez-Limón, J. A.; Picazo-Tadeo, A. J.; Reig-Martínez, E. Eco-efficiency assessment of olive farms in Andalusia. Land Use Policy. 2012, 29(2), 395-406.
40. Arabi, B.; Munisamy, S.; Emrouznejad, A.; Shadman, F. Power industry restructuring and eco-efficiency changes: A new slacks-based model in Malmquist-Luenberger Index measurement. Energ. Policy. 2014, 68, 132-145.
42. Hu, W.; Guo, Y.; Tian, J.; Chen, L. Eco-efficiency of centralized wastewater treatment plants in industrial parks: A slack-based data envelopment analysis. Resour. Conserv. Recy.2019, 141, 176-186.
43. Deng, X.; Gibson, J. Improving eco-efficiency for the sustainable agricultural production: A case study in Shandong, China. Technol. Forecast. Soc.2018, In Press.
44. Li, L. B.; Hu, J. L. Ecological total-factor energy efficiency of regions in China. Energ. Policy.
2012, 46, 216-224.
45. Yu, Y.; Chen, D.; Zhu, B.; Hu, S. Eco-efficiency trends in China, 1978–2010: Decoupling environmental pressure from economic growth. Ecol. Indic. 2013, 24, 177-184.
46. Yin, K.; Wang, R.; An, Q.; Yao, L.; Liang, J. Using eco-efficiency as an indicator for sustainable urban development: A case study of Chinese provincial capital cities. Ecol. Indic.2014, 36, 665-671.
47. Huang, J.; Yang, X.; Cheng, G.; Wang, S. A comprehensive eco-efficiency model and dynamics of regional eco-efficiency in China. J. Clean. Prod. 2014, 67, 228-238.
48. Yang, L.; Zhang, X. Assessing regional eco-efficiency from the perspective of resource, environmental and economic performance in China: A bootstrapping approach in global data envelopment analysis. J. Clean. Prod. 2019, 173, 100-111.
49. Bai, Y.; Deng, X.; Jiang, S.; Zhang, Q.; Wang, Z. Exploring the relationship between urbanization and urban eco-efficiency: Evidence from prefecture-level cities in China. J. Clean. Prod. 2018, 195, 1487-1496.
50. Xing, Z.; Wang, J.; Zhang, J. Total-factor ecological efficiency and productivity in Yangtze River Economic Belt, China: A non-parametric distance function approach. J. Clean. Prod. 2018, 200, 844-857.
51. Tu, Z.; Hu, T.; Shen, R. Evaluating public participation impact on environmental protection and ecological efficiency in China: Evidence from PITI disclosure. China Econ. Rev. 2019, 55, 111-123.
52. Yu, Y.; Huang, J.; Zhang, N. Modeling the eco-efficiency of Chinese prefecture-level cities with regional heterogeneities: A comparative perspective. Ecol. Model.2019, 402, 1-17.
53. Yu, Y.; Hu, H.; Zhang, Y.; Yin, Z. Metafrontier Eco-Efficiency and Its Convergence Analysis for China: A Multidimensional Heterogeneity Perspective. Emerg. Mark. Financ. Tr.2019, 55, 1531-1549.
54. Wang, J.; Wang, S.; Li, S.; Cai, Q.; Gao, S. Evaluating the energy-environment efficiency and its determinants in Guangdong using a slack-based measure with environmental undesirable outputs and panel data model. Sci. Total Environ.2019, 663, 878-888.
55. Zhou, C.; Shi, C.; Wang, S.; Zhang, G. Estimation of eco-efficiency and its influencing factors in Guangdong province based on Super-SBM and panel regression models. Ecol. Indic.2018, 86, 67-80.
56. Sun, X.; Loh, L. Sustainability Governance in China: An Analysis of Regional Ecological Efficiency. Sustainability. 2019, 11(7), 1958.
57. Wang, S.; Sun, X.; Song, M. Environmental Regulation, Resource Misallocation, and Ecological Efficiency. Emerg. Mark. Financ. Tr.2019, 1-20.
58. Yu, Y.; Huang, J.; Zhang, N. Industrial eco-efficiency, regional disparity, and spatial convergence of China's regions. J. Clean. Prod. 2018, 204, 872-887.
Envelopment Analysis. J. Ind. Ecol.2005, 9(4), 59-72.
60. Zhang, B.; Bi, J.; Fan, Z.; Yuan, Z.; Ge, J. Eco-efficiency analysis of industrial system in China: A data envelopment analysis approach. Ecol. Econ.2008, 68, 306-316.
61. Han, Z.; Xia, K.; Guo, J.; Sun, C.; Deng, Z. Research of the Level and Spatial Differences of Land-sea Coordinate Development in Coastal Areas Based on Global-Malmquist-Luenberger Index. J. Natural Resour.2017, 32(8), 1271-1285. (In Chinese)
62. Chung, Y. H.; Fare, R.; Grosskopf, S. Productivity and undesirable outputs: A directional distance function approach. J. Environ. Manage. 1997, 51(3), 229-240.
63. Luenberger, D. G. Microeconomic Theory. Boston: McGraw Hill, 1995.
64. Wang, K.; Wu, C. The Temporal and Spatial Evolution of Green Total Factor Productivity in Chinese Cities - Based on Global Malmquist-Luenberger Index and ESDA Method. Manage. Modern.2017, 5, 33-36.
65. Oh, D. H. A Global Malmquist-Luenberger Productivity Index. J. Prod. Anal. 2010, 34(03), 183-197.
66. Zhang, N.; Kong, F.; Yu, Y. Measuring ecological total-factor energy efficiency incorporating regional heterogeneities in China. Ecol. Indic. 2015, 51, 165-172.
67. Li, W.; Li, Z.; Liang, L.; Cook, W. D. Evaluation of ecological systems and the recycling of undesirable outputs: An efficiency study of regions in China. Socio-Econ. Plann. Sci.2017, 60, 77-86.
68. Huang, J.; Xia, J.; Yu, Y.; Zhang, N. Composite eco-efficiency indicators for China based on data envelopment analysis. Ecol. Indic.2018, 85, 674-697.
69. Wang, S.; Zhang, J.; Fan, F.; Lu, F.; Yang, L. The symbiosis of scientific and technological innovation efficiency and economic efficiency in China - an analysis based on data envelopment analysis and logistic model. Technol. Anal. Strateg.2019, 31(1), 67-80.
70. Goto, A.; Suzuki, K. R&D capital, rate of return on R&D investment and spillover of R&D in Japanese manufacturing industries. Rev. Econ.Stat.1989, 21(4), 555-564.
71. Liu, Z.; Xu, Y.; Wang, P.; Akamavi, R. A pendulum gravity model of outward FDI and export. Int. Bus. Rev.2016, 25(6), 1356-1371.
72. Chen, J.; Xu, C.; Li, K.; Song, M. A gravity model and exploratory spatial data analysis of prefecture-scale pollutant and CO2 emissions in China. Ecol. Indic.2018, 90, 554-563.
73. Márquez-Ramos, L.; Martínez-Zarzoso, I. The Effect of Technological Innovation on International Trade. A Nonlinear Approach. Econ. E-J.2010, 4(11), 1-37.
74. Ghazalian, P. L.; Furtan, W. H. The Effect of Innovation on Agricultural and Agri-food Exports in OECD Countries. J. Agr. Resour. Econ.2007, 32(3), 448-461.
75. Wang, Y.; Liu, B. Why Is the Flow of R&D Elements So Important: Perspective of Total Factor Productivity. China Soft Sci.2017, 8, 91-101.(In Chinese)
76. Jin, G.; Shen, K. Neighborhood beggar or neighbour companion? Interaction between Environmental Regulation Implementation and Urban Productivity Growth. Manage. World.
2018, 12, 43-55. (In Chinese)
77. Wang, Q.; Xu, W. A Research on Chinese Inter-provincial Trade Based on Spatial Panel Interaction Model under Multi-dimensional Distances. China Ind. Econ. 2014, 3, 31-43. (In Chinese)
31(9), 1331-1337. (In Chinese)
79. Camarero, M.; Castillo, J.; Picazo-Tadeo, A. J.; Tamarit, C. Eco-Efficiency and Convergence in OECD Countries. Environ. Resour. Econ.2013, 55(1), 87-106.
80. Arellano, M.; Bover, O. Another look at the instrumental variable estimation of error-components models. J. Econ.1995, 68(1), 29-51.
81. Blundell, R. W.; Bond, S. R. Initial conditions and moment restrictions in dynamic panel data models. J. Econ.1998, 87(1), 115-143.
82. Bond, S. R. Dynamic panel data models: A guide to micro data methods and practice. Port. Econ. J.2002, 1(2), 141-162.