ISSN 2286-4822 www.euacademic.org
Impact Factor: 3.4546 (UIF)
DRJI Value: 5.9 (B+)
Using Statistical Control Methods to Know the
Quality of Industrial Production
ABDEL MONEIM KHALIL ABDULLAH AHMED
Abstract
This study aims to show the importance of statistical methods to know the quality of industrial products. Some statistical control tools, such as histogram, sampling plan and control charts were applied. The most important variables were applied to the cement factories and are considered the most important in terms of quality of the products, namely the blaine variable, the time of doubt and the resistance variable. The study was exposed to the level of The Six Sigma, which means to reach the highest levels of quality and lowest possible costs while maintaining the conformity of specifications for these variables in addition to know the ability of the production process to detect and eliminate any abnormal causes or deviations until the process is reached to the state of statistical control. The study reached a number of conclusions and recommendations included in the main body of the study.
Key words: statistical control methods, industrial production
Introduction
Undoubtedly, quality has now become an important requirement to satisfy the consumer’s desire, and control has become more important for the product to fulfill the consumer’s desire.
The main test of quality lies in the satisfaction of the beneficiary first and hence the biggest challenge emerges in the industrial sector in general and in the cement sector in particular, as this industry is one of the industries that require high standards of quality that exceed the beneficiary satisfaction to avoid the negative effects of poor quality.
The importance of studying :
The importance of this study is that it contributes to clarifying the most important statistical methods used in Yamama Cement Factory in Riyadh (Saudi Arabia)
As well as knowing the role played by the statistical methods used in increasing production.
Objectives of the study:
This study aims to try to shed light on the extent of the application of the use of statistical quality control used in knowing the quality of production, and accordingly it has branched out from it several goals, most notably: -
1. Learn about some statistical quality control methods that can be used in the processes of knowing the quality of industrial production in the cement industry.
2. Knowing the level of Six Sigma used in Yamama Cement Factory. 3. Study the statistical quality control methods used in the factory and their relationship to the production level and know the factory's ability to meet the quality requirements.
Study Approach
causal relationships between different factors to reach results that achieve the objectives of the research,
Basic concepts of quality
Quality has become at the present time one of the most important principles and foundations of modern management, and institutions have become extremely important as the commitment to quality and its standards has become one of the most important reasons for staying in the competition market and has become one of the elements of success and failure for different institutions.
The term quality has sparked widespread controversy in service organizations globally, and the secret of the fame that this term has attained is due to the success achieved by Japanese industries in improving the quality of their products and increasing workers in these industries, which caused American and Western organizations to pay attention to this phenomenon in order to protect their share In the global market. (Alwan, 2006 AD, p. 17)
Quality concept and definition
The quality in different establishments or business organizations according to the linguistic concepts used to express an inherent quality and is related to the good description, and this description is either a tangible physical object (goods or merchandise) or an intangible thing (services), in other words the thing described as quality is characterized by With positive specifications, it is said that it is good and acceptable in particular by the party that uses this thing or the party that deals with it, and therefore the quality is related to the provision of tangible and intangible things in an acceptable manner so that their descriptive and implicit positives are more than their negatives or that these things have obtained positive specifications at a level Given by touch Different levels of acceptance and rejection (Youssef, 2004).
environmental issues, and the change in customer behavior that began to see quality as a fundamental criterion for assessing and selecting the goods and services that satisfy its needs and desires regardless of their source.
The definitions of quality have multiplied among many writers and those who are interested in the topic of quality, and Goran has defined them as: (appropriate to use) (Al-Fadl, 2007, p. 404). This means that the user of the good or service will be able to rely on it to achieve what is required of it (Kahila, 2006, p. 3)
Definition of statistical quality control
Grant and Leavenworth define statistical quality control (SQC) as a set of statistical tools used to evaluate organizational quality (Grant & Leavenworth 1998: 67.).
It can be divided into three main sections (Costa 1999: 31, p 387–397:)
-Statistical description: It is used to describe the characteristics of quality, relationships, and interconnectedness among them. These include: mean, standard deviation, range and data distribution metrics.
Statistical process control (SPC): This includes inspections, checks, and drawing random samples from the process’s outputs to see if the process produces products within the design limits. Also, the statistical control of the process answers the question of whether the production process works properly or not?
Acceptance sampling: It is the process of random examination of a sample of goods and the decision to accept that batch of goods depending on the results of the examination, meaning that the acceptance samples determine whether it is possible to accept the batch or reject it.
Examples of statistical methods used in quality 1
) Preview line
There are three basic types of sampling plans: the unified sampling plan, the double sampling plan and the multiple sampling plan. The researcher has satisfied the first type, which is the unified sampling plan:
Mono preview plan
that production takes place in the form of batches, the decision of rejection or acceptance depends on examining each batch separately, but in the case of continuous production such as the production of electrical wires and fabrics, certain parts of it are taken as the beginning and middle of the roll Or its end, and the decision is taken after that (Kazem, 2000, p. 254)
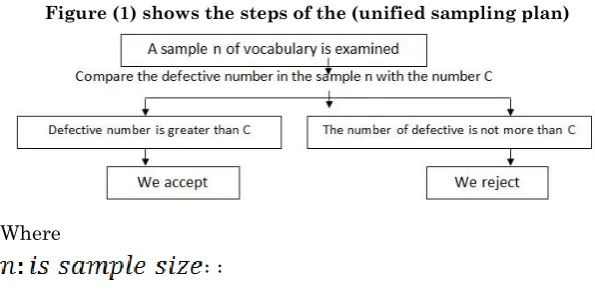
The philosophy of the single sample method is based on selecting a specific sample with size n from the large population N then the vocabulary of the selected sample is examined and the test results are recorded or recorded in terms of the proper number and the defective number and thus the defective number accepted in the sample is determined and if this number is denoted by the symbol C and is called a number Acceptance and the unified inspection is carried out according to the following scheme:
Figure (1) shows the steps of the (unified sampling plan)
Where
: : : :
Frequency distribution
It shows the different iterations of the varying values that measure each unit, with the distribution of the relevant frequencies presented in the form of beams, points or columns in a way that makes it easy to quickly identify the origins of those iterations and compare them (Al-Ashwah, 2014, p. 204).
There are some scientific rules that are followed in order to form an iterative distribution and they are summarized as follows (Al-Ashwah, 2014, p. 204):
The range is divided into an appropriate number (governed by the space available for display) of categories of equal length K (with the possibility of using categories of different lengths), and the number of specific categories usually ranges between 5 and 20 categories, according to the data.
The following rule can be used in the calculation of K, K = √N,
where N is the number of values.
(Https://en.wikipedia.org/wiki/Histogram)
The number of views that occur in each period (i.e. the frequency of each category) is determined, and the best way to determine these iterations is to set up the beam or points detection.
The histogram is drawn by drawing two orthogonal axes, representing the categories shown on the horizontal axis and their corresponding frequencies on the vertical axis, and the horizontal axis divided appropriately so that all the categories in the basic data table appear.
The importance of iterative distribution in quality controlThe
importance of iterative distribution is highlighted in the following: (Quality control: p. 32)
• Understanding the change between the data set very quickly, as it first indicates the size of the change in it and whether the data has a centering area and location of this region.
• Shows the extent of the change in the data.
• Shows the amount of symmetry for differences in the quality of the vocabulary or samples taken.
Therefore, iterative distributions give useful information about the quality of the products in a graphic format that is easy to understand, then analyze and then take the necessary corrective measures if necessary.
1) Statistical control chart
Statistical control map is defined as a graphical display of measurements over time that show the lower and upper bounds of the process to be monitored and quality controlled (Heizer, 1993. P: 753,.)
process and its systemic pattern by comparing the acceptable and targeted variance with the actual measured variance of the product and translating that To improve product quality and increase productivity in order to maximize the profitability of the organization (William etal 2011: 2.)
The basic idea of statistical control maps is based on conducting a continuous statistical analysis of the level of production quality or the main characteristics of the product with the aim of controlling quality by taking samples from production lines at specified time periods and within statistical indicators (Al-Lami and Al-Bayati 2008, p. 550).
The basis in the theory of control maps is to distinguish between the causes of the difference in the properties of the product, by applying the statistical theories of some changes that occur according to the pure chance that nothing can be done except to review the production process (Slack, et al: 1998: 644) and changes that occur by the causes Systemic, including a difference between machines, workers or raw materials used. These causes are dangerous to the productive process and affect it, so it must be diagnosed and take the corrective decisions appropriate to it (Al-Lami & Al-Bayati 2008, p. 550. .)
Control charts for Variables
Adjustment maps are used on variables on related values, such as weight, size, capacity used, dose of drug dose, and thermal resistance. Therefore, control or monitoring maps are of great importance compared to the settings maps on properties, as they are concerned with measured values that are rich in information, unlike just noting that The product is as good or as bad as it is for interesting feature set maps. It is noteworthy that the maps of setting the variables are based on two basic principles (Abdul Rahman, 2005, p. 85):
The hypothesis that the distribution of the values of the quality feature to be monitored is subject to a known distribution (normal distribution or other distributions).
Among the most important control maps for variables in the industrial fields are the map of the arithmetic mean (X -Chart), the standard deviation map (S-Chart), and the range map (R-Chart).
(Al-Mashhadani and Hanna, 1989, p. 451) adds that before the mapping of the arithmetic mean, the standard deviation and the extent, it is necessary to ensure the homogeneity of the drawn samples, and whether these samples represent the society of the phenomenon under study or not, and for this purpose the Bartlett test is used for this purpose.
Bartlett test
This test is used to check the consistency of the drawn samples, since
the two test hypotheses are:
(https://www.itl.nist.gov/div898/handbook/eda/section3/eda357.htm)
The test statistics are:
: The total sample size
: Sample size i
: Number of group
: Shared variance (combined or pool variance is the mean of
the group differences) from the formula
Where: is the value of the k 2 distribution, in degrees of
freedom, k-1 and the α significance level.
Six Sigma definition
Six Sigma is known in a number of ways. He defined it (Pande & Holpp, 2002, P: 16) as a statistical measure of process performance that aims to reach a level of near perfection that seeks to develop performance and is a smart way to manage work using facts and evidence. Harry (1997: P: 3) sees it as a methodology that aims to increase profitability, increase market share and customer satisfaction by using statistical tools. And after informing the researcher about many definitions, he knows that they are: a methodology for business administration that aims to satisfy the customer and seeks to limit distractions and reach the best solutions to provide the best service from the first time and every time.
Six Sigma methodology application
An important feature of Six Sigma is its well-defined methodology, which is based on two models: the DMAIC model for improving existing products and the DFSS model for product improvement starting from the design stage (Gupta, 2004).
DMAIC model
The DMAIC model is a model that aims to improve the current process and is the first of six Sigma models according to (Pyzdec & Keller, 2010). Six Sigma companies apply because they enable real improvements and produce real results (Sung H. Park, 2003, P: 37). It is an abbreviation of the keywords from the stages of the problem solving process which are Definition, Measurement, Analysis, Development, Improvement and Control. (Hung & Sung, 2011. )
Process capability analysis
(Salama, 1976) defines the ability of the production process as "achieving the production process of the specifications set."
Process capability indicators
Process capacity indicators are concerned with determining the relationship between actual process performance and specifications, and measures used to determine the relationship between the dispersal of the production process and the specifications of limits are in addition to being the main first step in any quality improvement program.
Montgomery DC (2005) has stated that when a process is not controlled, its parameters are unstable. Therefore, an important consideration for determining the capacity of the process is knowing whether the process is within statistical control or not.
There are many power indicators, the most important of which are CP, CPK, CPL, CPU, and the researcher will address here the most common and used, which is the coefficient of
This parameter allows to know the ability of the production process to manufacture a product according to specifications. Knowing the value of the parameter CP helps to understand the performance of the process. For example,if > 1.33 it corresponds to the ratio of non-conforming components of quality to 3.6 ppm and the performance of the process is satisfactory enough.
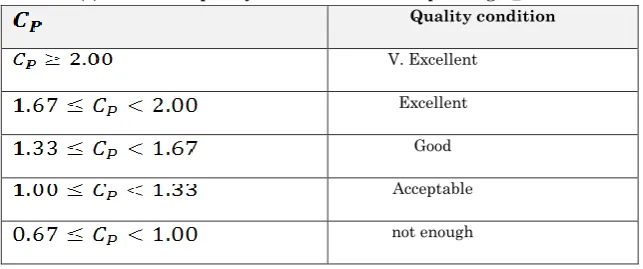
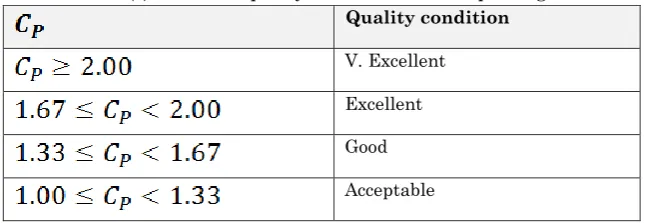
Table (1): shows the quality cases and the corresponding C_P values Quality condition
V. Excellent
Excellent
Good
Acceptable
Poor
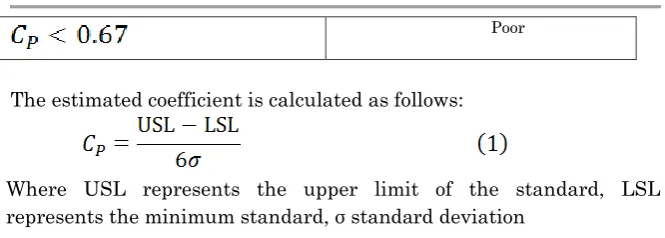
The estimated coefficient is calculated as follows:
Where USL represents the upper limit of the standard, LSL represents the minimum standard, σ standard deviation
Statistical control applied to AL-Y.M.F factory product
In this section, some statistical control methods will be applied to study data such as histogram, sampling method, statistical control maps, and then knowing the level of Six Sigma in the factory in addition to studying the ability of the process to meet customer requirements.
The mean, standard deviation and difference coefficient were studied as shown in the following table:
Table (2) - Statistical values of (blaine) variables
Variable Mean
standard deviation Less
value Maximum Value Coefficient
of variation
blaine 9933
1.08 01..
3624 .0.03
Source: Prepared by the researcher Note from Table (2) that:
Average BLAINE is 3394, standard deviation is 80.1, the lowest value is 2800 and the highest value is 3624, while the coefficient of variation for the BLAINE is 2.4%.
Using histogram quality control for the Blaine variable
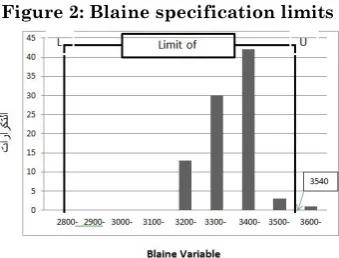
Figure 2: Blaine specification limits
From Figure (2): it is clear that there are three regions, as follows:
1
. The region is less than 2800 and it represents the area of non-conformity with specifications (according to the limits of Saudi specifications.)
2
. The area (between 2800 and 3540) represents the acceptance and compliance area.
3
. The area of rejection is greater than 3540, and it is called the economic rejection area, in order to increase the cost, in addition to its violation of economic specifications (Mohsen, 2007.)
It is noticed from the figure that there are some samples that do not meet the specifications represented in the column outside the specifications area.
Using the sampling plan to control the quality of the Blaine variable
The sampling plan is based on several components, the most important of which is the acceptance number c, which is a number agreed upon between the product and the consumer that shows the boundary between accepting or rejecting the produced payments and therefore it will be considered that the acceptance number C = 0)), which represents the number of acceptance that should be used at n≤20.
Table (3): Batch numbers and sizes and BLAINE variable values Sample No. Sample Size Sample items Item 1 Item 2 Item 3 Item 4 Item 5 1 5 3356 2979 3380 3357 3564 2 5 3072 3199 3470 3461 3503 3 5 3455 3316 3455 3042 3326 4 5 3466 3238 3352 3293 3206 5 5 3336 3523 3163 3036 3356 6 5 2800 2800 2800 2800 2800 7 5 3006 2971 3238 3025 3162 8 5 3262 3209 3343 3461 2800 9 5 3455 3052 3455 3221 3317 10 5 3466 3246 3523 3241 3051 11 5 3123 3420 3272 3043 3523 12 5 3420 3336 3040 3624 3001 13 5 3284 3350 3042 3142 3072 14 5 3441 3258 3461 3503 3455 15 5 3256 3455 2886 3291 3217 16 5 3312 3260 3268 3276 3038 17 5 3418 3256 3009 3461 3564
Source: Quality Control Department, Yamamah Cement Factory 2018
It is clear from Table (3) that the number of unmatched samples is 3, and therefore the probability of withdrawing a non-conforming sample is 3/17 = 0.0353)) which is greater than the acceptance number C = 0)) and therefore The payment will be rejected and considered inconsistent.
Using control the quality control chart of the Blaine variable
Before proceeding to the use of statistic fine-tuning maps of the BLAINE variable, it must be ensured that the samples that were withdrawn are homogeneous and the Bartlett test will be used for this purpose.
Table (4): Requirements for taking the Bartlett test
( ). ( ). 42.88 181822.8 10.72 45455.7 5 1 . . . . . . . . . . . . 43.04 187505.2 10.76 46876.3 5 17 702.16 2552952
Where :
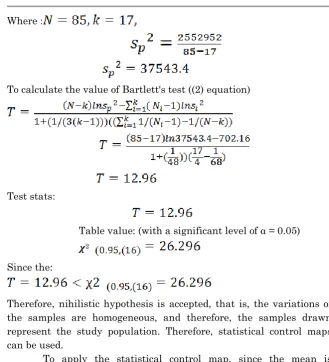
To calculate the value of Bartlett's test ((2) equation)
Test stats:
Table value: (with a significant level of α = 0.05)
𝝌2
Since the:
Therefore, nihilistic hypothesis is accepted, that is, the variations of the samples are homogeneous, and therefore, the samples drawn represent the study population. Therefore, statistical control maps can be used.
To apply the statistical control map, since the mean is unknown and the standard deviation is unknown, then the first of the three available alternatives is used:
Mean of Range use (R
Using the mean standard deviation (S ) (Pooled standard Deviation)
It is the use of mid-range (R .
The average range is calculated from the relationship
:
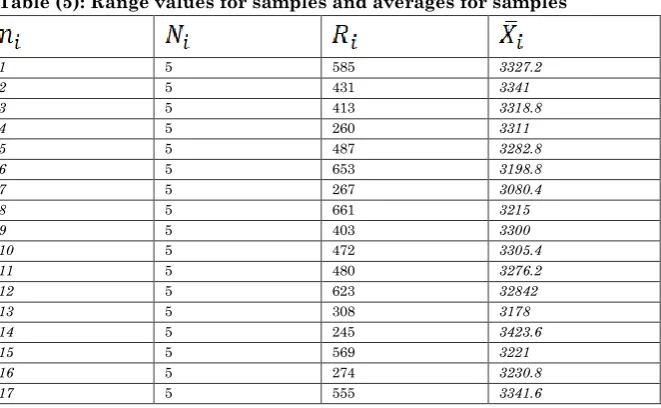
Table (5): Range values for samples and averages for samples
1 5 585 3327.2
2 5 431 3341
3 5 413 3318.8
4 5 260 3311
5 5 487 3282.8
6 5 653 3198.8
7 5 267 3080.4
8 5 661 3215
9 5 403 3300
10 5 472 3305.4
11 5 480 3276.2
12 5 623 32842
13 5 308 3178
14 5 245 3423.6
15 5 569 3221
16 5 274 3230.8
17 5 555 3341.6
Source prepared by the researcher
452
The boundaries of the control chart are after compensating the values of the variables
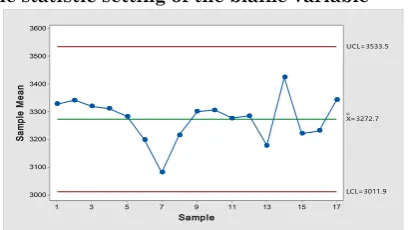
Figure (4): The statistic setting of the blaine variable
17 15 13 11 9 7 5 3 1 3600
3500
3400
3300
3200
3100
3000
Sample
Sa
m
pl
e
M
ea
n
__ X=3272.7 UCL=3533.5
LCL=3011.9
Source / minitab18
It is noted here that there are no points below the minimum for the tuning map, as well as the absence of points above the upper limit of the tuning map, and therefore the production process of the smooth variable (Blaine) is statistically controlled and goes according to the specifications.
Six Sigma level for BLAINE
To know the Six Sigma level for the factory, you must first know the number of defective or non-conforming units for one or more characteristics of the consumer, and therefore defects per unit (DPU) will first be calculated by:
Returning to the table and examining the samples, we find that the number of units outside the acceptance region is 3 units from the batch of 85 units, thus:
Defects per Million Opportunity (DPMO) can then be calculated:
That is, the factory operates at the level of 3.31 sigma in relation to the blaine property.
Capacity of the production process
To find out the ability of the production process to manufacture a product according to the specifications with regard to the BLAINE variable, the value of the C_P coefficient is calculated according to the formula:
ince the value of σ is unknown to society, it is replaced by the value of the standard deviation of samples and its value is 191, and therefore the value of the power factor becomes:
Referring to Table (6) p .: 130 and comparing the value of the power factor with the given values, we find that it falls in the period 〖1.33≤C〗 _P <1.67 and therefore the process capacity is satisfactory.
Table No. (6): shows the quality cases and the corresponding CP values
Quality condition
V. Excellent
Excellent
Good
not enough
Poor
Results:
The process is not statistically controlled when using the histogram.
The process is statistically uncontrolled when using the sampling plan.
When using tuning maps as a statistical means to know the quality of specifications, the BLAINE variable is identical in Al Yamamah factory.
جئاتن The results of the three paragraphs above show that dependence on multiple models of statistical control examination is very important to reach satisfactory results.
The difference in result is due to the use of the histogram, the unified sampling plan, and the statistical control maps in that the statistic control map depends on the average of the samples, while the sampling plan and the histogram depend on each sample separately.
The factory operates at the Six Sigma level for the BLAINE variant of 3.31.
The power factor of AL-Y.M.F plant is satisfactory, as it reached 1.54.
Recommendations
The necessity of using statistical methods to know the quality of industrial and other products.
Insufficient automated systems to control quality.
Working to increase the level of Six Sigma in industrial products in order to reduce non-conforming production.
References
1. Alwan, Qasim Nayef. (2005). Total Quality Management. First Edition. Jordan. Amman: The House of Culture for Publishing and Distribution.
2. Penelope Birzekop, (2008), translated by Mohamed Youssef, Six Sigma for Excellence in Business, Saudi Arabia., First edition, Obeikan Publishing.
3. Al Ali Rida, the owner of Abu Hamad, al-Musawi, Kazim. (2001). Management .. Contemporary Glimpses (1st Edition). Amman: Al-Warraq Institution for Publishing and Distribution.
4. Al-Ashwah, Zainab Saleh (2014), Methods and methods of scientific research and its most important pillars, Cairo, Egypt: The Arab Total for Training and Publishing.
5. Al-Lami, Ghassan Qasim Dawood; Al-Bayati Amira; Shukr Wali (2008), Production and Operations Management - Knowledge and Quantitative Bases. Jordan. Oman.
6. Abdel-Rahman, Mohamed. (2005). Statistical Methods for Quality Control, Master Thesis, Abi Bakr Belkaid University. Algeria
7. Al-Mashhadani, Mahmoud Hassan Hormuz; Amir Hanna (1989), Statistics, Baghdad: Higher Education Press.
8. Grant, E. L., and R. S. Leavenworth. (1998) , "Statistical Quality Control" , 6th ed. , New York , McGraw - Hill.
9. Costa, A. F. B. (1999). Joint and R Charts with Variable Sample Sizes and Sampling Intervals. Journal of Quality Technology 31,p 387–397.
10. -Heizer, Jay & Rander,Barry. (1993) "Production and Operations Management, Startegies &tactics". (Third edition) USA. New Jersey: Prentice-Hall. Inc, England Cliffs.
11. Snedecor, George W. and Cochran, William G. (1989), "Statistical Methods", Eighth Edition, Iowa State University Press.
12. Slack , Nigel & Chambers , Stuart & Harland, Christine &Harrison , Alan & Johnston , Robert (1998) , "Operations Managemant"( 2th ed). London:Pitman Publishing.
14. Gupta, P. (2004) Six Sigma Business Scorecard- Ensuring Performance for Profit, McGraw-Hill,New York
15. Sung.H.park(2003).Six Sigma for Quality and Productivity Promotion. Asian Productivity Organization, Tokyo, Japan 16. Douglas, C.( 2009) Montgomery, "Introduction to statistical