ISSN 2286-4822 www.euacademic.org
Impact Factor: 3.4546 (UIF) DRJI Value: 5.9 (B+)
Effect of adding linseed oil on in vitro gas and
methane production and some fermentation
characteristics
A. H. KUTTAR
Ministry of Science and Technology Directorate of Agricultural Research
MAJID HAMID RASHID
College of Agriculture, University of Diyala Animal Production Department
ASHWAQ ABD ALI
College of Agriculture, University of Baghdad Animal Production Department
Abstract:
This experiment was carried out in animal feeding laboratories in the Animal Production Department of the Faculty of Agriculture, University of Baghdad / Jadriya for the period from 1/12/2016 to 1/5/2017, where food supplements were used with different percentages of Linseed oil. 0,70,140,280 μl / kg dry matter to a mixture of concentrated feed and coarse feed to study its effect on total gas production and methane gas and fermentation properties ((pH, volatile fatty acid ratios (Acetic, propionic and butyric), ammonia nitrogen ratio)). Results:
1-. Using the gas production technology in the laboratory, a significant reduction in the total production of gas and methane in T2, T3, containing 70,140 μl / kg dry material from LO oil at incubation time after 12 hours in vitro compared to T1and T4 (supplemented with 280 μl / kg dry matter of LO oil). After 24 hours of in vitro incubation, T2 treatment was significantly reduced (p˂0.01) in total gas production compared to T3 and T4, For the production of methane, it was significantly lower (p˂0.01) for T2 compared to T3 and T4 respectively. The total volume of gas after 48 hours of in vitro incubation was significantly decreased (p˂0.01) for T2, T3 and T4 compared to the control treatment , the same T6 and T7 were significantly lower (p˂0.01) in methane compared to T2 and after 72 hours of laboratory incubation, T2 and T4 showed a significant decrease (p˂0.01) in total gas production while T6 was central between them and there were no differences In the size of methane in the models withdrawn after 72 hours of in vitro incubation.
2-1 There were significant differences (P˂0.01) in the pH values of the withdrawn samples after 12 hours of in vitro incubation compared to the control treatment, the T4 was significantly reduced (P˂0.01) in the pH values in the withdrawn models after 24 and after 48 and 72 hours of laboratory incubation. The T4 was significantly lower (P˂0.01) in the pH value compared to T2 and T3 respectively.
2-2 As for the concentration of ammonia nitrogen, The results showed that there were significant differences (P˂0.01) between the LO oil added to the hay in the concentration of ammonia nitrogen where T2, T3 and T4 containing LO were significantly reduced (P˂0.01) in nitrogen concentration Ammonia compared to T1 treatment of the withdrawn samples after 12 and 24 hours of laboratory incubation. The results also showed a significant decrease in (p<0.01) in the ammonia nitrogen concentration of T3 and T4 for the withdrawn samples after 48 and 72 hours of laboratory incubation compared to T2 treatment.
2-3 The results showed that there were significant differences (p<0.01) between the LO oil of the hay in the concentration of volatile fatty acids (acetic acid, butyric acid, propionic), where T2 and T3 were significantly lower (p<0.01) 12 days of incubation in vitro compared to T4 treatment, while no significant differences in acid concentration were observed 24 hours of laboratory incubation. T2 was significantly lower (p<0.01) in acetic acid concentration compared to T3 and T4 respectively, There were significant differences(p<0.01) in acid concentration In the samples withdrawn after 72 hours of in vitro incubation. As for propionic acid, LO (T5) showed a significant reduction(p<0.01) in the concentration of propionic acid after 12 in vitro incubation compared with T1 while T3 and T4 were significant(p<0.01) The concentration of propionic acid after 24 and 48 hours of in vitro incubation, while the concentration of acid and high morale (p<0.01) in the treatment T2 compared with the treatment T4, and the results showed no significant differences of LO oil treatments in the concentration of butyric acid has 12 and 24 hours incubation in the laboratory, Results showed a high morale (p<0.01) concentration Butyric acid for treatment T2 compared to control treatment after 48 and 72 hours of incubation laboratory.
Key words: linseed oil, in vitro gas and methane production, fermentation characteristics
INTRODUCTION
fermentation properties such as volatile fatty acids, ammonia nitrogen, pH After different incubation laboratory periods.
MATERIAL AND METHODS
1- Experiment Plan: The experiment was carried out in the nutrition laboratories of the Faculty of Agriculture / University of Baghdad-Jadriya, to study the effect of adding different levels of flaxseed oil by 140.70 and 280 μl / kg to a mixture of concentrated feed and coarse feed. The effect of feed type and addition of castor oil on the pattern of rumen fermentation, total gas production and methane gas in the laboratory.
2- Experiment Diet: The components of the experimental bush used in the study were provided from the animal field of the University of Baghdad / Faculty of Agriculture / Animal Resources Department consisting of 80% of alfalfa hay + concentrated feed 20% with the addition of linseed oil (140,70 and 280 micro liters / kg DM). In this study, the use of alfalfa hay should be crushed with a laboratory jar and a diameter of 1 mm in order to facilitate a mixture with concentrated feed and oil with completely before starting the experiment
Table 1: Percentage and components of raw materials included in the composition of concentrated nutritional diets used in the experiment.
%
Raw Materials
23 Barley
22 Wheat bran
13 Soybean Meal
40 yellow corn
1 Minerals and vitamins
1 Salt
14.62 Crud protein*
11.23 ME(MJ/Kg DM)**
*Calculated from the chemical analysis table for Iraqi feed materials (Al-Khawaja, 1978) (on DM% basis)
NFE × 0.014 + CF × 0.005 + EE × + 0.031
×
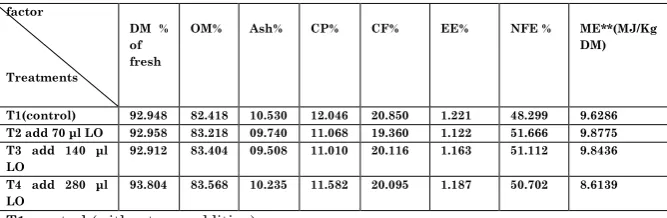
3-Chemical composition of primary feed materials and experimental diets Table ( 2 and 3) shows the chemical composition of the concentrates of the concentrates and the experimental grits with the added LO oil. The dry matter(DM), organic matter(OM), crud protein(CP), crud fiber(CF), Ether Extract(EE) and nitrogen-free extract(NFE) were estimated by AOAC (1984) In the nutrition laboratory of the Faculty of Agriculture - University of Baghdad / Department of Animal Production. As for the metabolizable energy, has been calculated under the following equation:
ME(MJ/Kg DM)=0.012XCP+0.031XEE+0.005XCF+0.014XNFE According to in vitro digestibility of DM* and OM** by method (Tilley and Terry,1963).
Table 2: shows the chemical composition of concentrated and roughage feed in the composition of the nutritional diets used in the experiment % .
ME*(MJ/Kg DM) NFE** % EE% CF% CP% Ash% OM% DM % of fresh factor Ingredient 11.6150 65.749 2.059 7.410 11.678 4.535 86.896 91.431 Barley 12.5846 69.384 4.890 2.879 10.092 2.951 87.245 90.196 yellow corn 10.7369 27.858 2.237 6.575 48.455 4.997 85.125 90.122 Soybean Meal 11.1806 50.804 4.563 11.998 17.114 5.672 84.479 90.151 Wheat bran 10.4345 51.485 1.95 18.094 14.312 10.574 85.841 96.415 alfalfa hay *ME(MJ/Kg DM)=0.012XCP+0.031XEE+0.005XCF+0.014XNFE **NFE(%OFDM)=%OM-(%CP+%CF+%EE)
Table 3: : shows Chemical composition and metabolizable energy (MJ / kg DM) for 80 % alfalfa hay with 20% concentrated feed and adding Linseed oil at 0.70,140 and 280 μl* / kg DM ME**(MJ/Kg DM) NFE % EE% CF% CP% Ash% OM% DM % of fresh factor Treatments 9.6286 48.299 1.221 20.850 12.046 10.530 82.418 92.948 T1(control) 9.8775 51.666 1.122 19.360 11.068 09.740 83.218 92.958 T2 add 70 μl LO
9.8436 51.112 1.163 20.116 11.010 09.508 83.404 92.912 T3 add 140 μl LO 8.6139 50.702 1.187 20.095 11.582 10.235 83.568 93.804 T4 add 280 μl LO
T1=control (without any addition)
T3= treated adding Linseed oil at 140 μl/ kg DM T4= treated adding Linseed oil at 140 μl/ kg DM
*
×μl=micro liters
** ME(MJ/Kg DM)=0.012X CP+0.031XEE+0.005XCF+0.014XNFE (MAFF, 1975)
RESULTS AND DISCUSSION
1-Production of total gas and methane gas in the laboratory
mg / 200 mg dry matter). These results are consistent with those of Marino et al. (2013), At the same time These results do not agree with Moreira et al. (2014), which indicated that adding different levels of vegetable oils by 0, 30, 50 and 70 resulted in a significant reduction in methane production, The reason for the decrease in the production of gas when adding oil to the crops may be due to the modification of the fermentation process and the decrease in its effectiveness due to the presence of a cover of oil on the feed material, which is considered as a basic food for rumen bacteria (Manso et al., 2009) For the feed material or perhaps the added oil contains some toxic substances that are harmful to the Microorganisms, especially cellulose and cellulose fibers in the rumen.
Table 4. Effect of linseed oil supplementation by 0, 70, 140 and 280 μl / kg DM on total gas production and methane (200 mg / DM) for the 80% alfalfa hay with 20% concentrated feed at different laboratory incubation periods.
Std±mean
Methane Volume Total gas
Volume Methane
Volume Total gas Volume Methane Volume Total gas Volume Methane
Volume Total gas
Volume Studied Trait Incubation periods(hour) Treatments 72 72 48 48 24 24 12 12 5.15±0.33 51.00±1.47 a 5.05±0.05 b 45.25±0.47 a 4.50±0.17 b 38.00±0.40 b 3.50±0.28 b 36.70±0.01 a T1(control) 5.15±0.49 41.50±0.64 c 5.71±0.44 a 36.25±0.62 d 4.50±0.28 b 36.25±0. 25 b 3.43±0.82 b 31.75±1.25 c T2 add 70 μl LO 5.50±0.64 43.00±1.08 bc 5.00±0.57 b 39.75±0.47 c 5.00±0.01 a 39.75±0.47 a 3.40±0.35 b 33.25±0.47 b T3 add 140 μl LO 4.90±0.75 45.50±0.64 b 5.00±1.01 b 41.75±0.62 b 5.20±0.46 a 39.65±0.47 a 4.50±0.28 a 35.45±0.49 a T4 add 280 μl LO N.S ** ** ** ** ** ** ** Significant
T1: control(without addition), T2: Diet adding linseed oil by 70 micro liters / kg DM, T3: Diet Adding linseed oil by 140 micro liters / kg DM, T4: Diet Adding linseed oil by 280 micro liters / kg DM, N.S indicates not significant, ** indicates significant differences at the probability level(P <0.01).
DM=dry matter LO=linseed oil
treatment (41.50 ml / 200 mg dry matter) compared to T4 (45.50 ml / 200 mg dry matter),These results do not agree with Morgavi et al.(2012),at the same time The results also showed no significant differences in methane production after 72 hours of in vitro incubation in the addition of LO oil, which is consistent with Murply et al. (1990) and inconsistent with Mizubuti et al. (2015). ) This may be due to the reflection of the effectiveness and extent of the degradation of food and feed digestibility which containing a high percentage of lignin that affect the effectiveness of the microbiology of analyzed fiber and thus affect the amount of gas produced in the rumen.
2- PH measurement
soybean oil) were added, and they were not similar (Sterk et al., 2011), which indicated that the concentration of pH decreased with the addition of vegetable oil This may be due to the survival of microorganisms in Crash with increased estrogen degradation and increased concentration of volt fatty acids at a time added by the oil to the diets .
Table 5. The effect of adding linseed oil by 0, 70, 140 and 280 μl / kg dry matter, on the pH of the alfalfa hay (80%) with the concentrated feed (20%) in different incubation periods.
T1: control(without addition), T2: Diet adding linseed oil by 70 micro liters / kg DM, T3: Diet Adding linseed oil by 140 .micro liters / kg DM, T4: Diet Adding linseed oil by 280 micro liters / kg DM, ** indicates .significant differences at the probability level(P <0.01).
3- Measuring the concentration of Nitrogen ammonia The results of Table 6 show the concentration of ammonia nitrogen concentration in the rumen liquid for 80% alfalfa hay with 20% of concentrated feed at the effect of adding LO oil of 0, 70, 140 and 280 μl / kg dry matter in incubation periods after 12,24,48 and 72 h in vitro, The results showed significant differences (P<0.01) between the concentrations of nitrogen ammonia in the samples with taken after 12 hours in laboratory incubation, that T3 and T4 showed a significant decrease in ammonia nitrogen concentration (P<0.01) at (31.05 and 30.05 mg / 100), compared with T1 and T2(32.85 and 32.45 mg / 100 ml) .Also The results showed a significant reduction (P<0.01) for T2, T3 and T4, which contained LO oil of (31.65,31.85 and 30.00 respectively), compared with the treatment of T1 (32.85 mg / 100 ml), After 24 hours of
Std±mean
PH Studied Trait
Treatments
Incubation periods(hour) 72 48
24 12
6.85±0.05ab 6.70±0.005b
6.55±0.05b 0.05b ±6.35
T1(control)
7.00±0.005a 7.10±0.10a
7.05±0.05a 6.45±0.05ab
T2 add 70 μl LO
6.95±0.15a 7.20±0.10a
7.10±0.10a 6.65±0.05a
T3 add 140 μl LO
6.75±0.005b 6.75±0.05b
6.60±0.10b 6.60±0.005a
T4 add 280 μl LO
** **
** *
*
Table 6. Effect of the addition of linseed oil by 0, 70, 140 and 280 μl / kg dry matter on nitrogen ammonia for 80% alfalfa hay with 20% concentrated feed in different laboratory incubation periods.
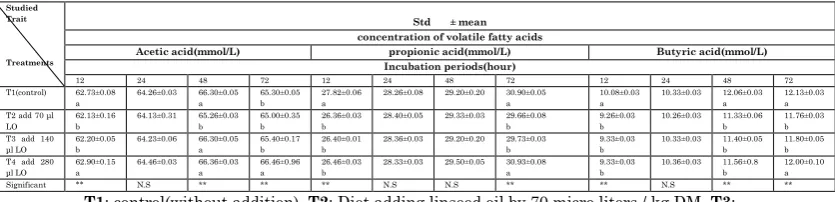
4. Measuring the concentration of volatile fatty acids (VFA)
The results of Table 7 show the concentration of volatile fatty acids (acetic, propionic, butyric acids) in the rumen liquid of the 80% alfalfa hay with 20% concentrated feed when added LO oil by 0, 70, 140 and 280 micro liters / kg dry material in vitro periods after 12,24 , 48 and 72 h, The treatment T4 (62.90 mmol / L) was significantly higher (P<0.01) in concentration of acetic acid on T2 and T3 (62.13 and 62.20 mmol / L) In the samples taken from the rumen fluid after 12 hours of laboratory incubation, While there was no significant difference in the concentration of acetic acid between the treatment which were containing LO oil After 24 hours of laboratory incubation. After 48 hours of laboratory incubation, the concentration acetic acid was significantly decreased(P<0.01) in the T2 which was containing the (70 μl) LO oil at (65.26 mmol / L) compared with T3 and T4 (66.30 and 66.36) mmol / L respectively). The results showed significant differences between LO oil by 0.70, 140 and 280 μl / kg dry matter after 72 hours of laboratory incubation, that concentration acetic acid was significantly decreased(P<0.01) in the T1,T2 and T3 at (65.30,65.00 and 65.40 mmol / L) compared with T4(66.46 mmol/L), These results were consistent with Toral et al. (2009),As These results are not consistent with Atkinson et al. (2006), which added that the vegetable oil to the diet had a
Std±mean
Nitrogen ammonia Studied Trait
Treatments
Incubation periods(hour)
72 48
24 12
30.75±1.05b 30.00±1.10b
32.25±0.55a 32.85±0.05a
T1(control)
31.25±0.05a 31.35±0.15a
31.65±0.05b 32.45±0.05a
T2 add 70 μl LO
30.55±0.05b 30.60±0.005b
31.85±0.05b 31.05±0.05b
T3 add 140 μl LO
29.25±0.05c 30.70±0.20b
30.00±0.005c 30.05±0.05c
T4 add 280 μl LO
** **
** **
L) Containing 70,140 and 280 μl / kg dry matter of LO oil, compared with T1(10.08 mmol / L). while The also results showed no significant after 24 hours of laboratory incubation, While the results showed that were significant differences (P<0.01) in the concentration of butyric acid in the samples taken after 48 and 72 hours. A significant decrease was observed (P<0.01) in the concentration of butyric acid, decreased in treatment T2,T3 and T4 significantly in the concentration of butyric acid for both periods at (11.33,11.40,1156 and 11.46,11.80 mmol / L) except T4 from period 72 h that was Recorded higher concentration of butyric acid(12.00 mmol / L) compared with control treatment T1 (11.86 and 12.13 mmol / L), These results were Similar to those obtained by Doreau and Chilliard (1997), but are not consistent with Aghajanzadeh-Golshani et al. (2015b), which they mentioned that the addition of vegetable oils was significant in rumen fermentation with microorganism survival and high volatile fatty acid content and precipitation, As well These results are conformity to those obtained by Kristensen and Harmon (2004), whereas The addition of vegetable oils has improved the concentration of butyric acid in the mixture by keeping the activity of microorganisms in rumen with increasing the decomposition of the Astria bonds in rumen.
Table 7. Effect of linseed oil supplementation by 0, 70, 140 and 280 μl / kg dry matter on the concentration of volatile fatty acids (acetic, butyric and propionic acid mmol / L) for the 80% alfalfa hay with 20% concentrated feed in different laboratory incubation periods.
T1: control(without addition), T2: Diet adding linseed oil by 70 micro liters / kg DM, T3: Diet Adding linseed oil by 140 micro liters / kg DM, T4: Diet Adding linseed oil by 280 micro liters / kg DM, N.S indicates not significant, ** indicates significant differences at the probability level(P <0.01).
Std ±mean
Studied Trait
Treatments
concentration of volatile fatty acids
REFERENCES
1. Castillejos, L., Calsamiglia, S. and Ferret, A.2006. Effect of
essential oils active compound on rumen microbial fermentation and nutrient flow in-Vitro System .J. Dairy.Sci.,89:2649-2658.
2. Fellner, V. 2002. Rumen microbes and nutrient management. North
Carolina state university. ARPAS Conference.
3. Barton, M.D.2000. Antibiotic use in animal feed and Its impact on
human health.NUTR,Res,Rev.,13:279-299.
4. Cowan, M.M.1999. Plant products as antimicrobial agent. Clin.,
Microbial Rev.,12:564-582.
5. Chaouki, Benchaar and Henry Greathead. 2011. Essential oils
and opportunities to mitigate enteric methane emissions from ruminants.Volumes 166–167, 23 June 2011, Pages 338-355.
6. Thompson, Lilian U and Cunnane, Stephen C. eds
(2003).Flaxseed in human nutrition. 2nd ed. AOCS Press. pp. 8–
11. ISBN 1-893997- 38-3.
7. Vereshagin, A. G. and Novitskaya, G. V .1965. The triglyceride
composition of linseed oil. Journal of the American Oil Chemists Society 42,970-974.
8. Diller, S. and J. Diller. 2004. Craftsman's. Construction
InstallationEncyclopedia, Craftsman Book Company, p. 503.
9. Khawaja, Ali Kazem, Elham Abdullah and Samir Abdel Ahad
(1978). Chemical composition and nutritional value of Iraqi feed
materials Bulletin issued by the Nutrition Section of the General Livestock Directorate of the Ministry of Agriculture and Agrarian Reform, Republic of Iraq.
10. MAFF.1975.Ministry of Agric.,Fisheries and Food Dept. of Agric.
and Fisheries for Scotland energy allowances and feed system for ruminants, Technical Bulletin,33.
11. Marino, C. T., M. J. Ruiz-Moreno, T. M. Schulmeister, F. M.
Ciriaco, D. D. Henry, V. R. G. Mercadante, G. C. Lamb, N.
DiLorenzo,2013 .Effects of extracts of cashew nut shell and castor
oil on in vitro ruminal fermentation, gas production kinetics, and methane production. J. Dairy Sci. 96(E-Suppl. 1):[page number]. or J. Anim. Sci. 91(E-Suppl. 2)
12. Moreira, M. N., Silva, A. M. A., Carneiro, H., Bezerra, L. R.,
Morais, R. K. O. & Medeiros, F. F. (2014). In vitro degradability
13. Manso,T.,R.Bodas,T.Castro,V.Jimeno,A.R.Mantecon.2009
)Animal performance and fatty acid composition of lamb fed with Different vegetable oils.Meat.Sci.83:511-516.
14. Morgavi, D.P., C. Martin, J.P. Jouany, and M.J. Ranilla. 2012.
Rumen protozoa and methanogenesis: not a simple cause-effect relationship. British Journal of Nutrition 107:388-397.
15. Murphy, D.J.1990. Strong lipid Bodies in the plant and other
organisms. Prog lipid Res.29(4):299-324.
16. Musibau A. B., I. M. Ogunade, F. Amaro, Y. Jiang, T. F.
Bernardes, D. D. Henry, V. R. Vasconcelos, F. O. Ugiagbe, U. J. Ikhatua, N. DiLorenzo, and A. T. Adesogan.2015.
Methanogenesis reduction ability of monensin and essential oils from two Nigerian citrus species. J. Anim. Sci. Vol. 93, Suppl. s3/J. Dairy Sci. Vol. 98, Suppl. 2.
17. Jalc, D0, Certik M., Kundrikova K. and Namestkova P.,2007.
Effect of unsaturated C-18 fatty acids(oleic linoleic and alph-linlenic acid)on ruminal fermentation and production of fatty acid isomers in arti- ficial rumen. Veterinarni Medicina,52.p.87-94.
18. Sterk A, Johansson BEO, Taweel HZH, Murphy M, Van
Vuuren AM, Hendriks WH and Dijkstra J 2011.Effects of forage
type, forage to concentrate ratio, and crushed linseed supplementation on milk fatty acid profile in lactating dairy cows. Journal of Dairy Science 94, 6078–6091.
19. Szumacher, S. M., S.A. Martin, A. Pothanski, A. Cielak and J.
Kowalczyk.2004. Changes in fermentation processes as the effect of
vegetable oil supplementation in vitro studies. J. Anim. Feed..Sci., 13: 215-218.
20. Gunal, M., A. Ishlak, A.A. AbuGhazaleh , and W. Khattab.2014.
Essential oils effect on rumen fermentation and biohydrogenation under in vitro. conditions. Czech J. Anim. Sci., 59, 2014 (10): 450– 459.
21. Mertens, D. R. 2002. Gravimetric determination of amylase-treated
neutral detergent fiber in feeds with refluxing in beakers or crucibles: collaborative study. J. of AOAC. Inter, 85(6), 1217-1240.
22. Vargas, J.E.,S. Andres, D. R. Yanez R and S.Lopez.2011.The
effect of olive, sunflower or linseed oils on the fermentation pattern and methane production in the rumen simulating technique, ptionsMediterraneennes,A,99:163-168.
23. Doreau, M. and A. Ferlay. 1994. Digestion and utilization of
fatty-acid by ruminants. Anim .feed Sci. Technol.,45:379 -396.
24. Wallace, R.J.N.R.F. McEwan, M. Mclntoosh, B. Teferedegne
and C. J.Newbold, 2002. Natural products as mainpulators of
25. Toral, P.G., A. Belenguer and P. Frutos. 2009.Effect of the supplementation of a high –concentrate diet with sunflower and.Fish oils on ruminal fermentation in sheep. Small Ruminant Research,81:1119- 125.
26. Atkinson, R.L., E.J. Scholljegerd, and S.L. Lak. 2006. Esterifed
fatty acid.in sheep fed a high-concentrate diet supplemented with site and extent.of digestion, duodenal flow, and intestinal disappearance of total and. high-linoleate sunflower oil. J. of Anim. Scie.,84:387-396.
27. Oliveira, J. S., Antoniassi, R., Freitas, S. C. & Müller, M. D.
(2013). Chemical composition of glycerin produced by biodiesel
plants in Brazil and potential utilization in animal feeding. Ciencia Rural, 43(3), 509-512.
28. Martin, A., Varona, S., Navarrete, A., Cocero,M.J., 2010.
Encapsulation and co-precipitation processes with supercritical fluids: application with essentials oils. open Chem.Eng.J.,4,31-41.
29. Getachew, G. P.H. Robinson, E. J.Depeters and S. J.Taylor.
2004. Relation between chemical composition, Dry matter
dehydration and in vitro gas production of several ruminant feeds. Animal and Technology, Amsterdam,111(1-4):57-71.
30. Benchaar, C., Duynisveld, J. L. and E .Charmley., 2006. Effects
of monensin and increasing dose levels of a mixture of essential oil compounds on intake, digestion and growth performance of beef.cattle. Canadian Journal of Animal Science, 86, 91-96.
31. Dohme, F., A. Machmüller, A. Wasserfallen. and M. Kreuzer.
2011. Ruminal methanogenesis as influenced by individual fatty
acids supplemented to complete ruminant diets. Letters in Applied Microbiology.: 32(1):47–51.
32. Doreau, M and Y.Chilliard. 1997. Digestion and metabolism of
dietary fat in farm animals.Br.J.Nutr.78:S15-S35.
33. Aghajanzadeh-Golshani A., Naser Maheri-Sis., Ramin S.
Doust- Nobar.,Y. Ebrahimnezhad. and A. Ghorbani. 2015b
Comparing fermentation kinetics and nutritional value of alfalfa hay using rumen and faeces liquor as inocula for in vitro gas production technique. Journal of Biodiversity and Environmental Sciences. Vol. 5, No.( 3) : 308-315.
34. Kristensen, N.B.; Harmon, D.L. 2004. Effect of increasing