Analysis, optimization, and characterization of magnetic
photonic crystal structures and thin-film material layers
M. Vasiliev, K. Alameh, and M. Nur-E-Alam
Electron Science Research Institute, School of Science, Edith Cowan University, 270 Joondalup Dr, 6027, WA, Australia.
Corresponding author: Mikhail Vasiliev ([email protected])
Abstract:
MPC (Magneto-Photonic Crystal) Optimisation is a feature-rich Windows software application designed to enable researchers to analyze the optical and magneto-optical spectral properties of multilayers containing gyrotropic constituents. A set of computational algorithms aimed at enabling the design optimization and optical or magneto-optical (MO) spectral analysis of 1D magnetic photonic crystals (MPC) is reported, together with its Windows software implementation. Relevant material property datasets (e.g., the optical spectra of refractive index, absorption, and gyration) of several important optical and MO materials are included, enabling easy reproduction of the previously published results from the field of MPC-based Faraday rotator development, and an effective demonstration-quality introduction of future users to the multiple features of this package. We also report on the methods and algorithms used to obtain the absorption coefficient spectral dispersion datasets for new materials, for which the film thickness, transmission spectrum, and refractive index dispersion function are known.
Keywords: 1D magnetic photonic crystals; multilayer film modelling; modelling of Faraday rotation spectra; MPC optimization; exhaustive computation; materials characterization
Program summary
Program Title: Optimisation of 1D Magnetic Photonic Crystals (alternatively, MPC Optimisation)
Program Installation Files: available from
https://drive.google.com/open?id=1P3UgIu6nbfbmqXexrbppeiSIffplE-uv
Licensing provisions: Creative Commons Attribution-NonCommercial-3.0 Unported (CC BY-NC-3.0)
Programming language: Visual C#, compiled using Microsoft Visual Studio .NET 2003
Nature of problem: Calculation of the optical transmission, reflection, and Faraday rotation spectra in multilayer thin films containing gyrotropic constituents (magnetized material layers possessing magneto-optic properties); optimization of magnetic photonic crystal (MPC) designs aimed at achieving maximized transmission or reflection coincident with maximized Faraday rotation, according to sets of defined criteria; fitting of the experimentally measured transmission or reflection spectra to theory models; fitting of the absorption coefficient spectra of single-layer thin film materials using the data for optical transmission, film thickness, and refractive index spectra.
Solution method: The developed programme exhaustively calculates multiple possible multilayer structure designs, based on the design structure type(s) defined prior to running optimisation. Complex-valued 4×4 transfer matrix method (accounting for all dielectric tensor components, including the non-diagonal terms responsible for gyrotropic effects) is implemented to compute the complex field amplitudes and optical intensities in either the
transmitted or reflected left-hand and right-hand circularly-polarized eigenwaves propagated through the thin-film-substrate structure.
Restrictions: The program is designed for use in conjunction with reliable optical constant datasets for up to 3 component dielectric materials, one of which can be modeled as magnetic dielectric possessing Faraday rotation; metallic layers are not implemented. Embedded active-X controls enabling graphical data output accept only up to 1000 data points per graphing control, whether plotting a single curve or several.
1. Introduction and background
In recent years, there has been some resurgence in the research interest dedicated to engineering and characterization of magneto-optic iron-garnet materials [1-4]. Thin-film magnetic garnets are semi-transparent magnetic dielectrics possessing record specific Faraday rotations of up to several thousand °/cm, in the near-infrared spectral range, if containing bismuth substitution [5]. Generically, the chemical composition of garnet materials of this type can be described by the formula (BixRe3-x)FeyM5-yO12, where Re is rare-earth metal (e.g. Dy, Sm, Lu, Nd, or Ce), and M is transition metal such as Ga or Al [5]. The exploration of this important subclass of functional materials has decades-long history, starting from the days of bubble-domain magnetic memory development, and more recently, continued with renewed research activities, in application areas ranging from on-chip nonreciprocal components (waveguide isolators, [2, 6]), to magnetic recording [7].
Magnetic garnet materials synthesized by a range of thin-film deposition techniques and crystal-growth methods have also attracted a significant research and development momentum since 1990’s, and throughout the last two decades, in areas ranging from photonic crystals to spintronics [8-14, 15]. Various approaches to the design and manufacture of magnetic photonic crystals (MPC) with tunable properties, and potentially suitable for the fabrication of non-reciprocal optical components have been reported [8-18]. Many research groups have focused on optimizing the thickness of one-dimensional (1D) MPC structures to simultaneously achieve 45°of Faraday rotation angle and maximum possible transmission at optical telecommunication wavelengths. MPCs based on quarter-wavelength thin-film stacks, which are sequences of magnetic and nonmagnetic layers with multiple embedded phase shifts (termed defects, or missing layers), have been shown to possess a significant potential for practical implementation of integrated optical isolators. This is due to the necessity of approaching Faraday rotations as large as 45°, which has been shown to be attainable, due to the resonant enhancement of Faraday rotation observed in such structures. Complex 1D MPC designs featuring “flat-top” spectral response, with almost 100% transmission within a large bandwidth (several nanometers), and close to 45°of Faraday rotation at 1550 nm can contain in excess of 200 layers [10,11], limiting their applications to the near-infrared range, where the magnetic garnets possess very low (negligible) optical absorption. Since the original development of this present MPC Optimisation program in 2005 [18], multiple garnet materials development efforts have been undertaken within our group [19-21], all of which have relied substantially on material characterisation options featured within the same software package. In particular, the option of deriving the data for the spectral dispersion of the absorption coefficient using the measured transmission spectrum and refractive index dispersion data has been very useful in characterisation of new nanocomposite-type garnet materials synthesized by co-sputtering using an extra oxide material source [19]. The present-day performance limits of 1D MPC in the visible spectral range have been evaluated using the same software [22] and using the available spectral data on the optical properties of the best-performing magnetic garnet compositions. Optical constants data of multiple recently-synthesized magnetic garnet compositions have been evaluated using the measured transmission spectra in conjunction with MPC Optimisation software and Swanepoel envelope method [23]. Our group’s preferred method for calibrating the quartz microbalance sensor’s tooling factors of various deposition sources also involves fitting the actual film layer thickness using MPC Optimisation software in conjunction with measured transmission spectra.
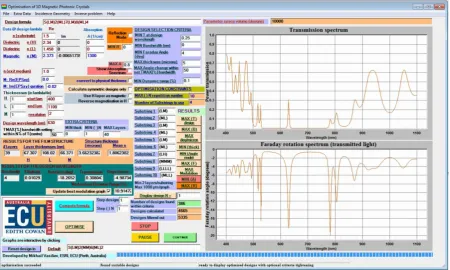
Figure 1. Front-panel controls of MPC Optimisation software and a sample optimised MPC design obtained by clicking the “Optimise” button without changing default-entered data. The result is MPC structure designed to operate at 630 nm, reliant on a magnetic garnet material of specific Faraday rotation near 2°/m at that wavelength, however, the structure enhances the Faraday rotation to 4.98°/m within the spectral transmission peak.
The default-entered materials-related data used to optimise MPC designs (within the parameter space and constraints also entered as default values not relevant to any particular application) relate to a MPC design based on magnetic garnet composition Bi2Dy1Fe4Ga1O12 and SiO2 L-type layers, deposited onto a glass substrate. The optical constants and gyration data for wavelengths near 630 nm have been obtained from thick garnet layers of this composition, and the corresponding index dispersion dataset is also pre-loaded into the menu item “Extra Data | Account for refractive index dispersion”.
The contents of the compiled html (.chm) Help file accessible from Help menu are sufficient to enable most beginner-level MPC (or thin-film) designers to quickly learn the main features of program and its data representation formats. The following sections of present article describe these main features in detail, with examples provided to enable the productive and convenient use of this feature-rich software package.
2. Overview of package operation and key examples
derived from thin-film terminology for convenience only. M layers can optionally be modelled as magnetic dielectrics, in which case gyration value at the design wavelength (the imaginary part of the non-diagonal dielectric tensor component, or Im(xy)) needs to be entered into its relevant textbox. This imaginary component of the off-diagonal dielectric tensor element describes magnetic circular birefringence, manifesting as Faraday rotation of the polarisation plane in the transmitted or reflected light waves. The real part of this tensor component can be treated as zero, in most applications, unless the experimentally-measured value is known, which is related to characterising magnetic circular dichroism and polarisation state ellipticity effects. For applications requiring good numerical accuracy over broad spectral ranges, the spectral dispersion of both the gyration and the refractive indices of all relevant materials need to be loaded from .txt formatted data files, using the options within Extra Data menu. Optionally, H-type layers can be selected to also represent a magnetic dielectric, with the same off-diagonal dielectric tensor components as in M-type material (but optionally with different refractive index and absorption), in order to model a special physical situation in which an MPC has layer-specific magnetization reversal possibilities in some individual magnetic layers within structure. If M layers are modeled as non-magnetic (e.g. just implying medium-index dielectric layers), then both the real and imaginary parts of xy can be entered as zero values; however if a small gyration is still entered by error, it will not measurably distort the transmission or reflection spectral calculations; the results regarding the Faraday rotation spectra should in this case be ignored.
The details of the physical situation being modeled, in terms of incidence geometry, and the ways in which the transmitted (or reflected) light intensity is normalized with respect to the incident wave intensity, are defined using sets of checkboxes within a Menu entry “Incidence Geometry”, where the relevant descriptions are given. The incidence geometry settings defined as default are the ones used most often and generic in general, since these enable the convenient and accurate fitting of lab-measured transmission spectra in deposited film-substrate systems, to the corresponding theoretically-modeled spectra, where the effects of each interface (including the back surface of substrate) are correctly accounted for in the model. The only parameter not accounted for is the physical thickness of substrate, which is modeled as non-absorbing. Alternative settings for the incidence geometry are useful for considering more theoretical situations, such as calculations of the optical intensity transmitted into a semi-infinite substrate medium, or in reflection-mode calculations, where it is often necessary to compare reflected-wave intensities, which vary with the direction of incidence.
One of the most important material parameters in all layer types is the optical absorption coefficient at the design wavelength (entered in cm-1 into relevant textboxes; the corresponding extinction coefficients will then be
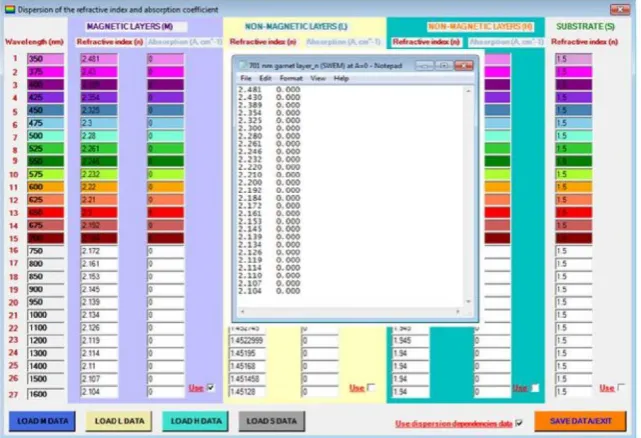
displayed after the film design is characterised by pressing the Compute formula button), especially for materials possessing significant spectral dependency in their optical absorption. For accurate characterisation of thin films or MPCs, ideally, every material should have its optical constants dataset available for loading from the Extra Data menu option “Account for refractive index dispersion” and loaded into the specialised Form (shown in Fig. 2) prior to calculations. Material-specific optical constants data files can be prepared using zeros entered in place of an unknown absorption coefficient, for the purposes of physical layer thickness fitting, based
Figure 2. Form dedicated to loading the optical constants data from text files prepared as shown, using the software-specific 27-row wavelength grid and containing the columns data for the refractive index and optical absorption coefficient (in cm-1) at each wavelength point
within the spectral grid.
Once the refractive index dispersion information is loaded from data file(s), the data in textboxes corresponding to the index and absorption at the design wavelength are no longer used in main spectral calculations, but used only for calculating the quarter-wave stack physical thickness in nm. For all wavelength points in-between the 27-point data grid, the values of refractive index and absorption are linearly interpolated from the nearest grid-located points. This can erroneously cause small spectral shifts appearing in the spectral locations of the transmission, reflection, or Faraday rotation peaks, seen away from the precise design wavelength, if the interpolated refractive index at that wavelength does not coincide with the value entered into front-panel textbox. This is not a significant issue for the experienced designers of MPC, once the origin of these possible small data errors is known or eliminated by entering precise (same as interpolated from the index dataset for the design wavelength) index data into front-panel textboxes. It is known apriori that the actual spectral response peak locations in quarter-wave stack-type designs will appear precisely at the design wavelengths, due to the nature of optical interference-related phenomena. In situations when the refractive index dispersion data are only available within a limited spectral interval of interest, rather than for all wavelengths in the 350–1600 nm range, it is recommended to enter the available refractive index data into the newly-generated data file. The refractive index and absorption coefficient values at other wavelengths still need to be entered. The recommended practice is as follows: if, for example, the available data starts from 500 nm, enter the same values as are known at 500 nm into the wavelength grid positions for all shorter wavelengths; alternatively use any available models to predict the unknown values (e.g. Cauchy dispersion model). If the refractive indices or absorption are only available up to 800 nm, it is best to enter (for all larger wavelengths), the same (n, A) data as at the last data point (800 nm).
2.1. Multi-defect multilayer MPC characterisation and optimisation examples suitable for validating calculations
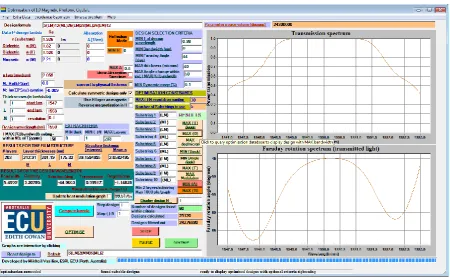
To illustrate the suitability of software to correctly calculate the spectral responses of complex, multi-defect MPC designs, it is easiest to use the design or optimisation examples described in the published literature, e.g. [11] and [22]. One of the common goals of optimising the MPC structures has been to achieve strong spectral peaks in either the transmission or reflection (ideally approaching 100%), coincident spectrally with peaks of enhanced Faraday rotation, in either the transmission or reflection-mode operation, and ideally approaching 45° - if efficient modulation of light intensity is required. It is important to note that Faraday rotation in the reflected wave is different in its physical nature from Kerr rotation [5] (even though there may exist some terminological misinterpretations, even in the published literature); this program calculates only the angles of polarisation-plane rotation due to Faraday effect, in either geometry, and does not account for Kerr effect. Figure 3 presents a graphical summary of the input parameters needed to be entered into relevant textboxes to evaluate one remarkable MPC design from published literature [11], as well as the results of calculations. The practical implementation of this MPC design can be expected to be difficult, due to factors such as extremely high number of layers, large total thickness, the expected non-zero (but possibly well below about 0.1 cm -1) optical absorption coefficient in garnets at 1550 nm, as well as scattering effects expected to occur at multiple layer boundaries. From the theoretical insight perspective, this high-performance MPC design is still an outstanding example of MPC application potential, especially in systems using optimised surrounding media, index-matched to the mean refractive index of structure. A .mpc file (MPC Design from JLT Vol. 19 No. 12 p. 1964.mpc) is included in the subfolder “Optimisation results files” of the program installation directory, and can be loaded from the File menu, enabling easy re-calculation of the contents of Fig. 3, using pre-loaded design data. The way this MPC has been modelled also involves the customised Incidence Geometry settings, where film-side incidence is modeled, without normalising the transmitted intensity after the substrate. Rather, transmission into the substrate material is modelled, and this is why the modeled transmission within 1550 nm peak closely approaches 100%. Running MPC Optimisation algorithm, on the other hand, requires using substrate-side incidence geometry settings only.
Fig. 3. MPC optimisation software used to reproduce the flat-top MPC transmission and Faraday rotation spectral properties for a 4defect design reported in [11]. The calculated graphs (obtained after entering the design data and pressing the Compute formula button) reproduce the data originally presented graphically in Fig. 3(b) of Ref. 11.
All materials-related data values were used as per description in Ref. 11, and the data in the calculated graphs reproduce the results presented in Fig. 3(b) in Ref. 11 with precision.
more difficult with the reducing design wavelength. Across the visible spectral range, the optical absorption in bismuth-substituted iron garnet materials becomes the limiting factor, placing stringent limits on the achievable MPC performance characteristics, regardless of their intended application area or the design type. Therefore, the ability to generate and compare multiple and differently-structured optimised MPC designs is crucial for achieving the best possible performance characteristics, limited only by the fundamental, materials-related constraints.
In order to directly reproduce the optimisation result reported in [11], by way of running constrained optimisation algorithm using the MPC Optimisation software, the materials-related datasets and a set of optimisation constraints as shown in Figure 4 must be used prior to clicking “Optimise” button. It is also necessary to set the substrate-side incidence geometry, and uncheck the second checkbox related to the way the transmitted intensity is normalised. The “flat-top” optimised MPC design will be retrieved from the database of calculated MPC designs within the set of defined criteria (60 different designs will be found to fit these overall criteria and constraints, as set per data of Fig. 4), by selecting the design with maximised spectral response bandwidth. This is done by pressing MAX (B) button. Importantly, all design substrings must be entered as per Fig. 4 to reproduce this optimisation result, with precisely 5 substrings and maximum 30 entered for the substring-repetition index. Another constraint which needs to be entered relates to the maximum allowed layer number being 203; checkbox “Calculate symmetric designs only” needs to be checked, and it is best to set the spectral resolution to 1 nm during optimisation, followed by changing it to 0.1 nm for calculating the spectral properties more accurately. The optimised design equivalent to the design of Fig. 3 (and Ref. 11) is retrieved from 60 possible designs found within criteria, by pressing the MAX (B) button. This retrieves the design with maximised full width at half maximum (FWHM) bandwidth, according to the data entered into the TMAX(%) textbox.
Fig. 4. Optimised “Flat-top” high-performance MPC design reproduced by running MPC Optimisation algorithm, using checkbox “Calculate symmetric designs only” for speeding up calculations. The exact 4-defect MPC design reported in [11] (Fig. 3(b) of Ref. 11) is shown after selecting the design with maximum spectral response bandwidth from the 60 possible MPC designs found to be within optimisation criteria and constrains, as shown.
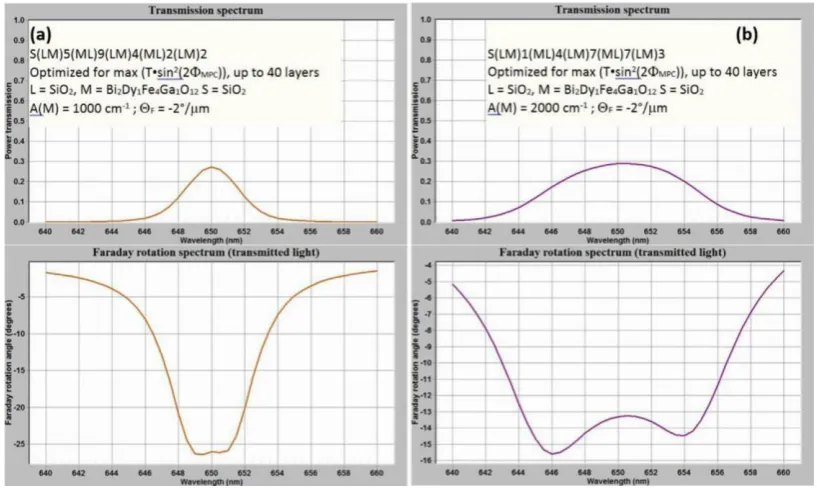
Figure 5 shows a graphic summary of MPC optimisation results first reported in [22], which illustrate the current performance limits of MPC designs aimed at developing transmission-mode magneto-optic light intensity modulators working at near 650 nm. The optical and MO material parameters relevant to
Bi2Dy1Fe4Ga1O12 and similar highly bismuth-substituted nanocrystalline garnet materials (synthesized by techniques such as RF sputtering) were used in the calculations. The graphical information is reproduced from Ref. 22.
Fig. 5. Calculated spectral performance parameters for multi-defect (4-defect structures, having up to 40 total layers) MPCs optimized by exhaustive computation to achieve a maximum light intensity modulation capability (maximized value of parameter (T·sin2(2Ф
MPC))), for n(M) = 2.376, n(L) = 1.458, and using two different optical absorption coefficients for magnetic material at
650 nm (a) = 1000 cm−1; (b) = 2000 cm−1. These refractive index and absorption coefficients were considered constant within
the design-specific wavelength region, as well as gyration (-0.02), corresponding to approximately 2 °/m near 650 nm.
The data of Fig. 5 can be reproduced by running optimisation of 4-defect structures with up to 40 layers and thickness up to 5 m, composed of five sequenced (LM) and (ML) substrings, as shown, using default entered n(L) value and n(M) = 2.376. The gyration value corresponding to 2 °/m needs to be entered as -0.02 for wavelengths near 650 nm, accounting for the composition-specific sign of Faraday rotation, which is defined by convention reported in [5] and other sources. Maximum repetition index value can be set to either 10 or e.g. 12, prior to running the optimisation with either absorption coefficient.
The results shown in Fig. 5 illustrate clearly that the optical absorption is the limiting factor in visible-range MPC design, even at long-wavelength red wavelengths, where the absorption is still moderate, and the thin constituent garnet layers used within MPC would have been almost visually clear. This can be demonstrated by entering a design string such as SM[68.39] into design formula textbox, and running absorption-mode calculation, (e.g. using
= 2000 cm −1), to reveal by zooming the graph area with mouse, that individual MO layers absorb only about 1.2% of the incident power on each single-pass transmission).
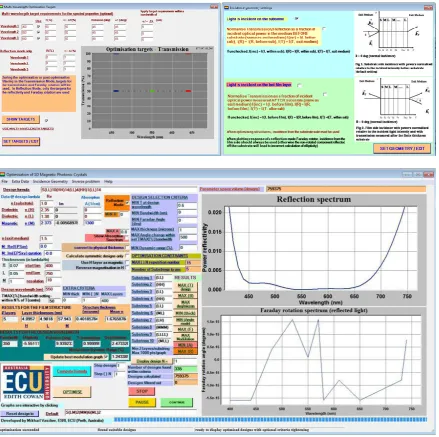
2.2. Generating optimised antireflector film designs using spectral target points
6. Selecting the design with maximum transmission at the design wavelength (either after running the optimisation, or simply after loading the relevant example file) will reveal the reflection spectrum as shown.
Fig. 6. Example of menu and algorithm settings required to generate a number of optimised 5-layer antireflector film designs on a glass substrate. The optical materials (ZnS and MgF2) are presumed to possess constant refractive indices and zero absorption across the entire
visible spectrum in this example.
This example also demonstrates the use of scaled QWOT layers for use in thin substrings, the thickness of which is then being optimised by the algorithm by adjusting the repetition indices. The calculation of more than 750000 designs should still take only a few minutes. A number of antireflector-type designs can be revealed by using the button “display design N=” with any corresponding number not exceeding the number of designs found within criteria.
Since the optimisation algorithm presumes the substrate-side incidence, it is convenient to define air as subtrate, and set the exit medium to glass. The obtained design S(LL)10(HH)14(LL)4(HH)1(LL)14 needs to have its deposition sequence reversed; and be re-evaluated for the film-side incidence case from air; using the physical thickness notation is preferable in this case, i.e. the design needs to be changed into S(LL)14(HH)1(LL)4(HH)14(LL)10.
(air) in this case. The incidence geometry settings can now be checked to correspond to the film-side incidence. Note the way the reflectivity of the back side of the substrate is accounted for in the detailed incidence geometry settings.
2.3. Fitting of the measured thin-film transmission spectra to theoretical models
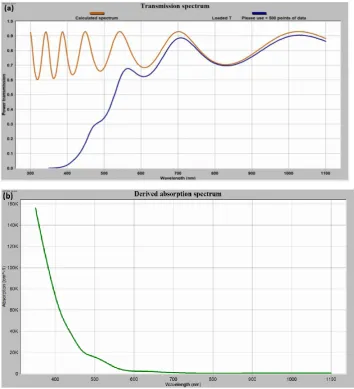
Fig. 7. Magneto-photonic crystal (MPC) software fitted transmission spectra of different thin film garnet layers; (a) annealed garnet sample of composition type Bi0.9Lu1.85Y0.25Fe4.0Ga1O12 and thickness 684 nm, (b) as-deposited garnet sample of the same composition but from
another batch, of thickness 1310 nm.
If the spectral dependency of the film material absorption coefficient is completely unknown (or the data are not reliable), but the dispersion of its refractive index is well-known (e.g. from variable-angle spectroscopic ellipsometry data), then the index dispersion data files need to be prepared with zero values entered for all absorption coefficients. These data file still enable, in many cases, very reliable fitting of the physical thickness. It is highly recommended to then back up these thickness fitting results by also applying Swanepoel method-based techniques e.g. methods reported in [23].
2.4. Fitting of the absorption coefficient spectra in single-layer films of known refractive index dispersion function, transmission spectrum, and thickness
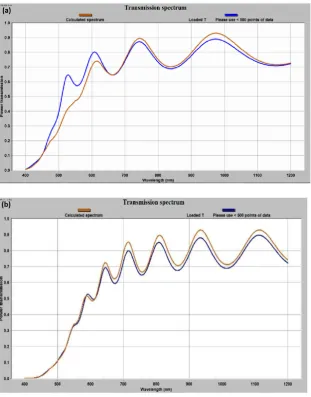
Figure 8 illustrates the results of physical thickness and absorption fitting procedures obtained using a transmission file of a 481 nm thick Bi0.9Lu1.85Y0.25Fe4.0Ga1O12 as-deposited film on a glass substrate, and the corresponding material’s “zero-absorption” refractive index data file, both of which are included with program distribution into the corresponding subdirectories of the installation folder. The data file named 701 nm Bi0.9Lu1.85Y0.25Fe4Ga1O12 garnet layer_n (SWEM) at A=0.txt must be loaded using “load M data” button and the subfolder corresponding to this material type (we previously characterised the refractive index of a 701 nm thick film of this material). After the best fitted thickness value (481 nm) is obtained by comparing different models of design string, such as SM[450], ….etc. SM[481], the same design string must be re-entered using a quarterwave thickness notation, e.g. S(MM)3, where the QWOT multiplier for M thickness is set to 1.125 (for n(M) = 2.21, corresponding to the nearest index data point to the default 630 nm), to match the physical thickness of 481 nm in this notation. The textbox “structure thickness (microns)” must be used to check the physical thickness changes in response to changing either the (MM)N repetition index, or the QWOT multiplier for M layers. The index n(M) = 2.21 should be entered into its corresponding textbox, after looking up the 630 nm (default design wavelength) data for the actual refractive index, to avoid possible misrepresentations of QWOT data. This notation conversion is required for running the absorption coefficient fitting algorithm, as well as using M-type layers only – regardless of whether the material possesses any magnetic properties or not.
Once within the “derive absorption spectrum” submenu, the same measured transmission file should again be re-loaded onto the graph from file, followed by a relatively self-explanatory procedure for deriving the graph of absorption spectrum. No changes are usually required in any other textboxes. The result of fitting procedure with the above-described data files is shown in Fig 8(b).
Fig. 8. Iterative (bisection algorithm-assisted) fitting of the absorption coefficient spectral dependency and the required pre-fitting of film thickness through matching transmission peak features. (a) Peak-aligned transmission spectrum pre-fitting result, from which the physical film thickness information and the measured dataset on the refractive index dispersion are then used, within the option available in the “Inverse Problem” menu, to derive the absorption coefficient data; (b) the algorithm-derived (fitted) absorption coefficient spectrum (, cm-1) for 481nm-thick as-deposited Bi
0.9Lu1.85Y0.25Fe4.0Ga1O12 garnet-precursor film sample on a glass
In the cases when the fitting algorithm produces exceptions such as described within a dialog box text, e.g. “ At some or all wavelengths, even at zero absorption in M layers, the transmission of this structure should be less than specified”, adjustments can be made to either check that the incidence geometry settings are correct, or the refractive index of the substrate can be increased in the model, removing these fitting procedure errors. In cases when these issues persist in the low-absorption wavelength ranges, the wavelength range of the model can be reduced to include only the regions where the fit results can be obtained. Non-uniformities in real thin films can lead to reduced refractive index values, leading then to reductions in the modeled reflection, thus showing increased transmission at some wavelengths compared to theory models.
After the absorption spectrum fitting procedure has been completed, the plotted data points can be exported into other formats, or saved in the data files using the options provided.
3. Installation
Installation of MPC Optimisation software is easy, and enabled by running the installer (.msi) file supplied within the .zip archived folder used for program redistribution. A necessary pre-requisite to program installation is Microsoft .NET Framework 1.1, which must be installed onto any Windows machine prior to running the MPC Optimisation installer. The .NET 1.1 Framework installation file (dotnetfx.exe) is supplied within the archived folder file used to redistribute MPC Optimisation. No known problems have so far been identified to exist in relation to installing this older version of .NET Framework onto modern computer systems. A number of example data files containing the samples of measured garnet thin film transmission spectra and files containing the data on the refractive index and absorption coefficient spectra of various garnets and other optical materials are placed into the selected program installation folder on installation. These data enable the users to re-create the example calculations presented within this article, and therefore are useful in mastering the software operation.
4. Code-related information
The program has been written as Microsoft Visual Studio .NET 2003 Solution, composed of three Projects: (i) Class Library project written using Managed C++ code, and built as .dll class library providing matrix-related computation functions; (ii) main program project, written using Visual C# and implemented as Windows Forms project; and (iii) deployment project, used for including the necessary reference assemblies, class libraries, license files, organising the file system structure within the installation directory, and generating the Installer files for program distribution. Installed MPC Optimisation program can run on any Windows system architecture, whether 32-bit or 64-bit, regardless of processor type.
Two main third-party software components have been embedded into the program structure, for which the necessary developer licenses have been purchased commercially. Bluebit Matrix Library 2.2 has been used to provide classes that enable efficient complex-valued 4x4 matrix operations functionality. The Class Library .dll assembly referencing the Bluebit Matrix Library assembly has been required, through the terms of developer grade matrix software license, to be compiled as signed assembly, using a strong-name assembly key file, which is not allowed for re-distribution by the developers. The second embedded component was GigaSoft ProEssentials 5 .NET package, which has been installed on the developer’s computer to provide ActiveX controls that enable scientific-type graphing output functions. The assemblies GigaSoft.ProEssentials.dll and Pegrpcl.dll are referenced by the C# project, embedding the scientific graphing controls as Microsoft Component Object Model (COM) objects into the structure of Windows Forms project-related software assemblies. The use of licensed third-party software components, with the associated restrictions, is the primary reason why MPC Optimisation program code is not intended for open-source distribution. Additionally, newer versions of Bluebit Matrix Library designed to work with present-day versions of .NET Framework, as well as significant code syntax changes applied throughout the projects, would have been required to successfully port the Solution into current versions of Visual Studio, e.g. VS2015 or VS2017.
5. Conclusions
In summary, a software package has been described, designed to enable the design and optimization of 1D magnetic photonic crystals in terms of the achievable combinations of Faraday rotation, transmission and reflection spectra. The same package allows computational modelling of the optical spectral properties of various dielectrics-based generic single- and multilayer thin films. Additional program features include the tools for fitting of the experimentally-measured transmission or reflection spectra to theoretical models, allowing the film physical thickness data recovery, if detailed refractive index information is available. Fitting of the absorption coefficient spectra in absorbing material layers is possible, using an automated algorithm reliant on the data for the measured transmission spectrum, refractive index spectrum, and physical thickness.
Notes
The authors declare no competing financial interest.
Acknowledgments
This work was supported by Edith Cowan University.
References
[1] S. Kharratian, H. Urey, and M. C. Onbaşlı, RGB magnetophotonic crystals for high-contrast magnetooptical spatial light modulators, Sci.Rep. 9:644, DOI:10.1038/s41598-018-37317-9, 2019.
[2] Q. Du, T. Fakhrul, Y. Zhang, J. Hu, and C. A. Ross, Monolithic magneto-optical oxide thin films for on-chip optical isolation, MRS Bulletin, vol. 43, 413-418, 2018.
[3] Y. Shoji, and T. Mizumoto, Silicon waveguide optical isolator with directly bonded magneto-optical garnet, Appl. Sci., 9, 609; doi:10.3390/app9030609, 2019.
[4] E. Jakubisova-Liskova, S. Visnovsky, H. Chang, and M. Wu, Optical spectroscopy of sputtered nanometer-thick yttrium iron garnet films, J. Appl. Phys. 117, 17B702; doi: 10.1063/1.4906526, 2015.
[5] A. K. Zvezdin, V.A. Kotov, Modern magnetooptics and magnetooptical materials, Institute of Physics Publishing, Bristol and Philadelphia, 1997 (ISBN075030362X).
[6] S. M. Drezdzon, T. Yoshie, On-chip waveguide isolator based on bismuth iron garnet operating via nonreciprocal single-mode cutoff, Opt. Express, Vol. 17, no. 11, 9276-9281, 2009.
[7] A. Stupakiewicz, K. Szerenos, M.D. Davydova, K.A. Zvezdin, A.K. Zvezdin, A. Kirilyuk, and A.V. Kimel, Selection rules for all-optical magnetic recording in iron garnet, Nat. Commun. (2019) 10:612; https://doi.org/10.1038/s41467-019-08458-w, 2019.
[8] M. Inoue and T. Fujii, “A theoretical analysis of magneto-optical Faraday effect of YIG films with random multilayer structures,” J. Appl. Phys., vol. 81, no. 8, pp. 5659–5661, 1997.
[9] S. Sakaguchi and N. Sugimoto, “Transmission properties of multilayer films composed of magneto-optical and dielectric materials,” J. Lightwave. Technol., vol. 17, no. 6, pp. 1087–1092, 1999.
[10]M. J. Steel, M. Levy, and R. M. Osgood, “High transmission enhanced Faraday rotation in one-dimensional photonic crystals with defects,” IEEE Photon. Technol. Lett., vol. 12, no. 9, pp. 1171–1173, 2000.
[11]M. Levy, H. C. Yang, M. J. Steel, and J. Fujita, “Flat-top response in one-dimensional magnetic photonic bandgap structures with Faraday rotation enhancement,” J. Lightw. Technol., vol. 19, no. 12, pp. 1964–1969, 2001.
[12]H. Kato, T. Matsushita, A. Takayama, M. Egawa, K. Nishimura, and M. Inoue, “Properties of one-dimensional magnetophotonic crystals for use in optical isolator devices,” IEEE Trans. Magn., vol. 38, no. 5, pp. 3246–3248, 2002.
[13]H. Kato et al., “Effect of optical losses on optical and magneto-optical properties of one-dimensional magnetophotonic crystals for use in optical isolator devices,” Opt. Commun., vol. 219, no. 1–6, pp. 271–276, 2003.
[14]A. K. Zvezdin and V. I. Belotelov, “Magnetooptical properties of photonic crystals,” Eur. Phys. J. B, vol. 37, no. 4, pp. 479–487, 2004. [15]A. Brataas, A. D. Kent, and H. Ohno, Current-induced torques in magnetic materials, Nature Materials, vol. 11, no. 5, pp. 372–381, 2012.
[16]S. Kahl,“Bismuth iron garnet films for magneto-optical photonic crystals,” Ph.D. dissertation, Dept. Condensed Matter Physics/KTH, Royal Inst. Technol., Stockholm, Sweden, 2004, Ch. 6.
[17]V. I. Belotelov and A. K. Zvezdin, “Magneto-optical properties of photonic crystals,” J. Opt. Soc. Amer. B, Opt. Phys., vol. 22, no. 1, p. 286, 2005.
[18]M. Vasiliev, K.E. Alameh, V.I. Belotelov, V.A. Kotov and A.K. Zvezdin, Magnetic photonic crystals: 1-D optimization and applications for the integrated optics devices, IEEE J. Lightwave Technol. 24 (2006), 2156-2162.
[19]M. Vasiliev, M. Nur-E-Alam, V.A. Kotov, K. Alameh, V. I. Belotelov, V. I. Burkov and A. K. Zvezdin, RF magnetron sputtered (BiDy)3(FeGa)5O12:Bi2O3 composite materials possessing record magneto-optic quality in the visible spectral region, Optics Express,
17(2009), 19519-19535.
[20]M. Nur-E-Alam, M. Vasiliev and K. Alameh, Nano-structured magnetic photonic crystals for magneto-optic polarization controllers at the communication-band wavelengths, Opt. Quant. Electron. 41(2009), 661-669.
[21]M. Nur-E-Alam, M. Vasiliev and K. Alameh, High-performance RF-sputtered Bi-substituted iron garnet thin films with almost in-plane magnetization, Optical Materials Express 7(2017), 67.
[22]V.A. Kotov, V.G. Shavrov, M. Vasiliev, K. Alameh, M. Nur-E-Alam, D.E. Balabanov, Properties of magnetic photonic crystals in the visible spectral region and their performance limitations, Photonics and Nanostructures – Fundamentals and Applications, 28 (2018) 12– 19.
[23] M. Nur-E-Alam, M.Vasiliev, V. Belotelov and K. Alameh, Properties of ferrite garnet (Bi, Lu, Y)3(Fe, Ga)5O12 thin film materials
![Fig. 3. MPC optimisation software used to reproduce the flat-top MPC transmission and Faraday rotation spectral properties for a 4defect design reported in [11]](https://thumb-us.123doks.com/thumbv2/123dok_us/8006055.1330332/6.595.72.524.381.655/optimisation-software-reproduce-transmission-faraday-spectral-properties-reported.webp)