International Journal of Nanomedicine
Dove
press
O r I g I N A L r e s e A r c h
open access to scientific and medical research
Open Access Full Text Article
Influence of surface charge on the potential
toxicity of PLgA nanoparticles towards
calu-3 cells
simona Mura1,2
herve hillaireau1,2
Julien Nicolas1,2
Benjamin Le Droumaguet1,2
claire gueutin1,2
sandrine Zanna3
Nicolas Tsapis1,2
elias Fattal1,2
1Univ Paris-sud, UMr 8612, châtenay Malabry, F-92296; 2cNrs, châtenay Malabry, F-92296; 3Laboratoire de Physico-chimie des surfaces, cNrs-eNscP (UMr 7045), ecole Nationale superiore de chimie de Paris, France
correspondence: elias Fattal Univ Paris-sud, Laboratoire de Physico-chimie, Pharmacotechnie et Biopharmacie, UMr cNrs 8612, Faculté de Pharmacie, 5 rue Jean-Baptiste clément, F-92296 châtenay Malabry cedex, France
Tel +33 1 46 83 55 82 Fax +33 1 46 83 59 46 email [email protected]
Background: Because of the described hazards related to inhalation of manufactured nanoparticles, we investigated the lung toxicity of biodegradable poly (lactide-co-glycolide) (PLGA) nanoparticles displaying various surface properties on human bronchial Calu-3 cells.
Methods: Positively and negatively charged as well as neutral nanoparticles were tailored by coating their surface with chitosan, Poloxamer, or poly (vinyl alcohol), respectively. Nanoparticles were characterized in terms of size, zeta potential, and surface chemical composition, confirming modifications provided by hydrophilic polymers.
Results: Although nanoparticle internalization by lung cells was clearly demonstrated, the cytotoxicity of the nanoparticles was very limited, with an absence of inflammatory response, regardless of the surface properties of the PLGA nanoparticles.
Conclusion: These in vitro results highlight the safety of biodegradable PLGA nanoparticles in the bronchial epithelium and provide initial data on their potential effects and the risks associ-ated with their use as nanomedicines.
Keywords: nanoparticles, PLGA, surface properties, Calu-3, toxicity, inflammation
Introduction
Most of the studies that have investigated the toxic effects of nanoparticles on the lungs have focused on inorganic nanoparticles, such as carbon nanotubes, fullerenes, and silica and metal nanoparticles, as well as urban particulate matter.1–3 The
harm-ful effects observed for these nanoparticles were correlated with common biological mechanisms, eg, inflammation and oxidative stress. Indeed, both carbon nanotubes and urban particulate matter are responsible for the activation of proinflammatory pathways in macrophages, with robust acute inflammatory responses leading to a rapid onset of chronic lung fibrosis, extensive granulomas, and other pathologies.3–6 Moreover, these
systems, as well as metal and silica nanoparticles, induce oxidative stress associated with an increase in reactive oxygen species production and the expression of antioxi-dant enzymes.7,8 It has been further shown that the toxicological profile and biological
response to the different nanoparticles are closely correlated with their physicochemi-cal properties because, for instance, amorphous silica nanoparticles have a different toxicity profile compared with the crystalline ones.9 Finally, it has been reported that
simple addition of a thin silica layer on different stable, inert, and nontoxic crystalline polymorphs of titanium oxide leads to an increase in cytotoxicity.10
Although these results have raised suspicions about the potential lung toxicity of nanoparticles, various nanoscale systems made of biodegradable polymers or lipids have been applied to the formulation of nanomedicines designed for the pulmonary
International Journal of Nanomedicine downloaded from https://www.dovepress.com/ by 118.70.13.36 on 23-Aug-2020
For personal use only.
Number of times this article has been viewed
This article was published in the following Dove Press journal: International Journal of Nanomedicine
Dovepress Mura et al
route of administration. Lung delivery of nanomedicines represents a suitable alternative to parenteral administra-tion since it allows the administraadministra-tion of fragile and poorly absorbed molecules.11–14 Nanoparticles are highly
bioavail-able after lung administration since they are well retained in situ and only weakly taken up by alveolar macrophages, providing their diameter is around 250 nm.15 Recent studies
have demonstrated the impressive potential of biodegradable nanoparticles for lung delivery of salbutamol.16 However, in
contrast with inorganic nanoparticles, the lung toxicity of biodegradable nanoparticles has not been extensively investi-gated in the literature. Most studies have assumed that due to their biodegradability, these nanoparticles do not lead to side effects or toxicity. However, previous results from our group contrast with this general view. Indeed, despite their biode-gradability, specific risks might arise from the nanoparticle form itself. It has been demonstrated that, after intravenous administration, biodegradable polyalkylcyanoacrylate or poly (lactide-co-glycolide) (PLGA) nanoparticles can trigger inflammation and, in the case of poly (alkylcyanoacrylate), oxidative stress during both acute and chronic treatments.17–19
However, these effects were reversible after interruption of the treatment, which was not the case for non-biodegradable polystyrene nanoparticles. Nevertheless, the question about a similar deleterious effect on the lung remains open, and the goal of the present paper is to answer this question.
Several in vitro models have been developed to study the potential toxicity of inhaled materials, and most studies have been carried out on the A549 cell line which is repre-sentative of the alveolar epithelial barrier.20,21 Surprisingly,
only a small number of studies has been performed on the Calu-3 cell line which is representative of the bronchial epi-thelial barrier. Calu-3 cells derive from a human bronchial adenocarcinoma and maintain the properties of the original submucosal glands, which are involved in the secretion of airway mucus components and mediators of the inflamma-tory response.22,23 Given that bronchial epithelial cells will
be the first to be met by inhaled nanoparticles, we considered the Calu-3 cell line to be an interesting model to investigate the potential toxicity of nanomedicines.
Basic toxicological evaluation of PLGA nanoparticles loaded with various drugs has been carried out24,25 and, in a
recent study, the genotoxicity of such nanoparticles has been investigated. In that report, no adverse effect was observed.26
However, since the genotoxic potential of nanoparticles is strongly dependent on their surface properties,27 the role of
nanoparticle surface chemistry and surface charge on their in vitro toxicity needed to be investigated thoroughly. In the
present work, we have designed three types of surface-modified nanoparticles, ie, positively and negatively charged as well as neutral, and performed a direct comparison of the various surface coatings. Among the wide variety of available biode-gradable polymers, we have chosen to formulate nanoparticles with PLGA, which represents one of the most commonly used biodegradable and biocompatible polymers involved in the formulation of nanomedicines.28,29 Nanoparticle surface
chemistry and surface charge were then tuned by varying the nature of the stabilizer in the formulation. The in vitro cyto-toxicity, cellular uptake, and inflammatory response induced by the different nanoparticles were all assessed using the Calu-3-based model of lung epithelium.
Material and methods
chemicals
PLGA (75:25 Resomer® RG756 and 50:50 Resomer RG503H)
were purchased from Boehringer-Ingelheim (Ingelheim, Germany). Polyvinyl alcohol (PVA, 87%–89% hydrolyzed, molecular weight 30–70 kDa), and 4-dimethylaminopyridine (99%) were obtained from Sigma Aldrich (Lyon, France).
N,N′-dicyclohexylcarbodiimide (.99%) was purchased from Fluka (Paris, France). Rhodamine B alcohol was synthesized as described elsewhere.30 Mowiol® 4-88 PVA (molecular
weight 30 kDa) was a gift from Kuraray Specialities Europe GmbH (Frankfurt, Germany). Ultrapure chitosan chloride (CS, Protasan® UP CL113, 75%–90% deacetylation,
molecular weight 50–150 kDa) was purchased from NovaMatrix (FMC BioPolymer, Drammen, Norway). Poloxamer 188 (commercially named Pluronic F68 [PF68]) was purchased from BASF (Levallois Perret, France). All the solvents were provided at the highest grade by Carlo Erba (Milan, Italy). Water was purified using a Synergy (Millipore, Molsheim, France).
synthesis of rhodamine-tagged poly
(lactide-co-glycolide)
A rhodamine B tertiary amide bearing a hydroxyl group30
was linked to PLGA (Resomer RG503H) by a N,N′ -dicyclohexylcarbodiimide-assisted coupling reaction. The rhodamine B coupling reaction was performed as follows. In a round-bottomed flask, rhodamine B alcohol (105 mg, 0.17 × 10⁻³ mol) and PLGA (500 mg, 4.2 × 10⁻⁵
mol) were dissolved in dichloromethane (50 mL). The resulting solution was bubbled for 30 minutes with N2 while cooling to 0°C in an iced water bath. A solution of N,N′-dicyclohexylcarbodiimide (36 mg, 0.17 × 10⁻³
mol) and a catalytic amount of 4-dimethylaminopyridine
International Journal of Nanomedicine downloaded from https://www.dovepress.com/ by 118.70.13.36 on 23-Aug-2020
Dovepress Toxicity of PLgA nanoparticles to calu-3 cells
in dichloromethane (10 mL) was added dropwise over 20 minutes at 0°C under N2. The reaction mixture was allowed to warm to room temperature and then stirred for 72 hours in the dark. The mother liquors were then concen-trated, dissolved in a minimal amount of dichloromethane, and precipitated first in a large volume of cold diethyl ether and then in water. The precipitate of rhodamine B (Rhod)-PLGA was filtered and dried under high vacuum, leading to 425 mg of pure product as purple crystals (85% yield).
The coupling reaction yield was determined by ultraviolet-visible spectroscopy. A precisely weighed amount of rhodamine B alcohol was dissolved in 10 mL of CHCl3. From this mother solution, dilutions were performed in the concentration range of 0.4 to 8 µM. The calibration curve was obtained by recording the absorbance of these different solutions at 563 nm. Finally, 10 mg of the Rhod-PLGA was dissolved into 5 mL of CHCl3, and the concentration of the solution was adjusted to an accurate precise value. The absor-bance at 563 nm of this Rhod-PLGA solution was measured by ultraviolet-visible spectroscopy and the value was com-pared with the theoretical one obtained from the calibration curve. The coupling yield was determined to be 25%.
Preparation of nanoparticles
Nanoparticles with different surface properties were pre-pared by the solvent emulsion evaporation technique.31
Neutral nanoparticles (PLGA/PVA nanoparticles) were prepared by dissolving 100 mg of PLGA (Resomer RG756) in 5 mL of a dichloromethane/acetone (1/1 v/v) mixture. This organic solution was pre-emulsified with 20 mL of a 0.25% (w/v) PVA (molecular weight 30–70 kDa) aqueous solution by vortexing for one minute. The pre-emulsion was kept on ice and sonicated for one minute using a VibraCell sonicator (Fisher Scientific, Illkirch, France) at 40% power. As for the positively-charged nanoparticles (PLGA/CS nanoparticles), the organic solution of PLGA was pre-emulsified with a 0.6% (w/v) aqueous CS solution containing 0.5% (w/v) of Mowiol 4-88 PVA by vortexing for one minute. This pre-emulsion was kept on ice and sonicated for 2 minutes using a VibraCell sonicator at 40% power. Then, for both the neutral and positively charged nanoparticles, the organic phase was allowed to evaporate at room temperature with magnetic stirring (600 rpm). Nanoparticle dispersion was then com-pleted to 20 mL. The excess of stabilizers was removed by centrifugation of nanoparticles at 37,000 × g for one hour at 4°C, and the pellet of nanoparticles was resuspended in ultrapure water. Negatively charged nanoparticles (PLGA/ PF68 nanoparticles) were prepared using PF68 as stabilizer.
PLGA was dissolved in 10 mL of ethyl acetate and added drop wise into 20 mL of a 1% (w/v) aqueous solution of PF68 under vigorous magnetic stirring. The pre-emulsion was vortexed for one minute and then sonicated for another minute using a VibraCell sonicator at 40% power. Water (20 mL) was added to the emulsion, in order to promote diffusion of the organic solvent into the external phase, leading to formation of the nanoparticles. The organic phase was allowed to evaporate at room temperature with magnetic stirring (600 rpm). Rhodamine-tagged nanoparticles were prepared as described earlier by dissolving a 70/30% (w/w) mixture of PLGA (Resomer RG756) and Rhod-PLGA, in the organic solvent.
Nanoparticle size and zeta potential
measurements
Nanoparticle average diameter was measured by dynamic light scattering with a Nano ZS (Malvern Instruments, Worcester-shire, UK) with a 173° scattering angle at a temperature of 25°C. Measurements were performed in triplicate following dilution of the nanoparticle dispersion in water. The surface charge of the nanoparticles was investigated by zeta potential measurement at 25°C, after dilution with NaCl 1 mM, using the Smoluchowski equation. The stability of the nanoparticles was investigated in water Ca2+ and Mg2+ free phosphate buf-fer (PBS, Lonza, Levallois-Perret, France) and cell culture medium (DMEM, Lonza) containing 10% (v/v) of fetal bovine serum (Lonza). Particle size distribution was measured at 0, 4, 24, 48, 72, and 96 hours after incubation at 37°C. Zeta potential in cell culture medium was measured according to the manufacturer’s instructions for measurement in high ionic strength media. Stability of the fluorescent labeling of nanoparticles was investigated by incubating Rhod-PLGA nanoparticles at 1 mg/mL in phosphate buffer at 37°C. At predetermined time intervals (8, 24, and 48 hours), an aliquot of the phosphate buffer medium was withdrawn and ultrafil-tered (Nanosep Centrifugal Devices 3 kDa, Pall Corporation, Port Washington, NY) at 14,000 × g over 60 minutes, after which the soluble degradation products were collected in the bottom chamber. The absorbance of the filtered solution was measured by ultraviolet-visible spectroscopy, and the results were expressed as a percentage of the initial rhodamine con-centration in the nanoparticle formulations.
Quantification of stabilizers associated
to nanoparticles
The amount of PVA and chitosan associated to the nanopar-ticles was indirectly measured by determining the concentration
International Journal of Nanomedicine downloaded from https://www.dovepress.com/ by 118.70.13.36 on 23-Aug-2020
Dovepress Mura et al
in the supernatant after centrifugation of the nanoparticles. The amount of PVA was determined by a spectroscopic method based on the formation of a green-colored complex between two adjacent hydroxyl groups of PVA and iodine in the presence of boric acid.32 After centrifugation of the PLGA/PVA
nano-particles, appropriate volumes of the supernatant were diluted with water to 5 mL. A further 3 mL of boric acid solution (3.8% w/v) and 0.6 mL of a 0.1 M iodine solution were added and the volume was completed to 10 mL with water. The absorbance of the final solution was measured at 640 nm using boric acid and aqueous iodine solution as a blank. A calibration curve was prepared using PVA concentrations in the 5–50 µg/mL range. Absorbance was not influenced by the molecular weight of PVA. The presence of chitosan affected the colorimetric reaction. Therefore, to avoid any interference, chitosan was precipitated at pH 10 using 1 M NaOH. Samples were centri-fuged at 12,100 × g for 5 minutes, and the supernatants were then analyzed to determine the PVA content. The formation
The amount of PF68 adsorbed onto the nanoparticles was determined according to equation 1:
N M I
M I M I
mg/g
lact lact glyc glyc
= ×
× PF68+ PF68 ×
695
0 75 0 25 2
/
. ( ) . ( / ) ××1000
(1)
in which Ilact is the peak integral of the −CH groups of the lactide unit (δ= 5.2 ppm) corresponding to one proton; Iglyc is the peak integral of the −CH groups of the glycolide unit (δ= 4.8 ppm) corresponding to two protons; and IPF68 is the peak integral of the −CH and CH2 groups of the PF68 (δ = 3.4 – 3.7 ppm) corresponding to 695 protons. Mlact, Mglyc, and MPF68 are the molecular weights of the lactide unit (72 g/mol), the glycolide unit (58 g/mol), and the PF68 (8350 g/mol) unit, respectively; 0.75 and 0.25 represent the percentage weight of the lactide and glycolide units in the PLGA used.
For the Rhod-PLGA nanoparticles, equation 1 was modi-fied as follows:
of an ionic complex between the protonated chitosan amino groups and the sulfonic acid groups of Cibacron Brilliant Red®
was used to measure the concentration of chitosan in the super-natant after centrifugation of the PLGA/CS nanoparticles.33 In
this assay, 0.1 M glycine buffer was prepared by dissolving glycine (1.87 g) and sodium chloride (1.46 g) in water and adding HCl to obtain a final pH value of 3.2. The dye solution was prepared by diluting an aqueous dye solution (0.15% w/v) with glycine buffer up to a final concentration of 0.075 mg/ mL. Thereafter, 20 µL of each sample was diluted to 300 µL with glycine buffer, and 3 mL of dye solution was then added. The absorbance values were measured at 576 nm, using the buffer and dye solution as a blank. The calibration curve was prepared in the 0–38 µg/mL range. The presence of PVA in the supernatant did not affect the reaction.
The amount of Pluronic adsorbed onto the PLGA/PF68 nanoparticles was determined by 1H NMR following the
protocol described by Trimaille et al,34 with some
modifica-tions according to the different polymer used. PLGA/PF68 nanoparticles were centrifuged at 37,000 × g for one hour at 4°C and the pellet was freeze-dried. The powder was then dis-solved into deuterated chloroform, and 1H NMR analysis was
carried out using a 300 mHz Bruker Avance (Lyon, France).
(2)
In this equation, the use of PLGAs with different lactide/ glycolide ratios (PLGA 75/25 and Rhod-PLGA 50/50) and the molar percentage of the two polymers (0.363 and 0.637, respectively) has been considered.
Transmission electron microscopy
Transmission electron microscopy was performed using a Philips EM208 (Philips, Eindhoven, The Netherlands) oper-ating at 60 kV. The suspension of nanoparticles (1 mg/mL) was deposited onto copper grids covered with a formvar film (400 mesh) for 2 minutes. Negative staining (30 seconds) with phosphotungstic acid 1% or uranyl acetate 0.5% was performed to observe the PLGA/PVA and PLGA/PF68 nanoparticles or the PLGA/CS nanoparticles, respectively. The excess solution was blotted off using filter paper, and the grids were air dried before observation. Image acquisition was performed using a high-resolution camera, Advantage HR3/12GO4 (AMT-Hamamatsu).
surface analysis of particles
X-ray photoelectron spectroscopy was used to determine the surface composition of the nanoparticles. A Thermo Electron Escalab 250 spectrometer with monochromated
N M I
M I M I
mg/g
lact lact glyc g
= ×
× + ×
PF68 PF68695
0 363 0 75 0 25
/
. [ . ( ) . ( llyc/ )]2 0 637 0 75. [ . (Mlact Iglyc) 0 25. (Mglyc Iglyc/ )]2
1000
+ × + × ×
International Journal of Nanomedicine downloaded from https://www.dovepress.com/ by 118.70.13.36 on 23-Aug-2020
Dovepress Toxicity of PLgA nanoparticles to calu-3 cells
AlKα radiation (1486.6 eV) was used. The analyzer pass energy was 100 eV for survey spectra and 20 eV for high resolution spectra. The spectrometer was calibrated against Au 4f7/2 at 84.1 eV. O1 s and C1 s core levels were analyzed (Table S1). The photoelectron take-off angle (angle of the surface with the direction in which the photoelectrons are analyzed) was 90°. Curve fitting of the spectra was performed using Thermo Electron software. For calculation of the sur-face composition, the inelastic mean free paths calculated by Tanuma et al35 and photoemission cross-sections calculated
by Scofield were used.36
calu-3 cell line culture
The Calu-3 cell line was obtained from the American Tissue Type Collection (catalog number HTB-55) and maintained at 37°C and 5% CO2 in a humidified atmosphere. Cells were cultured in Dulbecco’s modified Eagle’s medium (DMEM, Lonza) supplemented with 50 U/mL penicillin, 50 U/mL streptomycin, and 10% fetal bovine serum (Lonza). The medium was changed every four days and cells were passed weekly at a 1/3 split ratio using Trypsine-EDTA (Lonza).
cell viability assay
The in vitro cytotoxicity of the nanoparticles was evaluated using the 3-[4,5-dimethylthiazol-2-yl]-3,5 diphenyl tetrazo-lium bromide (MTT) test. This assay depends on the cellular reductive capacity to metabolize the MTT to a highly colored formazan product. Cells were seeded in 200 µL of growth medium (1.25 × 10⁵ cells/mL) in 96-well plates (TPP, Zurich,
Switzerland) and preincubated for 24 hours to recover. Then, 100 µL of freshly prepared nanoparticle dispersions in fetal bovine serum-containing cell culture medium were added immediately after dilution to an appropriate concentration (0.03–5 mg/mL). The nanoparticle formulations were assayed for toxicity over 4, 24, and 72 hours of incubation. After the incubation period, 20 µL of a 5 mg/mL MTT solution in phosphate-buffered saline was added to each well. After 2 hours, the culture medium was gently aspirated and replaced by 200 µL of dimethyl sulfoxide (American Chemical Soci-ety grade, BioBasic Inc, Paris, France) in order to dissolve the formazan crystals. The absorbance of the solubilized dye, which correlates with the number of living cells, was measured with a microplate reader (LAB Systems Original Multiscan MS, Helsinki, Finland) at 570 nm. The percentage of viable cells in each well was calculated as the absorbance ratio between nanoparticle-treated and untreated control cells. Acrolein was used as the positive control at concentrations varying from 10−3 to 1 mM. The viability assay was used to
assess the cytotoxicity of the different stabilizers used for the preparation of the nanoparticles. Stabilizer solutions in cell culture medium were appropriately diluted to a concentra-tion corresponding to the amount present in the nanoparticle dispersion at a 1–5 mg/mL concentration range and incubated on the cells. The test was performed as described above.
confocal laser scanning microscopy
Confluent cells grown on six-well dishes were incubated for 24 hours with Rhod-PLGA nanoparticles at 200 µg/mL. The monolayers were then washed with phosphate buffer. In vitro imaging acquisition was performed on living cells using a confocal laser scanning microscope LSM 510 META (Zeiss, Oberkochen, Germany) equipped with a 1 mW helium neon laser and a Plan-Apochromat 63× objective lens (numerical aperture 1.40, oil immersion). Red fluorescence was collected with a long-pass 560 nm emission filter under a 543 nm exci-tation wavelength. The pinhole diameter was set at 104 µm. Stacks of images were collected every 0.8 µm along the z axis. Prior to observations, it was checked that the autofluo-rescence of Calu-3 cells was negligible under the acquisition settings and did not interfere with the fluorescence coming from the nanoparticles.
Nanoparticle uptake kinetics in calu-3
For the uptake studies, confluent cells were incubated with Rhod-PLGA nanoparticles at 200 µg/mL. At different time points (4, 12, and 24 hours) monolayers were washed and the cells were incubated with Trypsine-EDTA for 10 minutes. Cell dispersion was centrifuged at 100 × g for 10 minutes and the pellet was recovered in an appropriate volume of phosphate buffer. The amount of Rhod-PLGA nanoparticles taken up by the Calu-3 cells was measured using a FACSCalibur®
cell analyzer (Becton Dickinson, Franklin Lakes, NJ). The fluorescence emission was collected in the fluorescence-2 channel. Cellular debris were eliminated from the analysis using a gate on forward and side scatter. For each sample, 104 cells were analyzed. Experiments were performed in
triplicate. Data acquisition and analysis were performed using the software CellQuest Pro version 4.02 (BD Biosciences, San Diego, CA).
cytokine secretion from calu-3 exposed
to nanoparticles
Calu-3 cells were seeded in six-well dishes at a density of 106 cells per well in 1 mL culture medium and grown
until confluence. Confluent cells were refreshed with culture medium for 24 hours. The cells were then exposed
International Journal of Nanomedicine downloaded from https://www.dovepress.com/ by 118.70.13.36 on 23-Aug-2020
Dovepress Mura et al
to nanoparticles at 200 µg/mL or lipopolysaccharide at 10 µg/mL as a positive control. This concentration was found to be the minimal one ensuring a significant cytokine release after 24 hours of incubation. Unexposed cells were used as a negative control. Supernatants were collected at different intervals in time. Commercial enzyme-linked immunosorbent assay kits for interleukin-6 (IL-6), interleukin-8 (IL-8), and tumor necrosis factor alpha (TNFα) were used following the indications of the manufacturer (R&D Systems Europe Ltd, France).
statistical analysis
The differences between cells exposed to nanoparticles or the positive control and untreated cells were evaluated using a Student’s t-test. Statistical significance was indicated as
P , 0.05 or P , 0.01. The symbols used are reported in the legend for each figure.
Results
Design and characterization of PLGA
nanoparticles
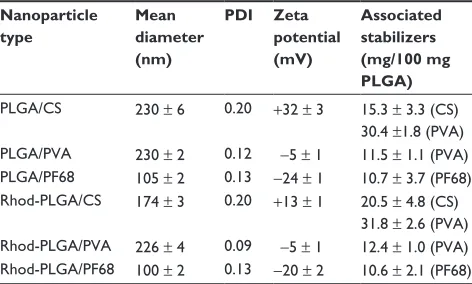
The nanoparticles were prepared according to an emulsion evaporation technique, as described in the Materials and methods section. As shown in Table 1, introduction of dif-ferent stabilizers allowed modification of the nanoparticle surface charge. One cationic stabilizer, ie, CS, was used as well as two neutral stabilizers, ie, partially hydrolyzed PVA and PF68. PLGA/PF68 nanoparticles had a mean diameter of 100 nm, while both PLGA/PVA and PLGA/CS nanopar-ticles were around 200 nm (Table 1). All formulations had a narrow size distribution, with a polydispersity index of 0.1–0.2 (Table 1). These results are in agreement with the transmission electron microscopic images (Figure 1) that
show spherical nanoparticles with a smooth surface. Zeta potential measurements confirmed that the stabilizers influ-ence nanoparticle surface charge. PLGA/CS nanoparticles exhibited a positive zeta potential (+32 ± 3 mV), whereas PLGA/PVA nanoparticles were almost neutral (−5 ± 1 mV), and PLGA/PF68 nanoparticles exhibited a negative zeta potential (−24 ± 1 mV), as shown in Table 1.
The presence of stabilizers on the nanoparticle surface was confirmed by x-ray photoelectron spectroscopy, where the spectra associated with each nanoparticle differed from the pure PLGA spectrum. Indeed, the fits of the C1 s and O1 s envelopes of PLGA nanoparticles showed peaks which were due to the simultaneous presence of both PLGA and stabilizer (supporting information, Table S1). The amount of stabilizers associated with the nanoparticle surface were quantified by spectrophotometric methods or 1H NMR
spec-troscopy. Between 10 mg and 30 mg of stabilizer (per 100 mg of PLGA) was found to be associated with the nanoparticles (Table 1).
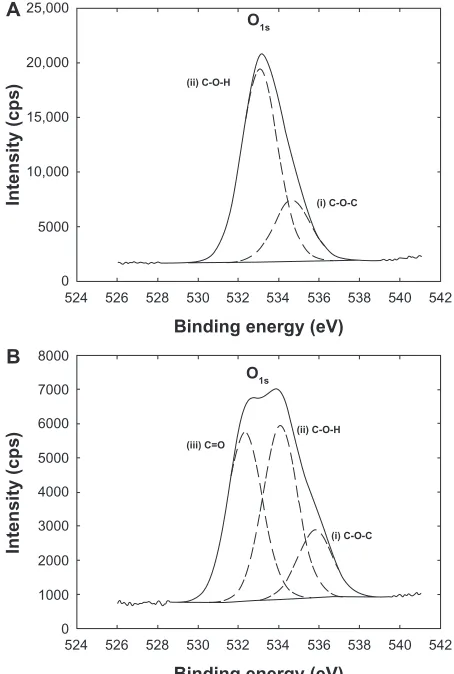
A hydroxyl derivative of rhodamine B (Rhod-OH) was covalently linked to PLGA, and the resulting tagged polymer (Rhod-PLGA) was used for the preparation of fluorescent nanoparticles by simply blending it with unmodified PLGA. Use of Rhod-PLGA did not influence either the size distri-bution or the surface charge of the nanoparticles. The only exception was the Rhod-PLGA/CS nanoparticles, the size and zeta potential of which decreased slightly (Table 1). Therefore, x-ray photoelectron spectroscopy was used to investigate the presence of rhodamine on the nanoparticle surface. The O1 s peak-fitted envelopes for the PLGA/CS nanoparticles and Rhod-PLGA/CS nanoparticles is reported in Figure S1. The two main components of the O1 s peak of the PLGA/CS nanoparticles are centered at binding energies of 533.1 eV and 534.7 eV, and assigned to OC-OHand OC-O-C, respectively, while for the Rhod-PLGA/CS nanoparticles, the O1 s envelope shows three major peaks which correspond to OC=O (532.4 eV), OC-OH (534.1 eV), and OC-O-C (535.8 eV) environments. The presence of a third signal, the binding energy of which can be assigned to carbonyl groups, confirms the presence of rhodamine moieties on the surface of the Rhod-PLGA/CS nanoparticles. However, x-ray photoelectron spectroscopy analysis of the PLGA/PVA nanoparticles and PLGA/PF68 nanoparticles did not reveal any modification due to the presence of rhodamine (Table S1).
The stability of the linkage between rhodamine and nanoparticles was investigated over 48 hours in Dulbecco’s phosphate-buffered saline at 37°C. The results confirm that the covalent bond between the dye and the PLGA was highly
Table 1 Physicochemical properties of unlabeled and rhodamine-labeled nanoparticles
Nanoparticle type
Mean diameter (nm)
PDI Zeta potential (mV)
Associated stabilizers (mg/100 mg PLGA) PLgA/cs 230 ± 6 0.20 +32 ± 3 15.3 ± 3.3 (cs)
30.4 ±1.8 (PVA) PLgA/PVA 230 ± 2 0.12 −5 ± 1 11.5 ± 1.1 (PVA) PLgA/PF68 105 ± 2 0.13 −24 ± 1 10.7 ± 3.7 (PF68) rhod-PLgA/cs 174 ± 3 0.20 +13 ± 1 20.5 ± 4.8 (cs)
31.8 ± 2.6 (PVA) rhod-PLgA/PVA 226 ± 4 0.09 −5 ± 1 12.4 ± 1.0 (PVA) rhod-PLgA/PF68 100 ± 2 0.13 −20 ± 2 10.6 ± 2.1 (PF68)
Abbreviations: PLgA, poly (lactide-co-glycolide); PVA, poly (vinyl alcohol); cs, chitosan; rhod, rhodamine B; PF68, Pluronic® F68; PDI, polydispersity index.
International Journal of Nanomedicine downloaded from https://www.dovepress.com/ by 118.70.13.36 on 23-Aug-2020
Dovepress Toxicity of PLgA nanoparticles to calu-3 cells
stable, because only a small amount of free rhodamine was recovered. After 24 hours, a maximum of 7.5% of the dye leaked out from the nanoparticles without any significant fur-ther release during the following 24 hours of incubation.
To monitor for any possible size and zeta potential variation upon exposure to the different experimental environments, the nanoparticles were incubated for 96 hours at 37°C in three different media, ie, water, cell culture medium (DMEM) containing 10% fetal bovine serum, and phosphate buffer. In
each medium, the size distribution was followed as a function of incubation time (Table 2). Interestingly, regardless of their surface charge, the size of the nanoparticles was not signifi-cantly different in water and in cell culture medium containing fetal bovine serum. A size increase was observed only for PLGA/CS nanoparticles after incubation in phosphate buffer. Moreover, the zeta potential values for the nanoparticles did not show significant modification in cell culture medium contain-ing fetal bovine serum either (+8 ± 3, −2 ± 1, and −18 ± 3 mV for PLGA/CS, PLGA/PVA, and PLGA/PF68, respectively). On the basis of these results, cell culture medium containing fetal bovine serum was selected for dilution of nanoparticles to appropriate concentrations for the in vitro studies.
effect of nanoparticle concentration
and surface chemistry on cell viability,
uptake, and inflammatory response
Calu-3 cell viability was investigated as a function of nanoparticle concentration (0.03–5 mg/mL) using the MTT assay. This quantitative colorimetric test is based on the ability of viable cells to metabolize the water-soluble dye (MTT) into a colored formazan salt. After 72 hours of incubation, cell viability was always higher than 50%, even at the highest con-centration tested (Figure 2). Cell viability initially diminished as the nanoparticle concentration increased up to 0.3 mg/mL, and then reached a plateau. Only after exposure to the PLGA/ PF68 nanoparticles did cell viability progressively decrease and drop to 57% ± 2% at 5 mg/mL. Furthermore, the contri-bution of stabilizers to cytotoxicity was assessed, revealing that cell viability was higher in the presence of the stabilizer solutions than after incubation with nanoparticle suspensions containing the same amount of stabilizers (Figure 3).
Neither the nanoparticle formulations nor the different stabilizers, when assayed separately, led to a reduction in cell viability below 50%. A wide range of concentrations was tested to screen the toxicity of the nanoparticles accurately
A B C
100 nm 100 nm 100 nm
Figure 1 Transmission electron microscopic images of (A) PLgA/cs nanoparticles, (B) PLgA/PVA nanoparticles, and (C) PLgA/PF68 nanoparticles.
Abbreviations: PLgA,poly (lactide-co-glycolide); PVA, poly (vinyl alcohol); PF68, Pluronic® F68; cs chitosan.
Table 2 evolution of mean diameter of PLgA/cs, PLgA/PVA, and PLgA/PF68 nanoparticles at 37°C as a function of time (size
is expressed in nm unless otherwise stated). Nanoparticles were incubated and measured in water, cell culture medium containing 10% fetal bovine serum, and ca²+ and Mg²+ free phosphate buffer
Experimental medium
Time (h)
Nanoparticle type PLGA/
CS
PLGA/ PVA
PLGA/ PF68 0 230 ± 8 210 ± 6 103 ± 2 4 218 ± 6 205 ± 5 102 ± 5
h20 24 227 ± 7 203 ± 5 101 ± 2
48 212 ± 3 201 ± 6 98 ± 4 72 225 ± 8 201 ± 4 103 ± 2 96 215 ± 3 204 ± 3 102 ± 3
4 217 ± 36 159 ± 12 113 ± 4 24 166 ± 13 141 ± 6 123 ± 8 DMeM + 10% FBs 48 173 ± 10 157 ± 5 131 ± 9 72 216 ± 26 156 ± 5 128 ± 5 96 188 ± 12 156 ± 6 134 ± 9
4 688 ± 86 198 ± 9 114 ± 4 24 851 ± 113 197 ± 5 102 ± 3
PBs 48 .1 µm 200 ± 4 115 ± 5
72 .1 µm 202 ± 4 112 ± 2 96 .1 µm 201 ± 3 111 ± 3
Note: Data represent the mean ± standard deviation (n = 3).
Abbreviations: FBs, fetal bovine serum; PLgA, poly (lactide-co-glycolide); PVA, poly (vinyl alcohol); PF68, Pluronic® F68; cs, chitosan; PBs, phosphate-buffered
solution; DMEM, Dulbecco’s modified Eagle’s medium.
International Journal of Nanomedicine downloaded from https://www.dovepress.com/ by 118.70.13.36 on 23-Aug-2020
Dovepress Mura et al
over an incubation time that allowed cells to remain in exponential growth and undergo doubling. To confirm the absence of any acute toxicity, cell viability was investigated after 4 and 24 hours of incubation (Figure 4). Exposure of Calu-3 cells to PLGA/PVA and PLGA/CS nanoparticles for 4 hours did not affect their viability as compared with untreated cells. At 4 hours, following exposure to PLGA/ PF68 nanoparticles, an increase in cell viability was found. No significant differences were observed as a function of nanoparticle concentration. A mild adverse effect was evident after 24 hours, especially with PLGA/PVA nano-particles, which caused a decrease in cell viability down to 80% at a concentration of 5 mg/mL. In subsequent studies, 0.2 mg/mL was used to ensure at least 80% cell viability. By contrast, incubation of acrolein, used as control with the same Calu-3 cells, caused a 50% reduction in viability at a concentration of 17 µg/mL (data not shown).
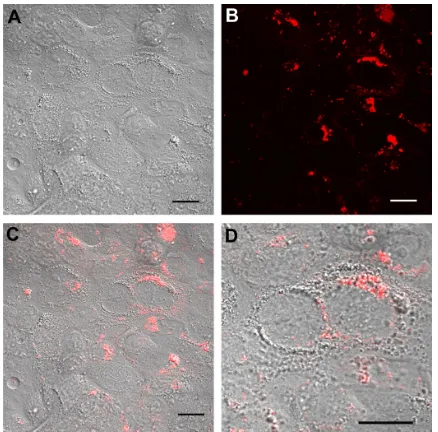
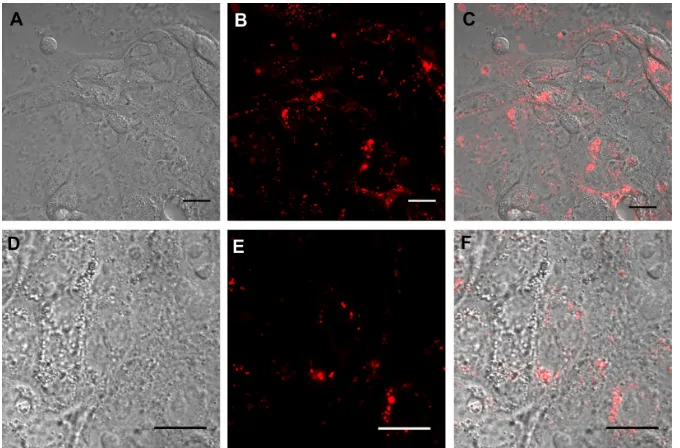
The influence of surface chemistry and surface charge on the ability of Calu-3 cells to internalize nanoparticles was then investigated. After 24 hours of incubation with rhod-amine-tagged nanoparticles, the cells were washed with fresh medium to remove the membrane-bound nanoparticles. The cellular uptake of nanoparticles was then observed in living cells by confocal laser scanning microscopy. No morphologi-cal alteration of the cells was detected on Nomarski images, confirming the results obtained by MTT. Fluorescence images and their superimposition on Nomarski images show that
fluorescent spots accumulate within the cells and especially around the nuclei, demonstrating the interaction of the nanoparticles with cells and their intracellular accumula-tion, most probably into intracellular vacuoles (Figure 5). In addition, no difference could be observed between the 0
0 1 2
PLGA/CS NPs PLGA/PVA NPs PLGA/PF68 NPs
3
PLGA (mg·mL−1)
Cell viability
%
4 5 6
*,**
§
20 40 60 80 100 120
Figure 2 calu-3 cell viability (MTT assay) after 72 hours of exposure to PLgA/cs, PLgA/PVA, and PLgA/PF68 nanoparticles (0.030–5 mg/mL). each experiment was repeated eight times from three independent incubation preparations. results are expressed as percentages of absorption for treated cells (± standard deviation) in comparison with untreated control cells.
Notes: statisticalsignificance was indicated as P, 0.05. *PLgA/cs nanoparticles versus PLgA/PVA nanoparticles (0.030–5 mg/mL); **PLgA/cs versus PLgA/ PF68 nanoparticles (3–5 mg/mL); §PLgA/PVA nanoparticles versus PLgA/PF68 nanoparticles (0.030–1 mg/mL).
Abbreviations: PLgA,poly (lactide-co-glycolide); PVA, poly (vinyl alcohol); cs, chitosan; NPs, nanoparticles; PF68, Pluronic® F68.
0
0.0 0.1 0.2 0.3
PLGA/CS NPs CS solution
0.4 0.5
CS (mg·mL−1)
Cell viability
%
0.6 0.7 0.8
*
* *
*
* *
*
20 40 60 80 100 120
0
0.0 0.1 0.2 0.3
PLGA/PVA NPs PVA solution
0.4 0.5
PVA (mg·mL−1)
Cell viability
%
0.6 20
40 60 80 100 120
0
0 2 4 6
PLGA/PF68 NPs PF68 solution
8 10
PF68 (mg·mL−1)
Cell viability
%
12 20
40 60 80 100 120 C B A
Figure 3 calu-3 cell viability (MTT assay) after 72 hours of exposure to (A) PLgA/ cs, (B) PLgA/PVA, and (C) PLgA/PF68 nanoparticles or (A) cs, (B) PVA, and (C) PF68 solutions as a function of stabilizer concentration. Each experiment was
repeated eight times from three independent incubation preparations. results are expressed as percentages of absorption for treated cells (± standard deviation) in comparison with untreated control cells.
Note: statisticalsignificance was indicated as *P, 0.05 (stabilizer solution versus
PLgA nanoparticles).
Abbreviations: PLgA,poly (lactide-co-glycolide); PVA, poly (vinyl alcohol); PF68, Pluronic® F68; cs, chitosan; NPs, nanoparticles.
International Journal of Nanomedicine downloaded from https://www.dovepress.com/ by 118.70.13.36 on 23-Aug-2020
Dovepress Toxicity of PLgA nanoparticles to calu-3 cells
different nanoparticles (Figures S2 and S3). These results were confirmed also by flow cytometry measurement of cell-associated levels of Rhod-PLGA nanoparticles. Despite their different surface properties, the internalization profiles of the PLGA nanoparticles were similar (Table S2).
To assess whether biodegradable nanoparticles induced an inflammatory phenotype in the Calu-3 cell line as a function of their surface properties, we investigated their effect on different markers of inflammation, ie, TNFα, IL-6, and IL-8. The release of cytokines was investigated over 48 hours of exposure to nanoparticles (0.2 mg/mL) using lipopolysaccha-ride as a positive control (10 µg/mL, Figure 6A and B). The concentration of lipopolysaccharide chosen was consistent with previous work.37,38
As expected, a basal concentration of cytokines in the supernatant was detected in control cells.39 Remarkably, no
effect of treatment with nanoparticles, regardless of their physicochemical surface properties, was observed, with IL-8 and IL-6 concentrations in the supernatant not being different between the treatment groups. IL-8 was secreted at a higher concentration compared with IL-6, and a significant increase in IL-8 release over time was found only for the positive control (P , 0.05 and P , 0.01 for cells exposed to lipopoly-saccharide compared with control or nanoparticle-exposed cells at 24 hours and 48 hours, respectively). TNFα was not detected in any of the samples, thus indicating an absence of response after incubation with nanoparticles.
Discussion
Nanoparticles were modified by three different stabilizing agents, ie, CS, PVA, or PF68, in order to study the influence 0
0 1 2 3
t = 24 h t = 72 h
PLGA/CS NPs
t = 4 h
4 5
PLGA (mg·mL−1)
Cell viability
%
6 *
* *
#
# #
* *
#
# #
# # #
#
*
# # #
# #
20 40 60 80 100 120
0
0 1 2 3
t = 24 h t = 72 h
PLGA/PVA NPs
t = 4 h
4 5
PLGA (mg·mL−1)
Cell viability
%
6
* 20
40 60 80 100 120
0
0 1 2 3
t = 24 h t = 72 h
PLGA/PF68 NPs
t = 4 h
4 5
PLGA (mg·mL−1)
Cell viability
%
6 *
* * *
20 40 60 80 100 120 140 C B A
Figure 4 evolution of calu-3 cell viability (MTT assay) after exposure to (A) PLgA/ cs, (B) PLgA/PVA, and (C) PLgA/PF68 nanoparticles as a function of time. each experiment was repeated eight times from three independent incubation preparations. results are expressed as percentages of absorption for treated cells (± standard deviation) in comparison with untreated control cells.
Notes: Thesignificance was indicated as *P, 0.05 (24 hours versus 4 hours) and #P, 0.05 (72 hours versus 24 hours).
Abbreviations: PLgA,poly (lactide-co-glycolide); PVA, poly (vinyl alcohol); PF68, Pluronic® F68; cs, chitosan; NPs, nanoparticles.
Figure 5 real time confocal laser scanner microscopy images of calu-3 cells exposed to rhod-PLgA/PVA nanoparticles for 24 hours and subsequent washing of the medium. (A) Nomarski image, (B) fluorescent image, and (C) superimposition of
Nomarski and fluorescence images, and (D) enlarged region of (C).
Note: scalebars = 20 µm.
Abbreviations: PLgA,poly (lactide-co-glycolide); PVA, poly (vinyl alcohol); rhod, rhodamine B alcohol.
International Journal of Nanomedicine downloaded from https://www.dovepress.com/ by 118.70.13.36 on 23-Aug-2020
Dovepress Mura et al
of surface properties on their toxicity. It was observed that nanoparticles made of PLGA/CS displayed a positive charge that could have arisen from electrostatic interactions between the negatively charged groups of PLGA and the positively charged CS that induce adsorption of CS onto the nanoparticle surface. Only a fraction of the amino groups were required to neutralize the negative charges of PLGA, whereas the remaining free amino groups were responsible for the resulting positive zeta potential. Similarly, the surface properties of PLGA/PVA nanoparticles were the result of the adsorption of PVA (which is a partially hydrolyzed poly(vinyl acetate), containing vinyl alcohol and vinyl acetate monomer units). The hydrophobic acetate moieties confer amphiphilic properties to PVA that may adsorb at the organic phase-water interface during particle formation, leading to its entrap-ment within the PLGA matrix on the nanoparticle surface.40
Given its high molecular weight (30–70 kDa), the PVA layer was able to screen PLGA charges, leading to an almost neutral zeta potential value. PF68, a polyoxyethylene-block– polyoxypropylene-block-polyoxyethylene
(PEO-b-PPO-b-PEO) triblock polymer, is also neutral but with a lower
molecular weight (8.4 kDa). Therefore, its adsorption on the nanoparticle surface may cause only a partial screening of PLGA charges,41 resulting in negatively charged
nano-particles. It was also important to verify that rhodamine used to label the nanoparticles for in vitro tracking did not change these surface properties significantly. Rhodamine was selected because its emission wavelengths are higher than those commonly associated with autofluorescence in cells.42
Formulation of nanoparticles with a chemically modified polymer was chosen instead of using physically entrapped dyes due to possible desorption and release of the fluorescent molecule and consequent misinterpretation of the imaging results.43,44 The fluorescent dye did not affect the nanoparticle
size; indeed, the slight size decrease from 230 nm to 170 nm observed for the Rhod-PLGA/CS nanoparticles was not due to the presence of rhodamine but to the use of a mixture of different molecular weight PLGAs. This was confirmed by a control formulation obtained with unlabelled PLGAs. Electrostatic interactions between CS (the only charged stabilizer used in this study) and the fluorescent probe led to a surface distribution of positively charged rhodamine moieties that might explain the decreased zeta potential. Indeed, the zeta potential represents the overall charge of the slipping plane, ie, the cloud of ions surrounding the surface of the particles, which is influenced by the composition of the nanoparticle surface.45 The stabilizers did not carry any
charge in these formulations, confirming that the presence of rhodamine on the Rhod-PLGA/CS nanoparticle surface arises from electrostatic interactions with CS. Importantly, the covalent bond between the dye and the PLGA was shown to be highly stable, with only a small amount of rhodamine being detected in the release medium. These results, which are in good agreement with those obtained with rhodamine-tagged poly (alkyl cyanoacrylate) nanoparticles,46 may also
be correlated with the initial formation of small amounts of soluble fluorescent degradation products and their diffusion into the medium.47
The stability of the nanoparticles in biological medium was tested, and they were mostly stable after incubation in culture medium containing fetal bovine serum. Such good stability could be explained by the fact that nanoparticle aggregation was probably prevented by serum proteins which adsorb onto their surface, thus taking part in their stabilization
0
24 48
**
Time (h) IL-6
pg/10
6 cells
200 400 600 800 1000 1200 1400
0
24 48
**
* *
Time (h) IL-8
pg/10
6 cells
5 10 15 20 25 30
B A
Figure 6 (A) IL-6 and (B) IL-8 secretion by calu-3 cells exposed for 24 hours and 48 hours to lipopolysaccharide (gray bars), PLgA/cs (red bars), PLgA/PVA (green bars), and PLgA/PF68 nanoparticles (blue bars). White bars represent cytokine secretion from untreated control cells.
Notes: Datarepresent the mean ± standard deviation (n = 3). *P, 0.05, **P, 0.01 (lipopolysaccharide-exposed versus control and nanoparticle-treated cells).
Abbreviations: PLgA,poly (lactide-co-glycolide); PVA, poly (vinyl alcohol); PF68, Pluronic® F68; cs, chitosan; IL, interleukin.
International Journal of Nanomedicine downloaded from https://www.dovepress.com/ by 118.70.13.36 on 23-Aug-2020
Dovepress Toxicity of PLgA nanoparticles to calu-3 cells
via steric repulsion. A size increase was obvious only for PLGA/CS nanoparticles after incubation in phosphate buffer, which may be due to the screening of electrostatic repulsion as a result of the ionic strength of the buffer. The results recorded for PLGA/PVA and PLGA/PF68 nanopar-ticles confirm their stabilization by steric repulsion due to stabilizer adsorption at their surface, as long as they are not affected by the electrolyte concentration in the experimental medium.48
Within the airways, the epithelial cells are the first inter-face encountered by inhaled materials. Although alveolar epithelial cells have often been used as in vitro models to investigate the lung toxicity of various nanoparticles, local bronchial deposition, due to the impact of the inhaled nano-particles on the bifurcations of the airways, has to be consid-ered due to their important role in the development of lung cancer.49 While the most important function of alveolar
epi-thelial cells is gas exchange, bronchial cells play a critical role in defense mechanisms against xenobiotics due to the produc-tion of mucus and the presence of cilia which allow deposited material to be swept out of the lung. Furthermore, bronchial epithelial cells are able to express cytokines, chemokines, and adhesion molecules.50–52 To assess the in vitro toxicity of the
nanoparticles, we chose the Calu-3 cell line previously used to assess the toxicological profiles of environmental matter and colloidal systems.6 The Calu-3 cell line derives from a
human adenocarcinoma, and constitutes a well established in vitro model of lung epithelium.21 Calu-3 cells secrete mucus
and have apically located cilia mimicking the physiological conditions of the upper airways.53
The results for the viability of Calu-3 after exposure to nanoparticles showed that viability starts to decrease only at very high concentrations, highlighting the safety of nano-particles, independently of their chemical composition and surface properties. After short exposure (4 hours) to PLGA/ PF68 nanoparticles, an increase in cell viability was found. This result may be explained by a nonspecific response causing rapid and transient activation of cell metabolism, probably leading to an increase in the cellular capacity to reduce MTT. The absence of differences as a function of nanoparticle concentration and the high value of the standard deviations support the hypothesis of a nonspecific response to applied stress, which did not have a homogeneous effect. Moreover, the different behavior of the nanoparticles observed at 24 hours compared with 4 hours suggests a rapid response which takes place only during the first hours of exposure to the PLGA/PF68 nanoparticles. Only acrolein, which is the strongest irritant component among the various constituents
of cigarette smoke, caused a 50% reduction in cell viability, confirming that PLGA nanoparticles lack toxicity. The PLGA nanoparticles only affected the viability of Calu-3 cells at concentrations that are too high for clinical use. The low cytotoxicity is confirmed by other studies of lung cells, such as the A549 cell line, where concentrations of 5 mg/mL were reached without cytotoxicity.54 The absence of inflammation
using PLGA nanoparticles has been described previously.55
However, stimulation of epithelial cells by non-biodegradable nanoparticles exhibiting different physicochemical properties led to lung inflammation characterized by secretion of different mediators that can cause differentiation, chemotaxis, or activa-tion of inflammatory cells.56,57 This is why we investigated the
effect of surface-modified nanoparticles on the production of TNFα, an acute inflammatory response cytokine; IL-6, which is responsible for neutrophil activation; and IL-8 that exerts a chemotactic action on inflammatory cells. Lipopolysaccharide was used as a positive control. In contrast with lipopolysac-charide, no significant increase in these inflammation markers was observed. These results are of great importance consider-ing the role of these cytokines in the inflammatory response and their ability to activate almost any type of cell. Moreover, the absence of TNFα suggests a lack of biological effect on other cells of the airway epithelium. Altogether, these results show that biodegradable nanoparticles composed of PLGA did not cause any inflammatory activation in this in vitro model of lung epithelium and exclude the influence of differ-ent physicochemical surface properties of the nanoparticles in the cellular inflammatory response.
Conclusion
This study is among the first attempts to investigate system-atically the fundamental role of physicochemical surface properties on the potential in vitro lung toxicity of biodegrad-able PLGA nanoparticles. Nanoparticles are internalized by Calu-3 cells and induce low toxicity even at high concentra-tions, independently of their surface chemistry and charge. Furthermore, exposure to nanoparticles does not promote the release of TNFα, IL-6, and IL-8, confirming the absence of inflammatory activation potential. These in vitro results highlight the safety of biodegradable PLGA nanoparticles on the bronchial epithelium and provide the first data on their potential effects and the risks associated with their use as colloidal nanomedicines.
Acknowledgments
The authors would like to acknowledge D Jaillard for trans-mission electron microscopy (Univ Paris-Sud, Orsay), V
International Journal of Nanomedicine downloaded from https://www.dovepress.com/ by 118.70.13.36 on 23-Aug-2020
Dovepress Mura et al
Nicolas (Univ Paris-Sud, Châtenay Malabry) for confocal microscopy experiments, and Véronique Marsaud for technical assistance with the cell culture experiments. This study was supported by the AFSSET “Emerging risks” program, by ANR (under reference 2009 CESA 011), and by a postdoctoral grant from the Univ Paris-Sud.
Disclosure
The authors report no conflicts of interest with this work.
References
1. Oberdorster G, Oberdorster E, Oberdorster J. Nanotoxicology: an emerging discipline evolving from studies of ultrafine particles. Environ Health Perspect. 2005;113(7):823–839.
2. Wittmaack K. In search of the most relevant parameter for quantify-ing lung inflammatory response to nanoparticle exposure: particle number, surface area, or what? Environ Health Perspect. 2007;115(2): 187–194.
3. Donaldson K, Aitken R, Tran L, et al. Carbon nanotubes: a review of their properties in relation to pulmonary toxicology and workplace safety. Toxicol Sci. 2006;92(1):5–22.
4. Kostarelos K. The long and short of carbon nanotube toxicity. Nat Biotechnol. 2008;26(7):774–776.
5. Shvedova AA, Kisin ER, Porter D, et al. Mechanisms of pulmonary toxicity and medical applications of carbon nanotubes: Two faces of Janus? Pharmacol Ther. 2009;121(2):192–204.
6. Alfaro-Moreno E, Torres V, Miranda J, et al. Induction of IL-6 and inhi-bition of IL-8 secretion in the human airway cell line Calu-3 by urban particulate matter collected with a modified method of PM sampling. Environ Res. 2009;109(5):528–535.
7. Brandenberger C, Rothen-Rutishauser B, Muhlfeld C, et al. Effects and uptake of gold nanoparticles deposited at the air-liquid interface of a human epithelial airway model. Toxicol Appl Pharmacol. 2010;242(1): 56–65.
8. Huang CC, Aronstam RS, Chen DR, Huang YW. Oxidative stress, calcium homeostasis, and altered gene expression in human lung epithelial cells exposed to ZnO nanoparticles. Toxicol In Vitro. 2010;24(1):45–55.
9. Warheit DB, McHugh TA, Hartsky MA. Differential pulmonary responses in rats inhaling crystalline, colloidal or amorphous silica dusts. Scand J Work Environ Health. 1995;21 Suppl 2:19–21. 10. Rossi EM, Pylkkanen L, Koivisto AJ, et al. Airway exposure to
silica-coated TiO2 nanoparticles induces pulmonary neutrophilia in mice. Toxicol Sci. 2010;113(2):422–433.
11. Mansour HM, Rhee YS, Wu X. Nanomedicine in pulmonary delivery. Int J Nanomedicine. 2009;4:299–319.
12. Patton JS, Byron PR. Inhaling medicines: delivering drugs to the body through the lungs. Nat Rev Drug Discov. 2007;6(1):67–74.
13. Pison U, Welte T, Giersig M, Groneberg DA. Nanomedicine for respira-tory diseases. Eur J Pharmacol. 2006;533(1–3):341–350.
14. Sung JC, Pulliam BL, Edwards DA. Nanoparticles for drug delivery to the lungs. Trends Biotechnol. 2007;25(12):563–570.
15. Shoyele SA, Cawthorne S. Particle engineering techniques for inhaled biopharmaceuticals. Adv Drug Deliv Rev. 2006;58(9–10):1009–1029. 16. Rytting E, Bur M, Cartier R, et al. In vitro and in vivo performance of
biocompatible negatively-charged salbutamol-loaded nanoparticles. J Control Release. 2010;141(1):101–107.
17. Fernandez-Urrusuno R, Fattal E, Porquet D, Feger J, Couvreur P. Influence of surface properties on the inflammatory response to poly-meric nanoparticles. Pharm Res. 1995;12(9):1385–1387.
18. Fernandez-Urrusuno R, Fattal E, Porquet D, Feger J, Couvreur P. Evalu-ation of liver toxicological effects induced by polyalkylcyanoacrylate nanoparticles. Toxicol Appl Pharmacol. 1995;130(2):272–279.
19. Fernandez-Urrusuno R, Fattal E, Feger J, Couvreur P, Therond P. Evaluation of hepatic antioxidant systems after intravenous administra-tion of polymeric nanoparticles. Biomaterials. 1997;18(6):511–517. 20. Sporty JL, Horalkova L, Ehrhardt C. In vitro cell culture models for the
assessment of pulmonary drug disposition. Expert Opin Drug Metab Toxicol. 2008;4(4):333–345.
21. Foster KA, Avery ML, Yazdanian M, Audus KL. Characterization of the Calu-3 cell line as a tool to screen pulmonary drug delivery. Int J Pharm. 2000;208(1–2):1–11.
22. Shen BQ, Finkbeiner WE, Wine JJ, Mrsny RJ, Widdicombe JH. Calu-3: a human airway epithelial cell line that shows cAMP-dependent Cl- secretion. Am J Physiol. 1994;266(5 Pt 1):L493–L501.
23. da Paula AC, Ramalho AS, Farinha CM, et al. Characterization of novel airway submucosal gland cell models for cystic fibrosis studies. Cell Physiol Biochem. 2005;15(6):251–262.
24. Yan F, Zhang C, Zheng Y, et al. The effect of poloxamer 188 on nanoparticle morphology, size, cancer cell uptake, and cytotoxicity. Nanomedicine. 2010;6(1):170–178.
25. Dadashzadeh S, Derakhshandeh K, Shirazi FH. 9-nitrocamptothecin poly-meric nanoparticles: cytotoxicity and pharmacokinetic studies of lactone and total forms of drug in rats. Anticancer Drugs. 2008;19(8):805–811. 26. de Lima R, do Espirito Santo Pereira A, Porto R, Fraceto L. Evaluation
of Cyto- and Genotoxicity of Poly(lactide-co-glycolide) Nanoparticles. J Polym Environ. 2011;19(1):196–202.
27. Robbens J, Vanparys C, Nobels I, et al. Eco-, geno- and human toxicology of bio-active nanoparticles for biomedical applications. Toxicology. 2010;269(2–3):170–181.
28. Shive MS, Anderson JM. Biodegradation and biocompatibility of PLA and PLGA microspheres. Adv Drug Deliv Rev. 1997;28(1):5–24. 29. Anderson JM. In vivo biocompatibility of implantable delivery systems
and biomaterials. Eur J Pharm Biopharm. 1994;40(1):1–8.
30. Nguyen T, Francis MB. Practical synthetic route to functionalized rhodamine dyes. Org Lett. 2003;5(18):3245–3248.
31. Gomez-Gaete C, Tsapis N, Besnard M, Bochot A, Fattal E. Encapsula-tion of dexamethasone into biodegradable polymeric nanoparticles. Int J Pharm. 2007;331(2):153–159.
32. Joshi DP, Lan-Chun-Fung YL, Pritchard JG. Determination of poly(vinyl alcohol) via its complex with boric acid and iodine. Anal Chim Acta. 1979;104(1):153–160.
33. Muzzarelli RA. Colorimetric determination of chitosan. Anal Biochem. 1998;260(2):255–257.
34. Trimaille T, Pichot C, Elaissari A, et al. Poly(D,L-lactic acid) nanopar-ticle preparartion and colloidal characterization. Colloid Polym Sci. 2003;281(12):1184–1190.
35. Tanuma S, Powell CJ, Penn DR. Calculations of electron inelastic mean free paths. V. Data for 14 organic compounds over the 50–2000 eV range. Surf Interface Anal. 1994;21(3):165–176.
36. Scofield JH. Hartree-Slater subshell photoionization cross- sections at 1254 and 1487 eV. J Electron Spectrosc Relat Phenom. 1976;8(2): 129–137.
37. Anas AA, Hovius JW, van ‘t Veer C, van der Poll T, de Vos AF. Role of CD14 in a mouse model of acute lung inflammation induced by different lipopolysaccharide chemotypes. PLoS One. 2010;5(4):e10183. 38. Li B, Dong C, Wang G, et al. Pulmonary epithelial CCR3 promotes
LPS-induced lung inflammation by mediating release of IL-8. J Cell Physiol. 2011;226(9):2398–2405.
39. Journeay WS, Suri SS, Moralez JG, Fenniri H, Singh B. Low inflamma-tory activation by self-assembling Rosette nanotubes in human Calu-3 pulmonary epithelial cells. Small. 2008;4(6):817–823.
40. Pisani E, Fattal E, Paris J, et al. Surfactant dependent morphology of polymeric capsules of perfluorooctyl bromide: influence of polymer adsorption at the dichloromethane-water interface. J Colloid Interface Sci. 2008;326(1):66–71.
41. Santander-Ortega MJ, Jodar-Reyes AB, Csaba N, Bastos-Gonzalez D, Ortega-Vinuesa JL. Colloidal stability of pluronic F68-coated PLGA nanoparticles: a variety of stabilisation mechanisms. J Colloid Interface Sci. 2006;302(2):522–529.
International Journal of Nanomedicine downloaded from https://www.dovepress.com/ by 118.70.13.36 on 23-Aug-2020
Dovepress Toxicity of PLgA nanoparticles to calu-3 cells
42. Benson RC, Meyer RA, Zaruba ME, McKhann GM. Cellular autofluorescence – is it due to flavins? J Histochem Cytochem. 1979; 27(1):44–48.
43. Pietzonka P, Rothen-Rutishauser B, Langguth P, et al. Transfer of lipophilic markers from PLGA and polystyrene nanoparticles to caco-2 monolayers mimics particle uptake. Pharm Res. 2002;19(5): 595–601.
44. Xu P, Gullotti E, Tong L, et al. Intracellular drug delivery by poly(lactic-co-glycolic acid) nanoparticles, revisited. Mol Pharm. 2009;6(1): 190–201.
45. Kirby BJ, Hasselbrink EF Jr. Zeta potential of microfluidic substrates: 2. Data for polymers. Electrophoresis. 2004;25(2):203–213.
46. Brambilla D, Nicolas J, Le Droumaguet B, et al. Design of fluorescently tagged poly(alkyl cyanoacrylate) nanoparticles for human brain endothe-lial cell imaging. Chem Commun (Camb). 2010;46(15):2602–2604. 47. Zweers ML, Engbers GH, Grijpma DW, Feijen J. In vitro degradation of
nanoparticles prepared from polymers based on DL-lactide, glycolide and poly(ethylene oxide). J Control Release. 2004;100(3):347–356. 48. Buttini F, Soltani A, Colombo P, Marriott C, Jones SA. Multilayer PVA
adsorption onto hydrophobic drug substrates to engineer drug-rich microparticles. Eur J Pharm Sci. 2008;33(1):20–28.
49. Balashazy I, Hofmann W, Heistracher T. Local particle deposition patterns may play a key role in the development of lung cancer. J Appl Physiol. 2003;94(5):1719–1725.
50. Driscoll KE, Carter JM, Hassenbein DG, Howard B. Cytokines and particle-induced inflammatory cell recruitment. Environ Health Perspect. 1997;105 Suppl 5:1159–1164.
51. Nicod LP. Lung defences: an overview. Eur Respir Rev. 2005;14: 45–50.
52. Auger F, Gendron MC, Chamot C, Marano F, Dazy AC. Responses of well-differentiated nasal epithelial cells exposed to particles: role of the epithelium in airway inflammation. Toxicol Appl Pharmacol. 2006; 215(3):285–294.
53. Manford F, Tronde A, Jeppsson AB, et al. Drug permeability in 16HBE14o- airway cell layers correlates with absorption from the isolated perfused rat lung. Eur J Pharm Sci. 2005;26(5):414–420. 54. Tahara K, Yamamoto H, Kawashima Y. Cellular uptake mechanisms and
intracellular distributions of polysorbate 80-modified poly (D,L-lactide-co-glycolide) nanospheres for gene delivery. Eur J Pharm Biopharm. 2010;75(2):218–224.
55. Dailey LA, Jekel N, Fink L, et al. Investigation of the proinflammatory potential of biodegradable nanoparticle drug delivery systems in the lung. Toxicol Appl Pharmacol. 2006;215(1):100–108.
56. Fujii T, Hayashi S, Hogg JC, Vincent R, Van Eeden SF. Particulate matter induces cytokine expression in human bronchial epithelial cells. Am J Respir Cell Mol Biol. 2001;25(3):265–271.
57. Ovrevik J, Lag M, Holme JA, Schwarze PE, Refsnes M. Cytokine and chemokine expression patterns in lung epithelial cells exposed to components characteristic of particulate air pollution. Toxicology. 2009; 259(1–2):46–53.
International Journal of Nanomedicine downloaded from https://www.dovepress.com/ by 118.70.13.36 on 23-Aug-2020
Dovepress Mura et al
Table S1 X-ray photoelectron spectroscopic analysis of the different C1s and O1s peak fitting intensities of the polymers before and
after particle formulation
Sample XPS C1s envelope ratio (%) XPS O1s envelope ratio (%)
CC-C CC-O CC=O OC=O OO-C=O OC-OH OC-O-C
PLgA 24.8 35.0 40.2 62.4 37.6 – –
cs 14.0 69.0(2) 17.0 – – 39.7 60.3
PVA 47.9 45.1 7.0 36.4 – 63.6 –
PF68 100.0(1) – – – – 24.1 75.9
rhod-Oh 48.4 45.2 6.4 8.9 – 75 16.1
rhod-PLgA 49.9 43.4 6.7 10.1 – 71.8 18.1
PLgA/cs nanoparticles 25.6 54.0(2) 20.4 – – 76.1 23.9
PLgA/PVA nanoparticles 37.7 35.7 26.6 42.3 14.0 43.7 –
PLgA/PF68 nanoparticles 35.1 41.9 23.0 30.2 19.3 – 50.5
rhod-PLgA/cs nanoparticles 28.0 45.0(2) 27.0 41.2 – 42.3 16.5
rhod-PLgA/PVA nanoparticles 35.0 36.4 28.6 41.3 12.8 45.9 –
rhod-PLgA/PF68 nanoparticles 31.0 51.0 18.0 83.0(3) 17.0 – –
Notes: (1) Peak corresponds to cc-O and cc-N environments; (2) Peak corresponds to cc-O and cc-N environments; (3) Peak corresponds to Oc=O and cc-O-c environments.
Abbreviations: rhod, rhodamine B; PLgA, polylactide-co-glycolide; PVA, polyvinyl alcohol; PF68, Pluronic® F68; cs, chitosan; XPs, x-ray photoelectron spectroscopy.
524 526 528 530 532 534 Binding energy (eV)
536 538 540 542
524 526 528 530 532 534 Binding energy (eV)
536 538
(i) C-O-C (i) C-O-C
(ii) C-O-H (ii) C-O-H
O1s
O1s
(iii) C=O
540 542
Intensity (cps)
0 5000 10,000 15,000 20,000 25,000
Intensity (cps)
0 1000 2000 3000 4000 5000 6000 7000 8000
B A
Figure S1 Oxygen O1 s envelopes of x-ray photon spectroscopic analysis from (A) PLgA/cs nanoparticles and (B) rhod-PLgA/cs nanoparticles.
Abbreviations: rhod, rhodamine B; PLgA, poly (lactide-co-glycolide); cs, chitosan.
Table S2 Fluorescence variation with calu-3 cells after exposure to rhod-PLgA/cs, rhod-PLgA/PVA, and rhod-PLgA/PF68
nanoparticles. Red fluorescence was measured at 4, 12, and 24
hours
Percentage of cells above fluorescence threshold
4 hours 12 hours 24 hours rhod-PLgA/cs 9.1 ± 1.1 13.4 ± 1.8 21.5 ± 4.4 rhod-PLgA/PVA 7.6 ± 2.3 14.4 ± 4.7 20.3 ± 3.8 rhod-PLgA/PF68 9.0 ± 1.0 15.8 ± 1.6 28.4 ± 4.3
Notes: The results were obtained after gating and selection of a fluorescence
threshold. 10,000 cells were counted per sample. Data are expressed as the mean ±
standard deviation (n = 3).
Abbreviations: rhod, rhodamine B; PLgA, poly (lactide-co-glycolide); PVA, poly (vinyl alcohol); PF68, Pluronic® F68; cs, chitosan.
Supplementary material
International Journal of Nanomedicine downloaded from https://www.dovepress.com/ by 118.70.13.36 on 23-Aug-2020
International Journal of Nanomedicine
Publish your work in this journal
Submit your manuscript here: http://www.dovepress.com/international-journal-of-nanomedicine-journal The International Journal of Nanomedicine is an international,
peer-reviewed journal focusing on the application of nanotechnology in diagnostics, therapeutics, and drug delivery systems throughout the biomedical field. This journal is indexed on PubMed Central, MedLine, CAS, SciSearch®, Current Contents®/Clinical Medicine,
Journal Citation Reports/Science Edition, EMBase, Scopus and the Elsevier Bibliographic databases. The manuscript management system is completely online and includes a very quick and fair peer-review system, which is all easy to use. Visit http://www.dovepress.com/ testimonials.php to read real quotes from published authors. Dovepress
Dove
press
Toxicity of PLgA nanoparticles to calu-3 cells
Figure S2 real time confocal laser scanner microscopy images of calu-3 cells exposed to rhod-PLgA/cs nanoparticles for 24 hours and subsequent washing of the medium. (A) Nomarski image, (B) fluorescent image, and (C) superimposition of Nomarski and fluorescence images. (D, E, and F) show enlarged pictures.
Note: scalebars = 20 µm.
Abbreviations: rhod,rhodamine B; PLgA, poly (lactide-co-glycolide); cs, chitosan.
Figure S3 real time confocal laser scanner microscopy images of calu-3 cells exposed to rhod-PLgA/PF68 nanoparticles for 24 hours and subsequent washing of the medium. (A) Nomarski image, (B) fluorescent image, and (C) superimposition of Normaski and fluorescence images. (D, E, and F) show enlarged pictures.
Note: scalebars = 20 µm.
Abbreviations: rhod,rhodamine B; PLgA, poly (lactide-co-glycolide); PF68, Pluronic® F68.
International Journal of Nanomedicine downloaded from https://www.dovepress.com/ by 118.70.13.36 on 23-Aug-2020