Robust EEG Channel Selection across Subjects
for Brain-Computer Interfaces
Michael Schr ¨oder,1Thomas Navin Lal,2Thilo Hinterberger,3Martin Bogdan,1
N. Jeremy Hill,2Niels Birbaumer,3Wolfgang Rosenstiel,1and Bernhard Sch ¨olkopf2
1Department of Computer Engineering, Eberhard-Karls University T¨ubingen, Sand 13, 72076 T¨ubingen, Germany Emails:[email protected],[email protected],
2Max Planck Institute for Biological Cybernetics, Spemannstrasse 38, 72076 T¨ubingen, Germany Emails:[email protected],[email protected],[email protected]
3Institute of Medical Psychology and Behavioral Neurobiology, Eberhard-Karls University T¨ubingen, Gartenstrasse 29, 72074 T¨ubingen, Germany
Emails:[email protected],[email protected]
Received 11 February 2004; Revised 22 September 2004
Most EEG-based brain-computer interface (BCI) paradigms come along with specific electrode positions, for example, for a visual-based BCI, electrode positions close to the primary visual cortex are used. For new BCI paradigms it is usually not known where task relevant activity can be measured from the scalp. For individual subjects, Lal et al. in 2004 showed that recording positions can be found without the use of prior knowledge about the paradigm used. However it remains unclear to what extent their method ofrecursive channel elimination(RCE) can be generalized across subjects. In this paper we transfer channel rankings from a group of subjects to a new subject. For motor imagery tasks the results are promising, although cross-subject channel selection does not quite achieve the performance of channel selection on data of single subjects. Although the RCE method was not provided with prior knowledge about the mental task, channels that are well known to be important (from a physiological point of view) were consistently selected whereas task-irrelevant channels were reliably disregarded.
Keywords and phrases:brain-computer interface, channel selection, feature selection, recursive channel elimination, support vector machine, electroencephalography.
1. INTRODUCTION
Brain-computer interface (BCI) systems are designed to dis-tinguish two or more mental states during the performance of mental tasks (e.g., motor imagery tasks). Many BCI sys-tems for humans try to classify those states on the basis of electroencephalographic (EEG) signals using machine learn-ing algorithms.
The input for classification methods is a set of training examples. In the case of BCI one example might consist of EEG data (possibly containing several channels) of one trial and a label marking the class of the trial. Classification meth-ods pursue the objective to find structure in the data and as a result provide a mapping from EEG data to mental states.
For some tasks the relevant EEG recording positions that lead to good classification results are known, especially when the tasks involve motor imagery (e.g., the imagination of limb movements) or the overall activity of large parts of the cortex (so-called slow cortical potentials, SCP) that occurs during intentions or states of preparation and relaxation.
For the development of new paradigms the neural cor-relates might not be known in detail and finding optimal recording positions for the use in BCIs is challenging. Such new paradigms can become necessary in cases when mo-tor cortex areas show lesions, for the increase of the in-formation rate of BCI systems, or for robust multiclass BCIs.
Algorithms for channel selection (CS) can identify suit-able recording sites for individual subjects even in the ab-sence of prior knowledge about the mental task. In this case it is possible to reduce the number of EEG electrodes neces-sary for the classification of brain signals without losing sub-stantial classification performance.
In addition the CS results1can help to understand which part of the brain generates the class-relevant activity and even
1If an ordered list of channels is given by the CS algorithm that represents the importance of each channel for classification, this result is also called a
A B C
D E
0 10 20 30 40
Bestnremaining channels 0.1
0.15 0.2 0.25 0.3 0.35 0.4 0.45 0.5
Te
st
er
ro
r
Average RFE Average motor 17
0 10 20 30 40
Bestnremaining channels 0.1
0.15 0.2 0.25 0.3 0.35 0.4 0.45 0.5
Te
st
er
ro
r
Figure1: Test error of the channel selection methodRCEfor five subjects (A to E) on 39 EEG channels. The left graph shows the development of the test error against the bestnremaining channels determined by RCE. For some subjects, the test error can be decreased by selecting fewer than 39 channels. The right graph shows test error of RCE averaged over the five subjects. On average, good performance can be obtained by less than 10 channels. The average test error for a set of 17 EEG channels over or close to motor cortex is added as a baseline for comparison.
simplifies the detection of artifact channels.2In [2], different channel selection algorithms have been compared for a mo-tor imagery task. Figure 1shows an example of the change in classification error that is observed applying the winning method recursive channel elimination (RCE) to the data of five individuals.
If data from several subjects are available, the questions arise, whether a set of channels selected for one subject is useful also for other subjects and whether generalized con-clusions can be drawn about channels relevant for the classi-fication of a certain mental task across subjects.
The paper is organized as follows.Section 2contains the experimental setup, a description of the mental task, and the basic data preprocessing. InSection 3the channel selection method and the classification algorithm are described. Re-sults of cross-subject channel selection compared to average individual channel selection are given inSection 4while the final section concludes.
2. DATA ACQUISITION
2.1. Experimental setup and mental task
We recorded EEG signals from eight untrained right-handed male subjects using 39 silver chloride electrodes
2Some subjects unintentionally use muscle activity that influences the recorded signals when trained in a BCI system, especially if feedback is pro-vided.
(see Figure 2). The reference electrodes were positioned at TP9 and TP10. The two electrodes Fp2 and 1 cm lateral of the right eye (EOG) were used to record possible EOG artifacts and eye blinks while two frontotemporal and two occipital electrodes were positioned to detect possible muscle activity during the experiment. Before sampling the data at 256 Hz an analog bandpass filter with cutofffrequencies 0.1 Hz and 40 Hz was applied.
The subjects were seated in an armchair at 1 m distance in front of a computer screen. Following the experimental setup of [3] the subjects were asked to imagine left versus right hand movements during each trial. With every subject, we recorded 400 trials during one single session. The total length of each trial was 9 seconds. Additional intertrial inter-vals for relaxation varied randomly between 2 and 4 seconds. No outlier detection was performed and no trials were re-moved during the data processing at any stage.
Each trial started with a blank screen. A small fixation cross was displayed in the center of the screen from second 2 to 9. A cue in the form of a small arrow pointing to the right or left side was visible for half a second starting with second 3. In order to avoid event-related signals in later pro-cessing stages only data from seconds 4 to 9 of each trial were considered for further analysis. Feedback was not provided at any time.
2.2. Preanalysis
equally strong in subjects and might even fail for some sub-jects due to various reasons (e.g., because of too short in-tertrial intervals that prevent a proper resynchronization). Therefore we performed a pre-analysis in order to identify and exclude subjects that did not show significantµ-activity at all.
For seven of the eight subjects, the µ-band was only slightly different from the 8–12 Hz usually given in the EEG literature. Only one subject showed scarcely any activity in this frequency range but instead a recognizable movement-related desynchronization in the 16–20 Hz band.
Restricted to only the 17 EEG channels that were located over or close to the motor cortex, we calculated the maxi-mum energy of theµ-band using the Welch method [5] for each subject. This feature extraction resulted in one param-eter per trial and channel and explicitly incorporated prior knowledge about the task.
The eight datasets consisting of the Welch-features were classified with linear SVMs (see below) including individ-ual model selection for each subject. Generalization errors were estimated by 10-fold cross-validation. For three subjects the pre-analysis showed very poor error rates close to chance level, and their datasets were excluded from further analysis.
2.3. Data preprocessing
For the remaining five subjects the 5 s windows recorded from each trial resulted in a time series of 1280 sample points per channel. We fitted an autoregressive (AR) model of or-der 3 to the time series3 of all 39 channels using forward-backward linear prediction [6]. The three resulting AR coef-ficients per channel and trial formed the new representation of the data.
The extraction of the features did not explicitly incorpo-rate prior knowledge although autoregressive models have successfully been used for motor-related tasks (e.g., [3]). However, they are not directly linked to theµ-rhythm.
Before AR, datasets from several subjects were combined for cross-subject channel selection, an additional centering and linear scaling of the data was performed. This was done individually for each subject and trial in order to maintain the proportion of corresponding AR coefficients in a trial.
2.4. Notation
Letn denote the number of training vectors (trials) of the datasets (n = 400 for each of the five datasets) and let
d denote the data dimension (d = 3·39 = 117 for all five datasets). The training data for a classifier is denoted as
X = (x(1),. . .,x(n))∈ Rn×d with labelsY =(y
1,. . .,yn) ∈ {−1, 1}n. For the task used in this paper y = −1 denotes
imagined left hand movement and y=1 denotes imagined
3For comparison reasons this choice of the model order is the same as in [2]. For this work different model orders had been compared in the fol-lowing way. For a given order we fitted an AR-model to each EEG sequence. After proper model selection a support vector machine with 10-fold cross-validation (CV) was trained on the AR coefficients. Model order 3 resulted in the best mean CV error.
P9 TP9 FT9
F9 F10
EOG
FT10
TP10
P10
O1 PO7 P7 TP7 T7
FT7 F7
AF7
Fp1 Fpz Fp2 AF8
F8
FT8
T8
TP8
P8
PO8 O2 P5
CP5 C5
FC5
F5 F6
FC6
C6
CP6
P6 PO3 POz
P3 CP3 C3 FC3
F3
AF3 AFz AF4
F4
FC4
C4
CP4
P4
PO4 P1 CP1 C1 FC1
F1 Fz
FCz
Cz
CPz
Pz P2 CP2
C2 FC2 F2
PO9 Oz
O9
PO10 O10 Iz
Figure2: The positions of 39 EEG electrodes used for data acquisi-tion are marked by black circles. The two referencing electrodes are marked by dotted circles. Eight electrodes over or close to the mo-tor cortex are shown in bold circles (positions C1, C2, C3, C4, FC3, FC4, CP3, and CP4).
right hand movement. The termsdimensionandfeatureare used synonymously.
3. CHANNEL SELECTION AND
CLASSIFICATION METHODS
Channel selection algorithms as well as feature selection al-gorithms can be characterized as either filter or wrapper methods [7]. They select or omit dimensions of the data that correspond to one EEG channel depending on a performance measure.
The problem of how to rate the relevance of a chan-nel if nonlinear interactions between chanchan-nels are present is not trivial, especially since the overall accuracy might not be monotonic in the number of features used. Some meth-ods try to overcome this problem by optimizing the selection for feature subsets of fixed sizes (plus-l take-away-r search) or by implementing floating strategies (e.g., floating forward search) [7]. Only few algorithms like genetic algorithms can choose subgroups of arbitrary size during the selection pro-cess. They have successfully been used for the selection of spatial features [8] in BCI applications but are computation-ally demanding.
For the application of EEG channel selection, it is nec-essary to treat certain groups of features homogenously: nu-merical values belonging to one and the same EEG channel have to be dealt with in a congeneric way so that a spatial interpretation of the solution becomes possible.
ξi0.γ
ξi1.γ
γ x(i0)
x(i1)
H
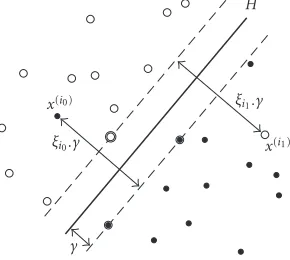
Figure3: Linear SVM. For nonseparable datasets, slack variables ξi are introduced. The bold points on the dashed lines are called
support vectors (SVs). The solution for the hyperplaneH can be written in terms of the SVs. For more detail seeSection 3.1.
3.1. Support vector machines
The support vector machine is a relatively new classification technique developed by Vapnik [9] which has shown to per-form strongly in a number of real-world problems, including BCI [10]. The central idea is to separate dataX ⊂Rd from
two classes by finding a weight vectorw∈Rd and an offset b∈Rof a hyperplane
H:Rd−→ {−1, 1},
x−→sign (w·x+b) (1)
with the largest possible margin,4which apart from being an intuitive idea has been shown to provide theoretical guar-antees in terms of generalization ability [9]. One variant of the algorithm consists of solving the following optimization problem:
min
w∈Rdw
2 2+C
n
i=1
ξ2
i
s.t.yiw·x(i)+b≥1−ξi (i=1,. . .,n). (2)
The parametersξi are called slack variables and ensure that the problem has a solution in case the data are not linear sep-arable5(seeFigure 3). The margin is defined asγ(X,Y,C)= 1/w2. In practice one has to trade offbetween a low train-ing error, for example,ξi2, and a large marginγ. This trade
offis controlled by the regularization parameterC. Finding a good value forCis part of the model selection procedure. If no prior knowledge is availableChas to be estimated from the training data, for example, by using cross-validation. The value 2/Cis also referred to as theridge. For a detailed dis-cussion please refer to [11].
4IfXis linear separable the margin of a hyperplane is proportional to the distance of the hyperplane to the closest pointx∈X.
5If the data are linear separable the slack variables can improve the gen-eralization ability of the solutions.
3.2. Recursive channel elimination
This channel selection method is derived from the recursive feature elimination method prosed by Guyon et al. [12]. It is based on the concept of margin maximization. The impor-tance of a channel is determined by the influence it has on the margin of a trained SVM. LetWbe the inverse of the margin
W(X,Y,C) := 1
γ(X,Y,C)= w2. (3)
Let X−j be the data with features j removed and Y−j the
corresponding labels. In the original version one SVM is trained during each iteration and the features ˆjwhich mini-mize|W(X,Y,C)−W(X−j,Y−j,C)|are removed (typically,
i.e., one feature only); this is equivalent to removing the di-mensions ˆjthat correspond to the smallest|wj|. For channel selection this method was adapted in the following way.
Let Fk ⊂ {1,. . .,d} denote the features from chan-nel k. For each channel k we define the score sk := (1/|Fk|)l∈Fk|wl|. At each iteration we remove the channels
with the lowest score. If no prior knowledge is available the parameterChas to be estimated from the training data.
3.3. Generalization error estimation
For model selection purposes we estimated the generaliza-tion error of classifiers via 10-fold cross-validageneraliza-tion.
If the generalization error of a channel selection method had to be estimated, a somewhat more elaborated proce-dure was used. An illustration of this proceproce-dure is given in Figure 4.
The whole dataset is split up into 10 folds (F1toF10) as for usual cross-validation. In each foldF, the channel selec-tion (CSinFigure 4) is performed based on the training set of
Fonly, leading to a specific ranking of the 39 EEG channels. For each foldF, 39 classifiersCh
F,h=1,. . ., 39, are trained as
follows:Ch
Fis trained on thehbest6channels, respectively, of
the train set ofFand tested on the corresponding channels of the test set ofF. For each fold, this results in 39 test errors (E1
FtoE39F).
During the last step, the corresponding test errors are av-eraged over all folds. This leads to an estimate of the general-ization error for every number of selected channels.
4. EXPERIMENTS AND RESULTS
The successful transfer of EEG channel rankings of one sub-ject to another can be difficult for several reasons.
(i) The head shapes might vary between subjects. This limits the comparability of electrode positions and channel selection outcomes.
(ii) Subjects might use different mental representations for a task, even if they are instructed carefully.
Average over 10 folds:
φ
E1· · ·E39 E1F10· · ·E39F10 F10 TestF10
C1
F10· · ·CF1039 10 folds ..
.
. . .
. . .
. . . E1
F2· · ·E39F2 .
. . Data
F2
TestF2
C1 F2· · ·C39F2 TrainF2
CS 1 2· · ·
· · ·39
E1F1· · ·E39F1 F1
TestF1 TrainF1
CS
C1 F1· · ·C39F1
Calculate 39 test errors for fold F1 1 2· · ·
· · ·39 fortrain classifierh=1 : 39 Ch
onhbest channels end
Ranking of channels
Figure4: Illustration of the procedure for channel selection and error estimation using cross-validation.
(iii) Cortex areas important for the mental task are prob-ably organized slightly differently between subjects. This limits the comparability of localized activity pat-terns.
Luckily motor imagery tasks involve a comparably big part of the cortex. As a result small dislocations of EEG elec-trodes (e.g., around typical motor positions C3 and C4, see Section 2) usually do not lead to profound error increase for the classification of brain activity.
Nevertheless it is very important to investigate the reli-ability of cross-subject channel selection: on the one hand, even a slightly increased classification error leads to a large drop in the information rate for a BCI system [13]; on the other hand, mental tasks that do not show the advantages of motor imagery will more and more be focused on by BCI re-search in order to expand existing systems to multiclass BCIs or for increasing the information rate of patients whose mo-tor areas are not intact.
The following subsections show results for the recur-sive channel elimination method on cross-subject data. In Section 4.1RCE is applied to combined data of all five sub-jects. Results are compared with the individual channel rank-ings obtained from the five subjects. InSection 4.2the trans-fer of rankings is investigated: RCE calculates rankings of data combined from 4 subjects before these rankings are tested on the corresponding remaining unseen dataset of the last subject.
4.1. Channel selection on combined data
We applied the channel selection method of recursive chan-nel elimination (RCE) introduced inSection 3on a training dataset that was combined from the five AR datasets.
The estimation of the average generalization error for all 39 stages of the channel selection process with RCE was car-ried out using linear SVMs as classifiers with parameter C
previously determined by 10-fold cross-validation.7 Details about the 10-fold cross-validation process for channel selec-tion are described inSection 3.3andFigure 4.Figure 5shows the development of the estimated classification error for all 39 steps of the RCE.
For this combined dataset the test error was minimal (26.9%) when using data from 32 or more EEG channels but further reduction down to 24 channels increased the test error only marginally. Reducing the number of channels to fewer than the best 17 channels leads to a strong increase of the test error.
Throughout the ranking in the table ofFigure 5, artifact or task-irrelevant channels appear only in the last ranks (e.g., EOG, occipital channels, FT9, FT10, etc.). Direct compari-son between Figures1and5reveal that the curve inFigure 1 shows smaller error rates. The performance of a classifier trained on the RCE channels of combined data is worse than the average performance of classifiers trained on the individ-ual RCE channels of single subject data.
4.2. Transfer of channel selection
outcomes to new subjects
In this section we analyze whether there exists a general good subgroup of EEG channels (i.e., a subgroup of chan-nels that perform well for all subjects) for a fixed mental task and whether this subgroup can be determined by the RCE method. We describe different methods to obtain chan-nel rankings, some of which include the data of more than one subject. However these rankings are always tested on the data of one subject only.Table 1provides an overview over all ranking modes.
Cross-subject modes
We iterate the following process. One subject is removed from the combined data base. We perform the RCE on the remaining data which leads to a channel ranking.
We use this ranking in two different ways to obtain test errors via 10-fold cross-validation on the data of the removed subject.
(i)Best 8 (cross). The channel subset used for testing con-sists of the eight best-ranked channels. The resulting 8 best channels are plotted inFigure 6.
(ii) Bestn (cross). The channel subset used for testing consists of thenbest-ranked channels. The numbernis cho-sen such that the expected cross-validation error on the four
0 5 10 15 20 25 30 35 40 Bestnremaining channels
0.25 0.3 0.35 0.4 0.45 0.5
Te
st
er
ro
r
Rank Position Rank Position 1
2 3 4 5 6 7 8 9 10 11 12 13 14 15 16 17 18 19 20
21 22 23 24 25 26 27 28 29 30 31 32 33 34 35 36 37 38 39 CP2 CP1 FC2 FCz F1 C4 FC4
C2 F2 C1 C3 CPz FC3 FT7 FC1 C6 CP4
P6 C5 O2
POz F6 AFz TP8 Cz P1 CP3
P2 FT9 P5 FT10
TP7 FT8 Fp2 F5 O1 O9 EOG O10
Figure5: RCE results for a combined dataset of all 5 subjects. The graph shows a test error estimation for thenbest channels. The error values were estimated by 10-fold crossvalidation. The table on the right shows the channel ranking performed on the combined data. Eight channels which are located over or close to the motor cortex (seeFigure 2) are printed with grey background. The surface map visualizes this ranking. The 24 best-ranked electrodes were mapped to grey scale values. Bright areas of the surface map correspond to relevant channels (according to RCE) whereas dark areas show less-relevant electrodes.
Table1: Ranking modes overview: explanation of the ranking modes used for the comparison shown inFigure 7. The rankings were calcu-lated on different kinds of datasets: on data from single subjects or (for cross-subject tests) on combined datasets (4-fold cross-validation). Testing of the ranking modes was always performed on the data of one single subject.
Mode Ranking method Ranking based on Description
Motor 8 A priori knowledge Single subject 8 channels over or close to motor cortex
Random 8 (Random) Single subject 8 channels
Best n (single) RCE Single subject nchannels
with highest rank that minimize CV error
Best 8 (single) RCE Single subject 8 channels
with highest rank
Best n (cross) RCE Four subjects nchannels
with highest rank that minimize CV error
Best 8 (cross) RCE Four subjects 8 channels
with highest rank
subjects is minimized. Note that this choice does not depend on the data of the fifth test subject.
As this process is repeated for every subject that was left out, we can average the error values of the modes Best 8 (cross)andBestn(cross)over five repetitions.
For comparison: single-subject modes
For the fixed mental task of motor activity and imagery, the EEG literature suggests the channels CP3, CP4, and adja-cent electrodes (e.g., [3]). Our guess at generally good sub-group of EEG channels is thus the electrode set: FC3, FC4, C1, C2, C3, C4, CP3, CP4 (see electrodes marked in boldface in Figure 2). The corresponding test mode is referred to as
Motor 8.
If no prior knowledge of a task and no channel selection were available, a random choice of channels would be the sin-gle solution. For comparison reasons we include the mode
Random 8. Its test error is the average of ten repetitions of choosing eight random channels, optimizing the regulariza-tion parameterCand testing this random subset via 10-fold cross-validation on the data of one subject.
Without subject A P9 TP9 FT9 F9 F10 EOG FT10 TP10 P10 O1 PO7 P7 TP7 T7 FT7 F7 AF7
Fp1 Fpz Fp2 AF8 F8 FT8 T8 TP8 P8 PO8 O2 P5 CP5 C5 FC5 F5 F6 FC6 C6 CP6 P6 PO3 POz P3 CP3 C3 FC3 F3
AF3 AFz AF4
F4 FC4 C4 CP4 P4 PO4 P1 CP1 C1 FC1 F1 Fz FCz Cz CPz Pz P2 CP2 C2 FC2 F2
Without subject B P9 TP9 FT9 F9 F10 EOG FT10 TP10 P10 O1 PO7 P7 TP7 T7 FT7 F7 AF7
Fp1 Fpz Fp2 AF8 F8 FT8 T8 TP8 P8 PO8 O2 P5 CP5 C5 FC5 F5 F6 FC6 C6 CP6 P6 PO3 POz P3 CP3 C3 FC3 F3
AF3 AFz AF4
F4 FC4 C4 CP4 P4 PO4 P1 CP1 C1 FC1 F1 Fz FCz Cz CPz Pz P2 CP2 C2 FC2 F2
Without subject C P9 TP9 FT9 F9 F10 EOG FT10 TP10 P10 O1 PO7 P7 TP7 T7 FT7 F7 AF7
Fp1 Fpz Fp2 AF8 F8 FT8 T8 TP8 P8 PO8 O2 P5 CP5 C5 FC5 F5 F6 FC6 C6 CP6 P6 PO3 POz P3 CP3 C3 FC3 F3
AF3 AFz AF4
F4 FC4 C4 CP4 P4 PO4 P1 CP1 C1 FC1 F1 Fz FCz Cz CPz Pz P2 CP2 C2 FC2 F2
Without subject D P9 TP9 FT9 F9 F10 EOG FT10 TP10 P10 O1 PO7 P7 TP7 T7 FT7 F7 AF7
Fp1 Fpz Fp2 AF8 F8 FT8 T8 TP8 P8 PO8 O2 P5 CP5 C5 FC5 F5 F6 FC6 C6 CP6 P6 PO3 POz P3 CP3 C3 FC3 F3
AF3 AFz AF4
F4 FC4 C4 CP4 P4 PO4 P1 CP1 C1 FC1 F1 Fz FCz Cz CPz Pz P2 CP2 C2 FC2 F2
Without subject E P9 TP9 FT9 F9 F10 EOG FT10 TP10 P10 O1 PO7 P7 TP7 T7 FT7 F7 AF7
Fp1 Fpz Fp2 AF8 F8 FT8 T8 TP8 P8 PO8 O2 P5 CP5 C5 FC5 F5 F6 FC6 C6 CP6 P6 PO3 POz P3 CP3 C3 FC3 F3
AF3 AFz AF4
F4 FC4 C4 CP4 P4 PO4 P1 CP1 C1 FC1 F1 Fz FCz Cz CPz Pz P2 CP2 C2 FC2 F2
With all subjects P9 TP9 FT9 F9 F10 EOG FT10 TP10 P10 O1 PO7 P7 TP7 T7 FT7 F7 AF7
Fp1 Fpz Fp2 AF8 F8 FT8 T8 TP8 P8 PO8 O2 P5 CP5 C5 FC5 F5 F6 FC6 C6 CP6 P6 PO3 POz P3 CP3 C3 FC3 F3
AF3 AFz AF4
F4 FC4 C4 CP4 P4 PO4 P1 CP1 C1 FC1 F1 Fz FCz Cz CPz Pz P2 CP2 C2 FC2 F2
Motor8
Random8
Best n(single)
Best8 (single)
Best n(cross)
Best8 (cross)
A B C D E Average
Test subject 0
0.05 0.1 0.15 0.2 0.25 0.3 0.35 0.4
Te
st
er
ro
r
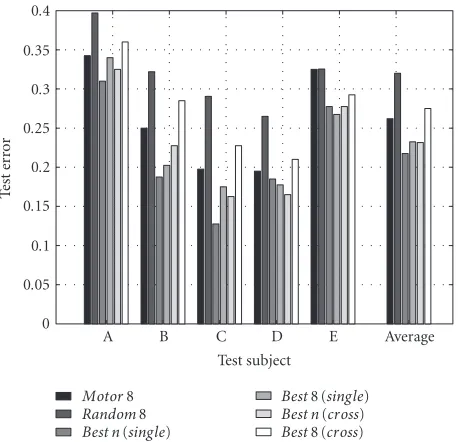
Figure 7: Comparison of the test errors of six different ranking modes for single subjects (A to E) and the test errors of these modes averaged over the five subjects (Average). For each mode and sub-ject, the regularization parameterCwas estimated separately. All test errors were obtained using 10-fold CV. The first modeMotor 8 tests the classification error for 8 channels over or close to the motor cortex, whereasRandom 8is based on 8 randomly chosen channels. ModesBestn(single)andBest 8 (single)test channel sets whose rankings were calculated based on the specific subject only. ModesBestn(cross)andBest 8 (cross)test channel sets whose rank-ings were calculated based on all other subject’s data but did not incorporate data from the test subject.
channels [2] that might not be present in data from other subjects.
Figure 7shows the results for the 6 modes. The right-most block contains an average taken over subjects for each of the modes. From the average results we observe the fol-lowing.
(i) The 8 motor channels are not optimal:Best 8 (single)
performs much better.8
(ii) ModeBest 8 (cross)performs almost as well as the motor channel mode. Although we conclude that the RCE method fails to find an optimal channel subset, the results suggest that when transferring channel positions across sub-jects the expected performance is not much worse than the one using prior knowledge.
(iii) The subset of 8 random channels performs surpris-ingly well. This finding suggests that the structure of the data can successfully be captured by the SVM even if only few channels close to the motor cortex are contained in the chan-nel subset. However all other modes show better error esti-mations.
8InFigure 1the choice of motor channels results in a lower classification error than the error from the RCE method. This is due to the fact that the regularization parameterCor ridge was not optimized for a specific ranking as was done in this study.
(iv) The performance ofBestn(cross)mode is compara-ble to the results of theBest 8 (single)mode (23%); never-theless this comparison is unfair since on average 27 chan-nels were used. The cross-validation averaged over the five subjects is 26% for the choice of 27 random channels (not plotted inFigure 7).
(v) The best performing mode isBestn(single). On aver-age it only usesn=14 channels and yields an error as low as 21.8%.
5. CONCLUSION
The recursive channel elimination (RCE) method was ap-plied to EEG channel selection in the context of signal classi-fication for a Brain-Computer interface (BCI) system.
All experiments were based on data from five subjects recorded during a motor imagery task comprising imagined left and right hand movement.
For individual subject we analyzed the performance of three different types of rankings: (i) ranking including chan-nels over the motor cortex only, (ii) ranking obtained by RCE from the data of that subject, (iii) ranking obtained by RCE from the data of the other four subjects.
We obtained best results with RCE rankings from sin-gle subjects. A comparison reveals that they outperform mo-tor rankings (including prior knowledge about the task) by about 5% absolute error.
The transfer of RCE rankings from the data of multiple subjects to a new subject leads to a small decrease in perfor-mance. The difference to the performance of motor rankings turns out to be less than 2% on average.
We conclude that individual channel ranking is prefer-able over cross-subject ranking for the experimental paradigm investigated here.
However for the first time, it could be shown that RCE cannot only successfully be used to select channels for indi-vidualsubjects, but that RCE rankings on the combined data of multiple subjects are consistently in agreement with the EEG literature on motor imagery tasks, and can still yield er-ror rates as low as 17% on unseen subjects.
ACKNOWLEDGMENTS
The authors would like to thank Bernd Battes and Professor Dr. Kuno Kirschfeld for their help with the EEG recordings. Special thanks to Dr. Jason Weston for his help on feature selection topics. This work have been supported in part by DFG (AUMEX RO 1030/12), NIH, and the IST Programme of the European Community, under the PASCAL Network of Excellence, IST-2002-506778. Thomas Navin Lal was sup-ported by a grant from the Studienstiftung des deutschen Volkes.
REFERENCES
[2] T. N. Lal, M. Schr¨oder, T. Hinterberger, et al., “Support vector channel selection in BCI,”IEEE Trans. Biomed. Engineering, vol. 51, no. 6, pp. 1003–1010, 2004.
[3] G. Pfurtscheller, C. Neuper, A. Schlogl, and K. Lugger, “Sep-arability of EEG signals recorded during right and left mo-tor imagery using adaptive aumo-toregressive parameters,”IEEE Trans. Rehab. Eng., vol. 6, no. 3, pp. 316–325, 1998.
[4] G. Pfurtscheller and F. H. Lopes da Silva, “Event-related EEG/MEG synchronization and desynchronization: basic principles,” Clinical Neurophysiology, vol. 110, no. 11, pp. 1842–1857, 1999.
[5] P. D. Welch, “The use of fast Fourier transform for the esti-mation of power spectra: a method based on time averaging over short, modified periodograms,”IEEE Trans. Audio Elec-troacoust., vol. 15, no. 2, pp. 70–73, 1967.
[6] S. Haykin,Adaptive Filter Theory, Prentice-Hall, Upper Saddle River, NJ, USA, 1996.
[7] P. Pudil, F. J. Ferri, J. Novovicova, and J. Kittler, “Floating search methods for feature selection with nonmonotonic cri-terion functions,” inProc. 12th International Conference on Pattern Recognition (ICPR ’94), vol. 2, pp. 279–283, Jerusalem, Israel, October 1994.
[8] M. Schr¨oder, M. Bogdan, W. Rosenstiel, T. Hinterberger, and N. Birbaumer, “Automated EEG feature selection for brain computer interfaces,” inProc. 1st International IEEE EMBS Conference on Neural Engineering, pp. 626–629, Capri, Italy, March 2003.
[9] V. N. Vapnik,Statistical Learning Theory, John Wiley & Sons, New York, NY, USA, 1998.
[10] B. Blankertz, G. Curio, and K. M¨uller, “Classifying single trial EEG: towards brain computer interfacing,” in Advances in Neural Information Processing Systems, T. K. Leen, T. G. Di-etterich, and V. Tresp, Eds., vol. 14, MIT Press, Cambridge, Mass, USA, 2001.
[11] B. Sch¨olkopf and A. Smola,Learning with Kernels, MIT Press, Cambridge, Mass, USA, 2002.
[12] I. Guyon, J. Weston, S. Barnhill, and V. Vapnik, “Gene selec-tion for cancer classificaselec-tion using support vector machines,” Machine Learning, vol. 46, no. 1-3, pp. 389–422, 2002. [13] A. Schl¨ogl, C. Keinrath, R. Scherer, and G. Pfurtscheller,
“In-formation transfer of an EEG-based brain-computer inter-face,” inProc. 1st International IEEE EMBS Conference on Neu-ral Engineering, pp. 641–644, Capri, Italy, March 2003.
Michael Schr¨oderreceived his Diploma in computer science in 2000. Currently he is a Ph.D. student at the Department for Com-puter Engineering (Professor Rosenstiel) at the Eberhard-Karls-Universit¨at T¨ubingen in Germany. His research interests include ma-chine learning, brain-computer interface systems, and signal processing.
Thomas Navin Lal received his Diploma in mathematics in 2001 and spent one year with the machine learning group of Professor Dr. Thomas Hofmann at Brown University, Providence, RI. He is currently a Ph.D. student of Professor Dr. Bern-hard Sch¨olkopf at the Max Planck Institute for Biological Cybernetics, T¨ubingen, Ger-many. He is a researcher at the PASCAL network of excellence and is currently
sup-ported by a grant from the Studienstiftung des deutschen Volkes.
Thilo Hinterbergerreceived his Diploma in physics from the University of Ulm, Ger-many, and received his Ph.D. degree in physics from the University of T¨ubingen, Germany, in 1999, on the development of a brain-computer interface, called “Thought Translation Device.” He is currently a Re-search Associate with the Institute of Med-ical Psychology and Behavioral Neurobiol-ogy at the University of T¨ubingen,
Ger-many. His primary research interests focus on the further devel-opment of brain-computer interfaces and their applications and also on the development of EEG classification methods and the investigation of neuropsychological mechanisms during the oper-ation of a BCI using functional MRI. He is a Member of the Soci-ety of Psychophysiological Research and the Deutsche Physikalische Gesellschaft (DPG).
Martin Bogdan received the Engineer Diploma in signal engineering from the Fachhochschule Offenburg, Germany, in 1993, and the Engineer Diploma in in-dustrial informatics and instrumentation from the Universit`e Joseph Fourier Greno-ble, France, in 1993. In 1998, he received the Ph.D. degree in computer science (com-puter engineering) from the University of T¨ubingen, Germany. In 1994, he joined
the Department of Computer Engineering at the University of T¨ubingen, where, since 2000, he has headed the research group NeuroTeam. This research group deals mainly with signal process-ing based on artificial neural nets and machine learnprocess-ing focused on, but not limited to, biomedical applications.
N. Jeremy Hill graduated in experimen-tal psychology at the University of Oxford, UK, in 1995. Until 2001 he was a Research Assistant, Programmer, and finally a doc-toral student in the psychophysics labora-tory of Dr. Bruce Henning in Oxford. He re-ceived the Ph.D. degree in 2002, for a doc-toral thesis on psychophysical statistics en-titled “Testing hypotheses about psychome-tric functions.” Since then he has been part
of Professor Bernhard Sch¨olkopf ’s Department for Empirical Infer-ence for Machine Learning and Perception at the Max Planck Insti-tute for Biological Cybernetics in T¨ubingen, Germany, and now he focuses on brain-computer interface research.
Niels Birbaumerwas born in 1945. He re-ceived his Ph.D. degree in 1969, in bio-logical psychology, art history, and statis-tics, from the University of Vienna, Aus-tria. From 1975 to 1993, he was a Full Professor of clinical and physiological psy-chology, University of T¨ubingen, Germany. From 1986 to 1988, he was a Full Profes-sor of psychology, Pennsylvania State Uni-versity, USA. Since 1993, he has been a
Wolfgang Rosenstiel is Professor at the University of T¨ubingen and is the Chair of Computer Engineering. He is also the Man-aging Director of the Wilhelm Schickard In-stitute at T¨ubingen University, and the Di-rector of the Department for System Design in Microelectronics at the Computer Sci-ence Research Centre (FZI). He is on the Ex-ecutive Board of the German Edacentrum. His research areas include artificial neural
networks, signal processing, embedded systems, and computer ar-chitecture.
Bernhard Sch¨olkopf received an M.S. de-gree in mathematics (University of London, 1992) and a Diploma in physics (Eberhard-Karls-Universit¨at T¨ubingen, 1994), and a Ph.D. degree in computer science (Techni-cal University Berlin, 1997). He won the Li-onel Cooper Memorial Prize of the Uni-versity of London, the Annual Dissertation Prize of the German Association for Com-puter Science (GI), and the Prize for the