R E S E A R C H
Open Access
A two-stage approach using Gaussian mixture
models and higher-order statistics for a
classification of normal and pathological voices
Ji Yeoun Lee
Abstract
A two-stage classifier is used to improve the classification performance between normal and pathological voices. A primary classification between normal and pathological voices is achieved by the Gaussian mixture model (GMM) log-likelihood scores. For samples that do not meet the thresholds for normal or disordered voice in the GMM, the final decision is made by a higher-order statistics (HOS)-based parameter. The normalized skewness and kurtosis, and means of the normalized skewness and kurtosis were estimated using a sustained vowel /a/ from 53 normal and 173 pathological voices taken from the Disordered Voice Database. Mel-frequency cepstral coefficients (MFCC)-based GMM, the HOS methods, and a two-stage classifier (MFCC)-based on the GMM-HOS were performed for each voice signal. A Mann–Whitney rank sum test was used to detect differences in the means of the HOS-based parameters. A fivefold cross-validation scheme was performed to test the classification method. When 16 Gaussian mixtures were used, the MFCC-based GMM algorithm is performed with 92.0% accuracy. When means of the normalized skewness and kurtosis were used, performances of 82.31 and 83.67% were obtained, respectively. The two-stage classifier with 16 Gaussian mixtures and the mean of the normalized kurtosis classified samples with a 96.96% accuracy were obtained. The proposed two-stage classifier is more accurate than the MFCC-based GMM and HOS methods alone and shows potential for the classification of voices in the clinic.
Keywords:Pathological voice detection, Higher-order statistics, Gaussian mixture model, Two-stage classifier
Introduction
Speech is integral to day-to-day communication. Speech impediments negatively impact social interactions lead-ing to interest in early detection and treatment of voice disorders. Many researchers have worked towards the goal of automatic and objective classification between normal and pathological voices using minimally invasive methods. A large amount of research has focused on the automatic detection of voice pathologies by means of acoustic analysis, parametric and non-parametric feature extraction, pattern recognition algorithms, and statistical methods [1-15].
Sáenz-Lechón et al. [5] presented an overview of previ-ous classification schemes applied to the Massachusetts Eye & Ear Infirmary (MEEI) Voice Disorders Database
[16]. They described some methodological concerns to be considered when designing automatic systems for pathological voice detection. They recommended the use of a commercially well-known database, a cross-validation strategy based on several partitions to obtain averaged classification performances with confidence intervals, a report of the means of a detection error trade-off (DET), and an investigation of the area under receiver operating characteristic (ROC) curves.
The emergence of attractive pattern classification algo-rithms such as the Gaussian mixture model (GMM), neural network (NN), and hidden Markov model has received attention as a potential means to discriminate between normal and pathological voices [6-13]. The GMM has especially been reported as a very successful classification method [10-13]. Characteristic parameters, such as Mel-frequency cepstral coefficients (MFCC), have also become more popular for voice pathology de-tection [6,8,10-12]. Recently, Wang et al. [12] proposed Correspondence:[email protected]
MII826, Biomedical Engineering, The Department of Biomedical Engineering, Jungwon University, Donbu-ri #5, Goesan-eup, Goesan-gun,
Chungcheongbuk-do 367-805, South Korea
a GMM supervector kernel-support vector machine (GMM-SVM) classifier which was compared with the GMM classifier as a baseline algorithm. The GMM supervectors were largely effective parameters for the discrimination of normal and pathological voices. A clas-sification accuracy of 96.1% was achieved by SVM classi-fication of the 16 Gaussian GMM supervectors [12].
As an acoustic analysis method, higher-order statistics (HOS) have shown promising results in a number of signal processing applications, and are of particular value when dealing with a mixture of Gaussian and non-Gaussian processes and system nonlinearity [14,15,17,18]. The application of HOS to speech processing has primar-ily been motivated by its inherent Gaussian suppression and phase preservation properties [17,18]. Researches in the disordered voice field have been based on the assump-tion that speech has non-zero HOS that is distinct from that of Gaussian noise [18,19]. Alonso et al. [19] proposed seven new HOS-based parameters that were obtained dir-ectly or indirdir-ectly starting from the bispectrum of a voice frame. A success rate of 98.3% was obtained by using both the conventional and the HOS-based parameters with an NN classifier demonstrating the possibility of automatic-ally discriminating pathological from healthy voices using HOS parameters [20]. Further study of how well each HOS parameter can detect pathological voices with the methodological designs recommended by Sáenz-Lechón et al. [5] is merited.
In this article, we propose new HOS-based parameters implemented in the time domain. They are means of the normalized skewness and kurtosis which are calculated from each frame and averaged in a sentence. The HOS-based parameters estimated in the time domain can eas-ily be applied to a real-time environment in contrast to the Fourier series representation of the HOS parameters in frequency domain applied by Alonso et al. [19]. Sec-ond, we propose a two-stage approach to further im-prove the accuracy of the classification between normal and pathological voices. The classification system con-sists of a MFCC-based GMM algorithm which describes the primary classification achieved by the GMM log-likelihood scores, and an HOS-based parameter as a post-processor.
Material and methods Material
Vocal signals were collected from the MEEI Voice Dis-orders Database [16]. Fifty-three normal and one hun-dred seventy-three pathological speakers with a wide range of organic, neurological, traumatic, and psycho-genic voice disorders were selected. The extracted subset is the same as one described in the study of Wang et al. [12] to compare the result with this study. Voice samples were collected in a controlled environment and sampled
with a 50- or 25-kHz sampling rate and 16 bits of reso-lution. Patients phonated a sustained /a/ (1–3 s). All voice data were down-sampled to 25 kHz and grouped into training (70% of the data) and test (30%) sets to implement all methods. Each set for a fivefold cross-validation scheme was randomly selected from the subset [10,12].
Statistical analysis
Statistical analysis was conducted using Sigma Stat 3.0 (Jandel Scientific, SanRafael, CA, USA). The Mann– Whitney rank sum test was performed to test the differ-ences between normal and pathological voices for the normalized skewness, the normalized kurtosis, and the means of the normalized skewness and kurtosis. A p-value of 0.05 was used for all measures.
MFCC-based GMM method
The voice samples were analyzed with 40-ms interval overlapping 20-ms with the previous frame and multi-plied by a hamming window as performed in previous studies [12]. MFCC parameters were extracted and fed into a GMM-based detector enabling a final decision about the absence or presence of pathology. The number of the filter banks was 38, and 36-dimensional MFCC parameters (18 MFCC + 18 Delta-MFCC) with 1 deriva-tive were calculated every frame of 18 Mel-cepstral coef-ficients as in Wang et al. [12]. Cepstral mean subtraction was also used during the extraction to reduce the ceps-tral bias of the recording channel. The Linde–Buso– Gray algorithm was used for the GMM initialization and the GMM having 8, 16, and 32 mixtures were trained with the expectation-maximization (EM) algorithm to determine the model parameters such as mean vectors, covariance matrices, and mixture weights. For an utter-ance X ¼fx1;x2;. . .:xTg, where T is the number of frames, the log-likelihood ratio (LLR) applying Bayes’ rule, disregarding the constant prior probabilities in the log domain, is presented in Equation (1).
Λð Þ ¼X log p XN
λC
log p XP
λC
ð1Þ
where Λ(X) is the LLR, and λC and λC are GMM models for normal and pathological voices, respect-ively. Also N and P indicate normal and pathological voices, respectively.
pathological if Λ(X) <ΛNP(X) and normal if Λ(X) >ΛNP (X).
HOS method
A speech signal, x(n), which may be normal or patho-logical, can be expressed as given in Equation (2) [17].
x nð Þ ¼s nð Þ þw nð Þ ð2Þ
where s(n) is a non-Gaussian signal generated by the oscillation of the vocal folds and w(n) is Gaussian noise which can be assumed to be zero in normal voices and not to be zero in pathological voices.
Pathological voices are corrupted by noise,w(n), which is directly related to the perceived roughness of the voice [1-3,20]. If s(n) and w(n) are statistically independent, then the energy of x(n) is the sum of speech and noise energies: Ex=Es+Ew. Second-order statistics are thus directly affected in an additive way by the presence of noise [17,19]. However, when HOS analysis is applied to pathological voices, unstable and discontinuous statistics of x(n) may be estimated because HOS analysis is blind to Gaussian processes. On the other hand, in a normal voice, the HOS of only non-Gaussian measurements may be extracted because a Gaussian noise can be assumed to be zero. The variation of a non-Gaussian sig-nal which is produced by vibration of the vocal folds can be an important clue for the classification of pathological and normal voices.
If x(n), where n= 0, ±1, ± 2, . . . , is a real stationary discrete-time signal and its moments up to order p exist, then its pth-order moment function is given by
Equation (3).
mp τ1;τ1;⋯;τp1
≡E x nð Þx nð þτ1Þ⋯x nþτp1
ð3Þ
And it depends only on the time differences τ1, τ2,. . ., τp−1,τi= 0, ± 1, ± 2, . . .for alli. Here, E{•} denotes statis-tical expectation and for a deterministic signal, it is replaced by a time summation over all time samples or time averaging. In addition, if the signal has zero mean, then its cumulant functions (up to order four) are given by Equation (4) [17].
secondorder cumulant:C2ð Þ ¼τ1 m2ð Þτ1 ð4Þ
thirdorder cumulant:C3ðτ1;τ2Þ ¼m3ðτ1;τ2Þ; fourthorder cumulant:C4ðτ1;τ2;τ3Þ ¼m4ðτ1;τ2;τ3Þ
m2ð Þτ1 ·m2ðτ3τ2Þ m2ð Þτ2 ·m2ðτ3τ1Þ m2ð Þτ3 ·m2ðτ2τ1Þ
By setting all the lags to zero in the above cumulant expressions, we can obtain the variance, skewness, and kurtosis.
Variance:γ2≡C2ð Þ ¼0 E x2ð Þn
; ð5Þ Skewness:C3ð0;0Þ ¼E x3ð Þn
;
Kurtosis:C4ð0;0;0Þ ¼E x4ð Þn
3E x 2ð Þn 2
When estimating HOS from finite data records, the variance of the estimators is reduced by normalizing the input data to have a unity variance, prior to computing the estimators. Equivalently, the third- and fourth-order statistics are normalized by the appropriate powers of the data variance, thus we define the normalized skew-ness and kurtosis as shown in Equations (6) and (7) [17].
Normalized skewness: γ3≡
C3ð0;0Þ
C2ð Þ0
½ 1:5¼
E xf 3ð Þn g
E xf 2ð Þn g
½ 1:5 ð6Þ
Normalized kurtosis: γ4≡
c4ð0;0;0;Þ
c2ð Þ0
½ 2 ¼
E xf 4ð Þn g
E xf 2ð Þng
½ 23:0 ð7Þ
In this article, the normalized skewness and kurtosis are extracted in frame as shown in Equation (8).
γ3t¼
XN
n¼1
x3
tð Þn
XN
n¼1
x2
tð Þn
" #1:5; γ4t ¼
XN
n¼1
x4
tð Þn
XN
n¼1
x2
tð Þn
" #2 ð8Þ
where xtis the speech sample value oftth frame and N is the number of samples.
The proposed HOS-based parameters are means of the normalized skewness and kurtosis: γ3 and γ4. They are estimated in a sentence and have their roots in γ3 and γ4 as described in Equation (9). As in the MFCC procedures, voice samples were cut into 40-ms overlap-ping frames which were shifted by 20 ms and multiplied by a hamming window to extract the HOS-based para-meters.
γ3 ¼
1
T
XT
t¼1
γ3t; γ4¼ 1
T
XT
t¼1
γ4t ð9Þ
where γ3t and γ4t are γ3 and γ4 extracted in the t th frame, respectively, andTis the number of the frames.
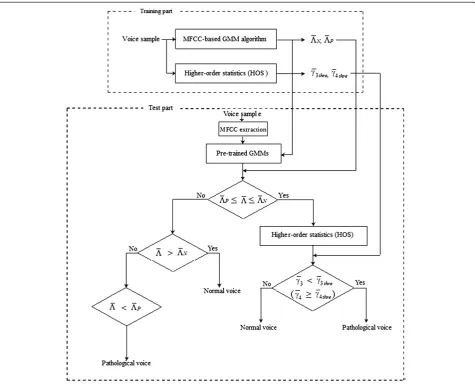
Two-stage classifier based on GMM-HOS
The block diagram of the proposed algorithm is shown in Figure 2. In the training phase, the MFCCs from the
voice samples are extracted for each analysis frame. ΛN
and ΛP indicate the thresholds of the LLR estimated by
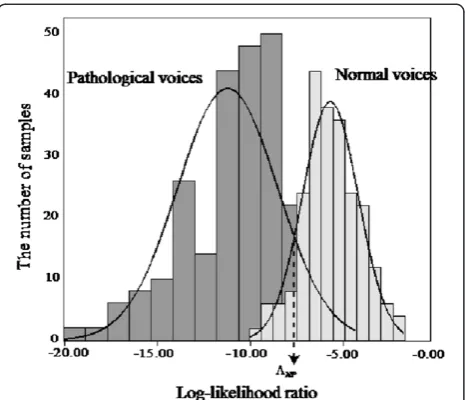
each GMM for normal and pathological voices. An ex-ample is shown in Figure 3 with false acceptance and false rejection plots versus LLR thresholds. Both lines cross over the equal error rate (EER).ΛN and ΛP are the
LLR values determined when the EER is 25.0%. The thresholds, γ3thre and γ4thre, are determined in advance according to the values to produce the best results when
γ3 or γ4 are used alone for the pathological voice detec-tion. That is, they are computed for the training data set. In the test phase, the LLR, Λ, is estimated with the feature vector and the pre-trained GMMs. The primary decision is executed by the MFCC-based GMM algo-rithm. If ΛP≤Λ≤ΛN, the voice samples are processed
using the HOS operator. The final decision is realized after calculatingγ3 andγ4. The values of γ3 and γ4 are
independently used to classify normal and pathological voice. When γ3 is used, the voice is said to be patho-logical ifγ3 <γ3threand normal ifγ3≥γ3thre. When γ4is used, the voice is said to be normal if γ4<γ4thre and pathological ifγ4≥γ4thre.
Results
MFCC-based GMM method
The performance was assessed by averaging the results obtained from fivefold cross-validation scheme [10,12]. Table 1 shows the confusion matrix, accuracy (%) in-cluding 95% confidence intervals (CIs), specificity (%), sensitivity (%), and areas under the curve (AUC) accord-ing to the number of the Gaussian mixtures. Specificity and sensitivity means the test’s ability to identify nega-tive and posinega-tive results, respecnega-tively. The accuracy is the proportion of true results (both true positives and true negatives) in the population. The GMM models were trained using 8, 16, and 32 mixtures. The average performance was 92.00% when the number of Gaussian
mixtures was 16. The result using 32 Gaussian mixtures was also better than one obtained with 8 Gaussian mix-tures. Figure 4 shows the area under the ROC curve when MFCC-based GMM method shows the best accur-acy. The EER of the MFCC-based GMM method is shown in Figure 5.
HOS method
Figure 6 presents the distributions of γ3 and γ4 of nor-mal and pathological voices. The distributions of γ3 and
γ4for pathological voices tended to be skewed to the left Figure 3Cumulative false acceptance (right) and false rejection
(left).ΛNandΛPindicate the thresholds of LLR estimated by each GMM for normal and pathological voices in the training procedure. Both lines cross over the EER.
Table 1 Performance of the MFCC-based GMM method
Method Confusion matrix
Accuracy (%)
Specify (%)
Sensitivity (%)
AUC (%)
GMM 8 mixtures
89.58 10.42 89.35 ± 3.00 89.67 89.53 95.95
10.88 89.12
GMM 16 mixtures
89.58 8.33 92.00±4.79 92.27 91.72 98.59
7.68 92.32
GMM 32 mixtures
89.58 10.42 90.31 ± 4.09 90.90 89.73 96.02
8.96 91.04
The best performance is highlighted in bold.
0.0 0.2 0.4 0.6 0.8 1.0
0.0 0.2 0.4 0.6 0.8 1.0
True positive rate
False positive rate
Mean of the normalized kurtosis MFCC-based GMM (16 mixtures) MFCC-based GMM (16 mixtures) + mean of the normalized kurtosis
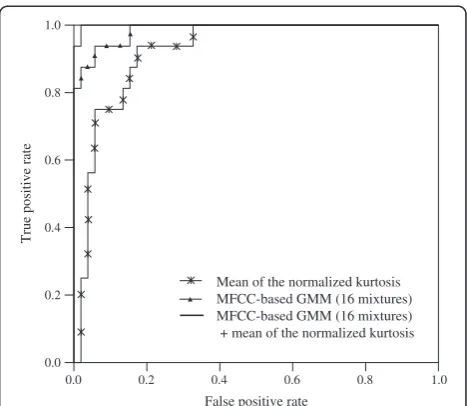
Figure 4ROC curves estimated in mean of the normalized kurtosis, MFCC-based GMM algorithm (16 Gaussian mixtures), and two-stage classifier.
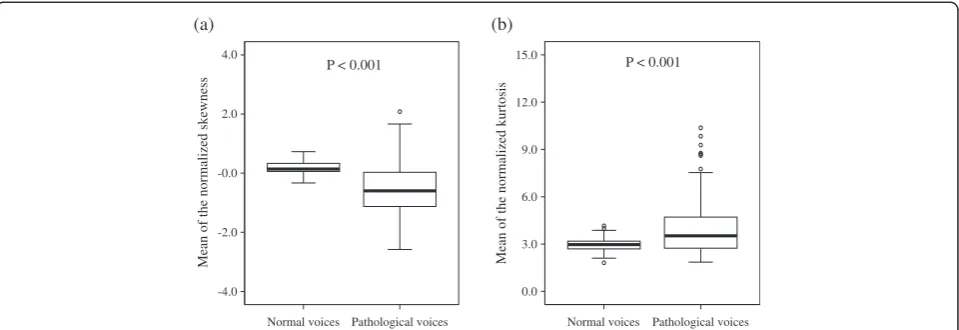
and have a leptokurtic distribution (γ4 > 3). For normal voices, these distributions tended to be skewed to the right and have a platykurtic distribution (γ4< 3), overall. The distributions of pathological voices had a tendency to show larger variation than those of normal voices. A Mann–Whitney rank sum tests showed a statistically significant difference between normal and disordered voices forγ3 andγ4(p< 0.001).
The fivefold cross-validation was used to estimate the performances for each parameter. When γ3 and γ4 were used to classify normal and pathological voices, the aver-age performances of 82.31 and 83.67% were obtained, re-spectively. Table 2 shows the confusion matrix, accuracy (%) including 95% CIs, specificity (%), sensitivity (%), and AUC when means of the normalized skewness and kur-tosis are used to classify normal and pathological voices. The accuracy of the mean of the normalized kurtosis was higher than that of the mean of the normalized skewness. The ROC curve of the mean of the normalized kurtosis is shown in Figure 4. In Figure 5, the DET curves show the EERs for the mean of the normalized kurtosis. The MFCC-based GMM method outperformed HOS method.
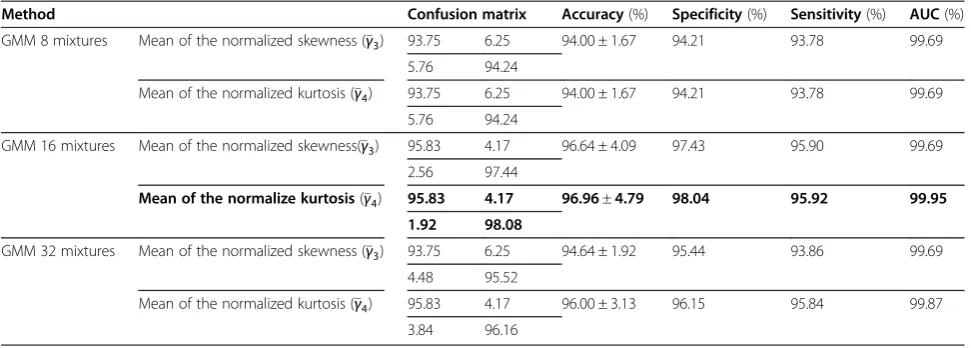
Two-stage classifier based on GMM-HOS
Table 3 shows the confusion matrix, accuracy (%) in-cluding 95% CIs, specificity (%), sensitivity (%), and AUC
when the two-stage classifier is used. The results were measured in the fivefold cross-validation similar to the MFCC-based GMM and HOS methods. The best per-formance, 96.96%, was obtained when 16 Gaussian mix-tures and the normalized kurtosis were utilized as the classifier. In general, when mean of the normalized kur-tosis was used as second classifier, the performance was higher than that of mean of the normalized skewness.
The ROC and DET curves of a two-stage classifier using 16 Gaussian mixtures and mean of the normalized kurtosis are shown in Figures 4 and 5. The AUC of the method was larger than that those of 16 Gaussian mix-tures and mean of the normalized kurtosis independ-ently. EER of the two-stage classifier was 3.04% in Figure 5.
Conclusion and discussion
In this article, we define a two-stage technique to dis-criminate pathological from normal voices. The newly proposed model is comprised of two parts, an MFCC-based GMM algorithm which describes the primary de-cision achieved by the LLR scores of the GMM, and post-processing using an HOS analysis block incorporat-ing means of the normalized skewness and kurtosis. The characteristics of the MFCC between normal and patho-logical voices are presented in the study of Godino-Llorente et al. [10]. A strong correlation between the
-4.0 -2.0 -0.0 2.0 4.0
Mean of the normalized skewness Mean of the normalized kurtosis
(a) (b)
Normal voices 0.0
3.0 6.0 9.0 12.0 15.0
P < 0.001 P < 0.001
Pathological voices Normal voices Pathological voices
Figure 6Distributions of the proposed HOS-based parameters.(a) Mean of the normalized skewness. (b) Mean of the normalized kurtosis. The midline represents the median, with the lower and upper boundaries of the box indicating the first and third quartiles, respectively. Whiskers indicate the maximum and minimum values and circles indicate outliers.
Table 2 Performance of the means of the normalized skewness and kurtosis
Method Confusion matrix Accuracy (%) Specificity (%) Sensitivity (%) AUC (%)
Mean of the normalized skewness 81.25 18.75 82.31 ± 5.67 83.00 81.64 89.36
16.64 83.36
Mean of the normalized kurtosis 83.33 16.67 83.67±6.89 83.89 83.49 92.38
16.00 84.00
HOS coefficients (the normalized skewness and kurtosis) and voice classification is demonstrated (p< 0.001). By introducing these parameters in cases where the MFCC-based GMM algorithm returns uncertain values, the classification can be improved. According to Sáenz-Lechón et al.’s recommendations [5], we utilized a commercially well-known database. Classification per-formance along with CI was obtained by a cross-validation strategy based on several partitions. Results are also described by DET and AUC.
The two-stage classifier outperformed the individual classification schemes. The best performance, 96.96%, is achieved by combining an MFCC-based GMM algo-rithm with 16 Gaussian mixtures and the mean of the normalized kurtosis. The MFCC-based GMM algorithm with 16 Gaussian mixtures performed at 92.0% while the means of the normalized skewness and kurtosis classi-fied correctly 82.31 and 83.67%, respectively. A false de-cision is occasionally caused by the erroneous EM-based GMM estimation in the intersection regions where they have somewhat low likelihoods. Therefore, it is believed that the performance improvement is mainly due to the fact that our two-stage classifier successfully solves the false decision problem caused by low log-likelihood values.
Many studies have presented a variety of approaches [1-3,6-13,19]. Although different datasets and evaluation procedures make it difficult to compare the results of previous studies [5], Godino-Llorente and Gómez-Vilda [8] presented the experimental result using the learning vector quantization methodology, yielding 96% frame ac-curacy. Afterwards, Godino-Llorente et al. [10] pub-lished the article showing an accuracy of 94.07% with 24 MFCC parameters and a GMM of 6 mixtures. A classifi-cation performance of 98.3% was obtained by using both the perturbation and seven HOS-based parameters with an NN classifier implemented by Alonso et al. [19].
Recently, Wang et al. [12] proposed a GMM-SVM classi-fier with a classification performance of 96.1%. Finally, in this article, we combined the MFCC-based GMM method utilized by Godino-Llorente et al. [8,10,11] and Wang et al. [12] with HOS parameters to obtain a per-formance of 96.96%.
The automatic classification between normal and pathological voices remains an open problem that calls for reliable algorithms to aid the clinicians. When the in-formation gathered from simple physically informed GMMs is combined with HOS-based parameters, a valu-able classifier can be obtained. This two-stage method can be used for the analysis and assessment of voice quality.
Competing interests
The author declares that she has no competing interests.
Acknowledgments
This research was supported by the Basic Science Research Program through the National Research Foundation of Korea (NRF) funded by the Ministry of Education, Science and Technology (No. 2011–0025153). The author would like to thank Minsoo Hahn and Sangbae Jeong for their guidance, advice, and kind supports.
Received: 5 March 2012 Accepted: 30 October 2012 Published: 30 November 2012
References
1. M de Oliveira Rosa, JC Pereira, M Grellet, Adaptive estimation of residual signal for voice pathology diagnosis. IEEE Trans. Biomed. Eng47(1), 96–104 (2000)
2. K Shama, A Krishna, NU Cholayya, Study of harmonics-to-noise ratio and critical band energy spectrum of speech as acoustic indicators of laryngeal and voice pathology. EURASIP J. Adv. Signal Process.1997(1), 50–59 (2007) 3. JI Godino-Llorente, V Osma-Ruiz, N Sáenz-Lechón, P Gómez-Vilda,
M Blanco-Velasco, F Cruz-Roldán, The effectiveness of the glottal to noise excitation ratio for the screening of voice disorders. J. Voice24(1), 47–56 (2010)
4. H Khadivi Heris, B Seyed Aghazadeh, M Nikkhah-Bahrami, Optimal feature selection for the assessment of vocal fold disorders. Comput. Biol. Med. 39(10), 860–868 (2009)
Table 3 Performance of the proposed two-stage classifiers
Method Confusion matrix Accuracy(%) Specificity(%) Sensitivity(%) AUC(%)
GMM 8 mixtures Mean of the normalized skewness (γ3) 93.75 6.25 94.00 ± 1.67 94.21 93.78 99.69
5.76 94.24
Mean of the normalized kurtosis (γ4) 93.75 6.25 94.00 ± 1.67 94.21 93.78 99.69
5.76 94.24
GMM 16 mixtures Mean of the normalized skewness(γ3) 95.83 4.17 96.64 ± 4.09 97.43 95.90 99.69
2.56 97.44
Mean of the normalize kurtosis(γ4) 95.83 4.17 96.96±4.79 98.04 95.92 99.95
1.92 98.08
GMM 32 mixtures Mean of the normalized skewness (γ3) 93.75 6.25 94.64 ± 1.92 95.44 93.86 99.69
4.48 95.52
Mean of the normalized kurtosis (γ4) 95.83 4.17 96.00 ± 3.13 96.15 95.84 99.87
3.84 96.16
5. N Sáenz-Lechón, JI Godino-Llorente, V Osma-Ruiz, P Gómez-Vilda, Methodological issues in the development of automatic systems for voice pathology detection. Biomed. Signal Process. Control1(2), 120–128 (2006) 6. JI Godino-Llorente, S Aguilera-Navarro, P Gómez-Vilda, Non-supervised
neural net applied to the detection of voice impairment, inProceeding of IEEE International Conference on Acoustics, Speech, and Signal Processing (ICASSP)(, 6, Istanbul, Turkey, 2000), pp. 3594–3597
7. S Hadjitodorov, P Mitev, A computer system for acoustic analysis of pathological voices and laryngeal disease screening. Med. Eng. Phys. 24(6), 419–429 (2002)
8. JI Godino-Llorente, P Gómez-Vilda, Automatic detection of voice impairments by means of short-term cepstral parameters and neural network based detectors. IEEE Trans. Biomed. Eng.51(2), 380–384 (2004) 9. K Umapathy, S Krishman, V Parsa, DG Jamieson, Discrimination of
pathological voices using a time-frequency approach. IEEE Trans. Biomed. Eng.52(3), 421–430 (2005)
10. JI Godino-Llorente, S Aguilera-Navarro, P Gómez-Vilda, Dimensionality reduction of a pathological voice quality assessment system based on Gaussian mixture models and short-term cepstral parameters. IEEE Trans. Biomed. Eng.53(10), 1943–1953 (2006)
11. JI Godino-Llorente, N Sáenz-Lechón, V Osma-Ruiz, S Aguilera-Navarro, P Gómez-Vilda, An integrated tool for the diagnosis of voice disorders. Med. Eng. Phys.28(3), 276–289 (2006)
12. X Wang, J Zhang, Y Yan, Discrimination between pathological and normal voices using GMM-SVM approach. J. Voice25(1), 38–43 (2010)
13. R Das, A comparison of multiple classification methods for diagnosis of Parkinson disease. Expert Syst. Appl.37(2), 1568–1572 (2010)
14. C Nikias, J Mendel, Signal processing with higher-order statistics spectra. IEEE Signal Process. Mag.10(3), 10–37 (1993)
15. JM Mendel, Tutorial on higher-order statistics in signal processing and system theory: theoretical results and some applications. Proc. IEEE 79(3), 278–305 (1991)
16. Massachusetts Eye and Ear Infirmary,Voice Disorders Database, Version. 1.03 [CD-ROM](Kay Elemetrics Corp, Lincoln Park, NJ, 1994)
17. E Nemer, R Goubran, S Mahmoud, Robust voice activity detection using higher-order statistics in the LPC residual domain. IEEE Trans. Speech Audio Process.9(3), 217–231 (2001)
18. JY Lee, H Minsoo, Automatic assessment of pathological voice quality using higher-order statistics in the LPC residual domain. EURASIP J. Adv. Signal Process (2009). Article ID 748207, 8pages
19. JB Alonso, J de Leon, I Alonso, MA Ferrer, Automatic detection of pathologies in the voice by HOS based parameters. EURASIP J. Appl. Signal Process.2001(4), 275–284 (2001)
20. RD Kent, MJ Ball,Voice Quality Measurement (Thomson Learning), (New York, 2000)
doi:10.1186/1687-6180-2012-252
Cite this article as:Lee:A two-stage approach using Gaussian mixture models and higher-order statistics for a classification of normal and
pathological voices.EURASIP Journal on Advances in Signal Processing2012
2012:252.
Submit your manuscript to a
journal and benefi t from:
7Convenient online submission
7Rigorous peer review
7Immediate publication on acceptance
7Open access: articles freely available online
7High visibility within the fi eld
7Retaining the copyright to your article