THE MICROWAVE THERMAL THRUSTER AND ITS APPLICATION TO THE LAUNCH
PROBLEM
Thesis by
Kevin L.G. Parkin
In Partial Fulfillment of the Requirements
for the Degree of
Doctor of Philosophy
CALIFORNIA INSTITUTE OF TECHNOLOGY
Pasadena, California 2006
Acknowledgements
I would like to thank my advisor, Dr. Fred Culick, for believing that people with unconventional ideas should be given a chance, and for giving that chance to me. I thank my committee for persevering with such an independent-minded student, and for steering me toward some of the deeper analyses in this thesis. Specifically, I thank Dr. Melany Hunt for steering me onto the quasi-1D channel flow analysis, Dr. Dale Pullin for steering me onto the 2D Navier-Stokes analysis, and Dr. Joe Shepherd for his advice on hydrogen safety and other experimental matters. I would also like to thank the Caltech President’s Fund, the Graduate Dean of Caltech, USAF Space & Missile Command, Mrs. Fiona Sanders (Mum) and Mr. Jeremy Tucker (Uncle Jay) for their financial support. I thank the numerous individuals who listened to my ideas at the ISBEP conferences in Japan and the U.S., at the Aerospace Corporation in Los Angeles, and at the Heinlein Flight to the Future contest in Moscow; your advice and feedback is not forgotten. Closer to home, conversations with many people have shaped my thinking as this work progressed, in particular Dr. Albert Ratner and Dr. William Bridges early on, and more recently Dr. Jim Benford, Dr. Jordin Kare, LtCol. Jess Sponable (ret), Dr. Sean Spillane, Dr. Tim Colonius and my JPL collaborator Dr. Leo DiDomenico. On the experimental side, I would like to thank Mr. Vivek Singhal and Mr. Alex Bruccoleri for their help in the lab, and Mr. Ricardo Paniagua of the physics machine shop for fabricating the final microwave cavity at no charge and on very short notice. On the administrative side, I would like to thank Ms. Melinda Kirk for her help in the frenzied final stages of preparing many reports and research proposals.
I am indebted to Dr. Marty Barmatz of JPL for the loan of his microwave materials processing apparatus, without which the experimental component of this work would not have been possible, and also to Dr. Jonathan Dowling for initiating my collaboration with JPL, and for being a good friend throughout adverse times.
enabled this work to survive at a pivotal time. I have been and continue to be tremendously fortunate to have such a friend and advisor.
Abstract
Nuclear thermal thrusters long ago bypassed the 50-year-old specific impulse (Isp)
limitation of conventional thrusters, using nuclear powered heat exchangers in place of conventional combustion to heat a hydrogen propellant. These heat exchanger thrusters experimentally achieved an Isp of 825 seconds, but with a thrust-to-weight ratio (T/W) of
less than ten they have thus far been too heavy to propel rockets into orbit.
This thesis proposes a new idea to achieve both high Isp and high T/W: The Microwave
Thermal Thruster. This thruster covers the underside of a rocket aeroshell with a lightweight microwave absorbent heat exchange layer that may double as a re-entry heat shield. By illuminating the layer with microwaves directed from a ground-based phased array, an Isp of 700–900 seconds and T/W of 50–150 is possible using a hydrogen
propellant. The single propellant simplifies vehicle design, and the high Isp increases
payload fraction and structural margins. These factors combined could have a profound effect on the economics of building and reusing rockets.
Table of Contents
Acknowledgements ... iii
Abstract...6
Table of Contents ...7
List of Figures...11
List of Tables ...20
1 Introduction...22
1.1 The Launch Problem and the Need for Nonchemical Propulsion ... 22
1.1.1 Nuclear Rockets ... 30
1.1.2 Laser Thermal Rockets ... 33
1.1.3 Electrothermal Rockets... 33
1.1.4 Molecular Absorption Propulsion... 37
1.1.5 Rectenna-based Concepts ... 37
1.1.6 Transatmospheric Laser Propagation... 39
1.1.7 Ablative Laser & Microwave Propulsion ... 40
1.1.8 Hypersonic Airbreathing Propulsion ... 42
1.2 Why Microwave Thermal Propulsion? Summary and References... 44
2 Elements of Microwave Thermal Rocketry...51
2.1 A Personal Note on the Origin of This Work ... 51
2.2 Concept of the Microwave Thermal Rocket... 54
2.2.1 Thruster... 56
2.2.2 Nuclear Rocket Analogy... 61
2.2.3 Materials and Fabrication ... 63
2.2.4 High Power Microwave Sources ... 67
2.2.5 Phased Array... 70
2.2.6 Transatmospheric Microwave Beam Propagation ... 74
2.3 Sizing and Performance ... 77
2.3.2 Ascent Trajectory... 77
2.3.3 Heavy Launch ... 81
2.3.4 Single Stage to Orbit Example... 83
2.3.5 Power Budget... 88
2.3.6 Cost ... 90
2.4 Summary and References ... 93
3 Experimental and Theoretical Motivation ...99
3.1 Experimental and Theoretical Objectives... 99
3.2 Approach... 100
3.3 Apparatus ... 101
3.4 Preliminary Sizing of Components... 104
3.4.1 Mass Flow Controller ... 104
3.4.2 Tube ... 104
3.4.3 Cavity... 105
3.5 Summary and References ... 107
4 Electromagnetics and the Coupled EM-Conduction Problem ...110
4.1 Cylindrical Axisymmetric Electromagnetic Model ... 110
4.1.1 Nomenclature... 110
4.1.2 Governing Equations ... 111
4.2 Auxiliary Quantities... 113
4.2.1 Power Losses on Walls ... 113
4.2.2 Quality Factor ... 113
4.2.3 Shunt Impedance... 114
4.2.4 Mesh and Boundary Conditions ... 114
4.2.5 Results... 116
4.2.6 Sensitivity of the Solution to Boundary Condition Type ... 119
4.3 Nonlinear Conduction Model ... 134
4.3.1 Governing Equations ... 134
4.3.2 Boundary conditions ... 136
4.4 Combined Electromagnetic-Conduction Model ... 137
4.5 Summary and References ... 144
5 Convection ...146
5.1 Quasi-1D Channel Flow ... 146
5.1.1 Nomenclature... 146
5.1.2 Problem Formulation ... 147
5.1.3 Governing Equations ... 150
5.1.4 Application to a Turbulent Channel Flow ... 153
5.1.5 Application to a Laminar Channel Flow... 156
5.2 2D Finite Difference Channel Flow... 157
5.2.1 Problem Formulation ... 158
5.2.2 Discretization ... 159
5.2.3 Boundary Conditions ... 161
5.2.4 Numerical stability... 164
5.2.5 Comparison with Other Solutions... 165
5.3 Comparison of Quasi-1D and 2D Results... 177
5.4 Summary and References ... 181
6 The Coupled Electromagnetic-Conduction-Convection Problem...183
6.1 Problem Formulation ... 183
6.2 Quasi-1D Results ... 186
6.3 2D Navier-Stokes Results ... 191
6.4 Summary and References ... 196
7 Experimental Measurements of Thruster Temperature and Performance ....198
7.1 Apparatus ... 198
7.1.1 Summary ... 198
7.1.2 Faraday Cage ... 201
7.1.3 Pyrometry... 202
7.2 Axial E-field... 205
7.2.1 Theory and Procedure ... 205
7.2.2 Results and Discussion ... 207
7.3 Tube Temperature (No Flow) ... 210
7.3.2 Results and Discussion ... 212
7.4 Tube Temperature (Hydrogen Flow) ... 216
7.4.1 Theory and Procedure ... 216
7.4.2 Results and Discussion ... 217
7.5 Unsteady Behavior (Nitrogen Flow)... 220
7.6 Summary and References ... 223
8 Concluding Remarks ...225
8.1 Experimental Demonstration ... 225
8.2 Theoretical Modeling... 226
8.3 A Short-term View of the Future ... 228
8.3.1 Economics and Conceptual Design ... 228
8.3.2 Engineering... 228
8.4 Overall Concept ... 231
8.5 References... 234
Appendix A Hydrogen Properties...235
Appendix B Material Properties...240
Appendix C Ascent Trajectory Model...244
Appendix D High Power Microwave Breakdown Model ...249
Appendix E Planar Stratified Layer Model...251
List of Figures
Fig. 1-1: Economics of the launch problem. Reliability data (bottom) is from Chang
(2000)...24
Fig. 1-2: Relationship between structural margins and reusability (Koelle, 1961). ...26
Fig. 1-3: Single stage to orbit (SSTO) equivalent propulsive, structural, and payload performance of launchers. Multistage launchers are compared in this diagram on the basis of an “effective” Isp or structural mass fraction. ...27
Fig. 1-4: (a) NERVA nuclear thermal rocket test. (© National Air and Space Museum, Smithsonian Institution photo SI 75-13750). In December 1967, an experimental version of NERVA completed a 60-minute endurance test at 2270 K and 1100 MW. (b) Launch accident simulation using a modified Kiwi Nuclear Rocket in January 1965. A sudden increase in power output was imposed, causing the reactor to explode. (NASA Image No. 65-H-49). (c) The RD-0410 Nuclear Thermal Engine (© Dietrich Haeseler)...30
Fig. 1-5: A 1970 schematic of the NERVA nuclear thermal rocket engine (NASA Image No. NPO-70-15803)...31
Fig. 1-6: HX Laser Heat Exchange Concept of Kare (1995)...33
Fig. 1-7: Microwave-supported combustion wave in a waveguide. ...34
Fig. 1-8: Cylindrical resonant cavity modes suitable for propulsion...36
Fig. 1-9: Left: Combustion chamber energy addition. Right: Continuous energy addition. (Chiravalle et al., 1998) ...37
Fig. 1-10: W.C. Brown and the 200 Watt, 2.45 GHz microwave helicopter (1964) as described by Brown (1984)...38
Fig. 1-11: The 10 kW, 2.45 GHz SHARP UAV (1987) as described by East (1992)...38
Fig. 1-12: The microwave lightcraft concept of Myrabo (1995). ...39
Fig. 1-13: Left: Atmospheric wind profile. Right: Effect of atmospheric turbulence on targeting. (Tyson, 2000)...40
Fig. 1-15: Left: Ultralight microwave-boosted microsatellite (liftoff mass 30 to 50 kg). Right: Airbreathing ascent of the microwave lightcraft. (Myrabo and Benford, 1994) ...42 Fig. 1-16: The airbreathing ascent regime. Left: High Mach number propulsion
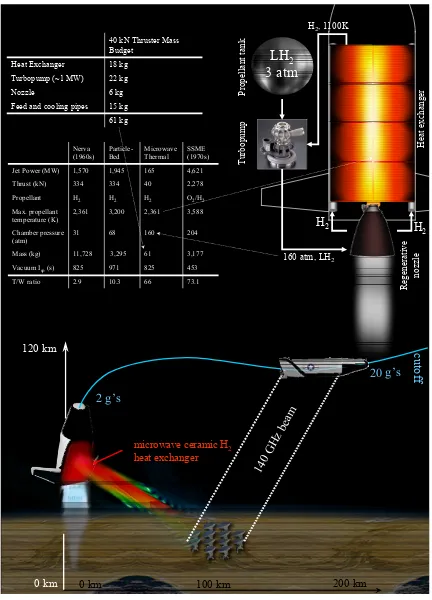
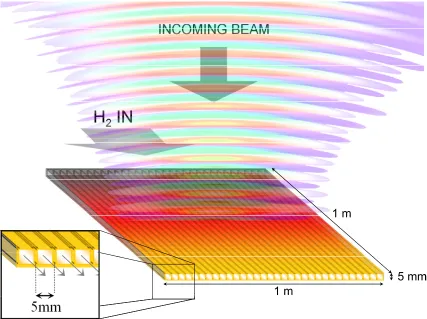
performance (Maurice et al., 2001). Right: The airbreathing ascent corridor (Hunt and Martin, 2001). ...43 Fig. 2-1: 40 kN design example for the microwave thermal rocket (MTR) system...55 Fig. 2-2: A segment of the microwave thermal thruster shown in Fig. 2-1...57 Fig. 2-3: An idealization of the SiC absorber layer structure, for simplicity neglecting the
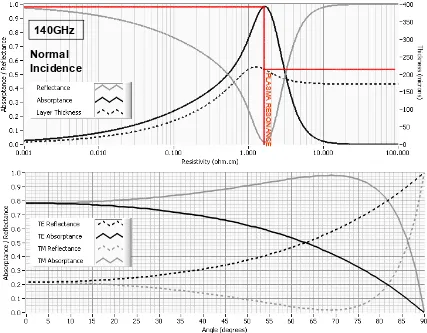
holes for heat exchanger channels. ...60 Fig. 2-4: Optical performance of the SiC microwave thermal channel, calculated from
the stratified layer model presented in Appendix D. Top: SiC absorber
performance at 140 GHz. Bottom: 1 mm thick SiC absorber off-normal response at 140 GHz, 1.5 Ω.cm. ...60 Fig. 2-5: A comparison of enthalpy addition stage for microwave, nuclear and
conventional thrusters. ...62 Fig. 2-6: Concept of how tungsten and silicon carbide could be combined to form a
refractory heat exchanger channel. ...66 Fig. 2-7: Resistivity vs. temperature for vanadium-doped silicon carbide (V:SiC)
calculated from the model of Gradinaru (1997). ...67 Fig. 2-8: Left: Average power density potential of single microwave tube vs. year.
Middle: Dr. Kevin Felch and Dr. Pat Cahalan displaying their CPI 110 GHz gyrotron, capable of producing 1 MW of output power for 0.6 seconds, or 600 kW for 10 seconds. Right: 1 MW, 140 GHz gyrotron beam of ~ 3 cm diameter striking a microwave ablative rocket (Oda et al., 2003)...68 Fig. 2-9: Concept for a phased array element and 30 MW phased array (Benford and
Dickinson, 1995). In the decade since this design was published the CW power output of gyrotrons has increased by two orders of magnitude. ...71 Fig. 2-10: Top left: Russian millimeter wave phased array (Tolkachev et al., 2000). Top
Fig. 2-11: Top: General atmospheric absorption. Middle left: Water vapor for example sites in the southwestern USA (Erasmus, 2000). Middle right: Calculated
atmospheric transmission at Mauna Kea (Lis). Bottom: Atmospheric breakdown intensity by altitude and frequency, based on the semi-empirical model of Liu et al. (1997)...76 Fig. 2-12: Whole-earth view of the launcher ascent trajectory. Computed using the
model given in Appendix C. ...78 Fig. 2-13: Top: Ascent trajectory with time. Bottom: Ascent trajectory with downrange
distance. Computed using the model given in Appendix C...80 Fig. 2-14: System summary of the 10 ton SSTO launcher point design vs. Isp using
Al-Li-2195 alloy tanks. ...85 Fig. 2-15: System summary of the 10 ton SSTO launcher point design vs. Isp using
titanium tanks...86 Fig. 2-16: System summary of the 10 ton SSTO launcher point design vs. Isp using
carbon composite tanks...87 Fig. 3-1: Microwave absorption vs. resistivity at 2.45 GHz. The optimum resistivity for
absorption is 100 Ω.cm, and for SiC the optimum planar layer thickness at this resistivity is 1.2 cm. ...101 Fig. 3-2: TE102 Resonant cavity arrangement of Yiin & Barmatz (1995). ...101 Fig. 3-3: Microwave circuit for heating...102 Fig. 3-4: An early concept of the experimental apparatus using a silicon carbide tube at
2.45 GHz (not to scale). ...103 Fig. 3-5: Candidate cylindrical resonant cavity modes...105 Fig. 3-6: Optimum dimensions for the cylindrical cavity TM modes. ...106 Fig. 4-1: Field lines for a transverse magnetic (TM) mode in a cylindrically symmetric
cavity. Note that the electric field must be perpendicular to a conducting
boundary. ...112 Fig. 4-2: An example mesh with volumetric and boundary conditions for the
experimental setup. ...115 Fig. 4-3: TM010 cavity electric and magnetic field distributions for the loaded and
field occurs on the axis, and within the dielectric tube itself in the loaded case. The peak magnetic field occurs toward the wall; moving away from the cavity drive point in the loaded case. Note that the scale is artificially elongated in the r
direction. ...117 Fig. 4-4: TM011 cavity electric and magnetic field distributions for the loaded and
unloaded cases. The cavity geometry is as given in Fig. 4-2. The peak electric field occurs around the sharp corners at the cavity ends. ...119 Fig. 4-5: Tapered TM011 cavity electric field for the parameters given in Table 4-13. In
the lower contour plot, each contour represents 5% of the peak electric field near the axis. The peak electric field overall occurs at the edges of the cavity drive point (two white dots at the top of the plot)...120 Fig. 4-6: Tapered TM011 cavity electric field for a drive point displaced 1 cm to the right
relative to the baseline case. Contours represent 5% intervals, 5% of the
maximum field in the near axis region for the top and bottom plots...121 Fig. 4-7: Tapered TM011 cavity electric field for a drive point length 25% of maximum
relative to the 75% baseline case. Contours represent 5% intervals, 5% of the maximum field in the near axis region for the top and bottom plots...122 Fig. 4-8: Tapered TM011 cavity electric field for a drive point length 100% of maximum
relative to the 75% baseline case. Contours represent 5% intervals, 5% of the maximum field in the near axis region for the top and bottom plots...123 Fig. 4-9: Tapered TM011 cavity electric field for a taper end diameter of 0.7 cm relative
to the 2 cm baseline case. Contours represent 5% intervals, 5% of the maximum field in the near axis region for the top and bottom plots. ...124 Fig. 4-10: Tapered TM011 cavity electric field for a taper end diameter of 5 cm relative to
the 2 cm baseline case. Contours represent 5% intervals, 5% of the maximum field in the near axis region for the top and bottom plots. ...125 Fig. 4-11: Tapered TM011 cavity electric field for a mullite tube outer diameter of 6 mm
Fig. 4-12: Tapered TM011 cavity electric field for a mullite tube outer diameter of 1 mm relative to the 1.98 mm baseline case. Contours represent 5% intervals, 5% of the maximum field in the near axis region for the top and bottom plots...127 Fig. 4-13: Tapered TM011 cavity electric field for a left taper length of 4.8 cm relative to
the 5.2 cm baseline case. Contours represent 5% intervals, 5% of the maximum field in the near axis region for the top and bottom plots. ...128 Fig. 4-14: Tapered TM011 cavity electric field for a cavity radius of 5.08 cm relative to
the 5.15 cm baseline case. Contours represent 5% intervals, 5% of the maximum field in the near axis region for the top and bottom plots. ...129 Fig. 4-15: Tapered TM011 cavity electric field for a tube modeled as a perfect magnetic
conductor (PMC) relative to the baseline case using a continuity boundary
condition. Contours represent 5% intervals, 5% of the maximum field in the near axis region for the top and bottom plots. ...130 Fig. 4-16: Tapered TM011 cavity electric field for the case of perfect electric conducting
(PEC) boundaries at either end relative to the baseline case using low reflecting boundaries to represent radiation to the outside. Contours represent 5% intervals, 5% of the maximum field in the near axis region for the top and bottom plots. .131 Fig. 4-17: Top: Tapered TM011 cavity electric field for a central section length of 8.1 cm
relative to the 15.8 cm baseline case. Bottom: Tapered TM011 cavity electric field for a central section length of 8.1 cm relative to the 15.8 cm baseline case.
Contours represent 5% of the maximum field in the near axis region...132 Fig. 4-18: Tapered TM011 cavity electric field for the case of a matched boundary with
incident wave propagation constant β= 32 m-1 relative to the baseline case using a fixed H condition. Contours represent 5% intervals, 5% of the maximum field in the near axis region for the top and bottom plots...133 Fig. 4-19: An example of non-unique temperature behavior at the center of a microwave
heated alumina sphere (Jackson and Barmatz, 1991). Solutions arising from the nonlinear conduction code would be expected to behave in a similar way. ...135 Fig. 4-20: All-flux boundary and volumetric conditions for the nonlinear conduction
Fig. 4-21: The coupled electromagnetic-conduction problem...138
Fig. 4-22: Evolution of the TM011 cavity toward a steady state solution...140
Fig. 4-23: Steady state TM011 cavity solution with an alumina tube. For each tube quantity, the bottom edge of the intensity plot corresponds to the inner radius and the top edge corresponds to the outer radius of the tube, so as to map to the conduction domain seen in Fig. 4-21. For the electric field, the bottom edge corresponds to the axis and the top edge to the radius of the cavity, so as to map to the electromagnetic domain seen in Fig. 4-21. ...141
Fig. 4-24: Evolution of the tapered TM011 cavity toward a steady state solution...143
Fig. 4-25: Steady state tapered TM011 cavity solution with a mullite tube. For each tube quantity, the bottom edge of the intensity plot corresponds to the inner radius and the top edge corresponds to the outer radius of the tube. For the electric field, the bottom edge corresponds to the axis and the top edge to the radius of the cavity.144 Fig. 5-1: Control volume for a fluid element within the channel. ...147
Fig. 5-2: Quasi-1D flow through a high power turbulent channel...155
Fig. 5-3: Quasi-1D flow through a low power laminar channel. ...157
Fig. 5-4: Discretization of the flow domain for the Navier-Stokes solution. ...160
Fig. 5-5: Depiction of the axial symmetry boundary condition as a mirror. Vector quantities must be treated with care...161
Fig. 5-6: Comparison of computed and reference (analytical) density for the isothermal test case. Computed and reference contours represent 5% of peak density; difference contours represent 0.001% each. The vertical stripes are spurious numerical waves emanating from both inlet and outlet boundary conditions. These spurious waves always occur to some extent in these nonlinear simulations and are most prevalent at a spatial period of two points for centered difference schemes (Colonius, 2004)...167
Fig. 5-7: Comparison of computed and reference (analytical) axial velocity for the isothermal test case. Computed and reference contours represent 5% of the peak velocity each; difference contours represent a difference of 0.1% each...168
Fig. 5-9: Comparison of computed and reference (analytical) pressure for the thermally developing test case. Computed and reference contours represent 5% of the peak pressure; difference contours represent 0.01% each...173 Fig. 5-10: Comparison of computed and reference (analytical) pressure for the thermally
developing test case. Computed and reference contours represent 1% of the peak pressure; difference contours represent 0.01% each...174 Fig. 5-11: Comparison of computed and reference (analytical) axial velocity for the
isothermal test case. Computed and reference contours represent 5% of the peak velocity each; difference contours represent a difference of 0.05% each...176 Fig. 5-12: 1D comparison of the quasi-1D and 2D Navier-Stokes channel flow codes.179 Fig. 5-13: Difference between the quasi-1D and 2D Navier-Stokes channel flow codes.180 Fig. 6-1: Commonality and differences between the fully coupled performance modeling
at laboratory and full-scale...184 Fig. 6-2: The coupled electromagnetic-conduction-convection model. ...185 Fig. 6-3: Course of the quasi-1D coupled simulation solution. ...188 Fig. 6-4: Simulation of tube heating in the tapered TM011 cavity (quasi-1D convection
model). For each tube quantity, the bottom edge of the intensity plot corresponds to the inner radius and the top edge corresponds to the outer radius of the tube. For the electric field, the bottom edge corresponds to the axis and the top edge to the radius of the cavity...189 Fig. 6-5: Convective heat transfer in the tapered TM011 cavity (quasi-1D convection
model). ...190 Fig. 6-6: Simulation of tube heating in the tapered TM011 cavity (2D Navier-Stokes
convection model)...193 Fig. 6-7: Simulation of tube heating in the tapered TM011 cavity...194 Fig. 6-8: Simulation of tube heating in the tapered TM011 cavity. For each tube quantity,
Fig. 7-1: Overview of the experimental setup. ...199
Fig. 7-2: The Faraday Cage. ...201
Fig. 7-3: The resonant cavity and pyrometer arrangement. ...203
Fig. 7-4: Left: The alumina bead. Right: The cavity bead pull arrangement...207
Fig. 7-5: Comparison of experimental E-field to computational models. ...208
Fig. 7-6: Steady state microwave heating of a mullite tube (no flow)...213
Fig. 7-7: Comparison of theory and experimental results for a mullite tube with no flow.214 Fig. 7-8: Stable operation of the microwave thermal channel with a hydrogen gas. Left: The mullite tube at dull red heat produces a clear hydrogen flame. Middle: The same tube a short time later at white heat produces a bright yellow flame due to deliberate sodium contamination. Right: The same tube at a higher flow rate glows dull red in the narrow choke region...218
Fig. 7-9: Comparison of theory and experimental results for a mullite tube with flowing hydrogen. ...219
Fig. 7-10: Unsteady behavior of the microwave thermal channel with a nitrogen flow.222 Fig. 8-1: Key elements of the microwave thermal thruster brought together and operating at laboratory-scale (§ 7.4.2). ...225
Fig. A-1: Specific heat capacity of H2 vs. temperature (Chase, 1998). ...235
Fig. A-2: Ratio of specific heats vs. temperature for H2...236
Fig. A-3: Left: The variation of hydrogen enthalpy with temperature and pressure. Right: The dissociation fraction of hydrogen as a function of temperature and pressure (Knight Jr. et al., 1957)...237
Fig. A-4: The total emissivity ε of a hydrogen plasma at 100 atm through a mean path length of 30 cm. The dashed lines indicate emissivity contributions from the pressure-induced rotational lines εr, the fundamental band εv′, and from the continuum spectrum εc (Olfe, 1960)...238
Fig. A-5: The pressure-induced absorption coefficient vs. wavenumber for the rotational lines of H2 at 300 K (Olfe, 1960)...239
Fig. B-1: High temperature creep rate of sintered α-SiC (Munro, 1997). ...243
Fig. C-1: The ascent trajectory coordinate system...244
Fig. E-1: An idealization of the microwave thermal channel flow using an HfC susceptor with a boron nitride (BN) supporting structure...251 Fig. E-2: Optical performance of the HfC-BN microwave thermal channel calculated
from the stratified layer model. Top: HfC susceptor performance at 140 GHz, 45 μΩ.cm. Bottom: 6 nm HfC susceptor off-normal response at 140 GHz, 45
List of Tables
Table 1-1: Launch vehicle propulsion methods admitted by existing physics, with the possible exception of nuclear isomers, which await further experimental and
theoretical verification (Johnson, 2004). ...29
Table 2-2: Candidate materials for the microwave thermal thruster. ...65
Table 2-3: Ascent trajectory parameters of a microwave thermal launcher with a 100 ton payload vs. a 100 kg payload...81
Table 2-4: Heavy launch trajectory results using input parameters that are optimized by trial and error. The structural mass fraction is assumed to be 20% for all cases. A more accurate treatment is given in Appendix F. ...82
Table 2-5: Parameters for the 10 ton SSTO launcher point design. ...84
Table 2-6: Results for the 10 ton SSTO launcher point design. Taken from carbon composite tank dataset at Isp = 820 seconds...88
Table 2-7: Estimated end-to-end energy efficiencies for the microwave thermal system based on the efficiencies given in Table 2-8...89
Table 2-8: Basis of estimates and references for Table 2-7...89
Table 2-9: Summary of hardware cost estimates...91
Table 4-10: Summary of boundary conditions for the electromagnetic model. ...116
Table 4-11: Model input parameters for the TM010 mode. ...117
Table 4-12: Model input parameters for the TM011 mode. ...118
Table 4-13: Baseline input parameters for the tapered TM011 sensitivity analysis...120
Table 4-14: Input parameters for the TM011 EM-conduction problem. ...139
Table 4-15: Input parameters for the tapered TM011 EM-conduction problem. ...142
Table 5-1: Quasi-1D turbulent gasdynamic model parameters. ...154
Table 5-2: Quasi-1D laminar gasdynamic model parameters...156
Table 5-3: Input parameters for the fully developed isothermal flow test case...166
Table 5-4: Input parameters for the fully developed isothermal flow test case...172
Table 5-5: Input parameters for comparison of the quasi-1D and 2D Navier-Stokes channel flow codes...178
Table 6-7: Input parameters for the 2D Navier-Stokes coupled simulation. ...192
Table 7-1: Summary of key equipment. ...199
Table 7-2: Experimental parameters for the axial E-field experiment. ...208
Table 7-3: Experimental parameters for tube heating with no flow. ...212
Table 7-4: Experimental parameters for tube heating with a hydrogen flow. ...217
Table 7-5: Experimental parameters for tube heating with a nitrogen flow. ...221
Table A-1: Constants used in the calculation of hydrogen enthalpy and specific heat capacity. Adapted from the values of Chase (1998). ...235
Table B-1: Tabulated normal emissivity of mullite (Goodson, 1997)...240
CHAPTER 1
INTRODUCTION
Lastly, there is a third and most attractive method of acquiring velocity. This consists in the transmission of energy from the outside, from Earth.
The projectile itself need not carry “material” energy, i.e., extra weight, in the form of explosives or fuel. This energy could be transmitted to it from the planet in the form of a parallel beam of shortwave electromagnetic rays.
…This method of imparting velocity raises quite a few difficult problems, the solution of which I shall leave to the future.
K.E. Tsiolkovsky, The Spaceship (1924)
1.1
The Launch Problem and the Need for Nonchemical Propulsion
In the year 2006 payloads are launched into orbit the same way they were in 1966; by chemical rockets. Traditional expendable multistage rockets achieve payload fractions of less than 4.2%. As described by the rocket equation, this is due partly to the structural limits of existing materials, and partly to the limited specific impulse (Isp) of chemical
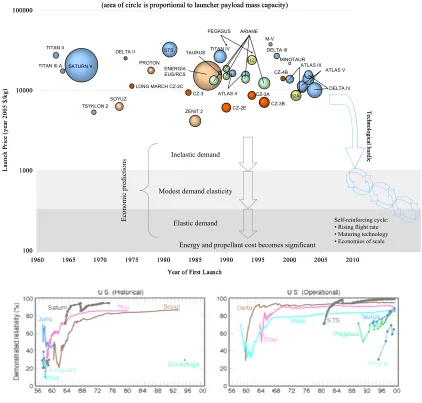
propellants, which have reached a practical limit of 460 seconds.i The structural economies made to preserve these minute payload fractions result in fragile rockets that are expensive to build. Despite 40 years of incremental rocket development, materials improvements have made little difference to price (Fig. 1-1), novel propellants have proven impractical, reliability is still variable, and the price of launch has remained around $10,000 per kilogram of payload delivered to low earth orbit. In contrast, the energy cost of launch ($/Joule of energy expended) is around $100 per kilogram.
i For H
2/O2 systems at high pressure. The highest chemical Isp achieved was 523 sec in vacuum using a
The ongoing high cost of launch arises for both technical and economic reasons. On the economic side, market models predict an essentially flat elasticity of demand for space launch until the payload cost is reduced below $1000 per kilogram (NASA, 1994), implying that the primary economic benefits of space cannot be realized without an order of magnitude reduction in launch costs. With modest price reductions only weakly affecting the present market size, any reduction in launch price simply reduces revenue for launch providers.
Fig. 1-1, which is compiled using price data is from Astronautix.com, shows the price that the unchanging users of the international launch market will bear; prices that have remained relatively constant since the dawn of the space age, and have proven insensitive to incremental technology improvements over the years. To complete the overall picture, the launch vehicle reliability diagrams of Chang (2000) are included at the bottom. Note that launch price is different to launch cost, which is modestly lower but in most cases proprietary. Aside from the vehicle cost itself, insurance costs, range costs and a number of other economic factors can form a significant fraction of the launch price. These costs decrease as the flight rate increases.
Small market size and a small revenue stream relative to development costs undermine the commercial incentive for investment in space launch technology. Many improvements have been funded in good faith by government launch customers; unfortunately, it might be concluded from Fig. 1-1 that either these improvements have been ineffective, or that the cost savings have not been reflected in the launch price, which is consistent with the market view of launch economics.
non-incremental technological improvements or by government-generated demand for existing launch systems is presently the subject of informal and heated debate within some sections of the rocket science community. The key question in this regard is how the monetary cost of the initial artificial boost in demand varies as a function of the monetary cost of new technology.
100 1000 10000 100000
1960 1965 1970 1975 1980 1985 1990 1995 2000 2005 2010
Year of First Launch
L aunc h P ri ce ( ye ar 2005 $/ kg ) STS
SATURN V ENERGIA
EUS/RCS
TSYKLON 2
ARIANE
SOYUZ
ZENIT 2 LONG MARCH CZ-2C
CZ-3
CZ-2E CZ-3B CZ-3A TITAN II
TITAN III A
DELTA II PROTON TITAN IV PEGASUS H2 H2A M-V DELTA III ATLAS II MINOTAUR DELTA IV ATLAS V ATLAS III CZ-4B TAURUS Inelastic demand
Modest demand elasticity
Elastic demand
Energy and propellant cost becomes significant
E con om ic pr edictio ns Technol og ical hurd le Self-reinforcing cycle: • Rising flight rate • Maturing technology • Economies of scale
Europe Russia Japan China USA
(area of circle is proportional to launcher payload mass capacity)
100 1000 10000 100000
1960 1965 1970 1975 1980 1985 1990 1995 2000 2005 2010
Year of First Launch
L aunc h P ri ce ( ye ar 2005 $/ kg ) STS
SATURN V ENERGIA
EUS/RCS
TSYKLON 2
ARIANE
SOYUZ
ZENIT 2 LONG MARCH CZ-2C
CZ-3
CZ-2E CZ-3B CZ-3A TITAN II
TITAN III A
DELTA II PROTON TITAN IV PEGASUS H2 H2A M-V DELTA III ATLAS II MINOTAUR DELTA IV ATLAS V ATLAS III CZ-4B TAURUS Inelastic demand
Modest demand elasticity
Elastic demand
Energy and propellant cost becomes significant
E con om ic pr edictio ns Technol og ical hurd le Self-reinforcing cycle: • Rising flight rate • Maturing technology • Economies of scale
Europe Russia Japan China USA
Europe Russia Japan China USA
Europe Russia Japan China USA
(area of circle is proportional to launcher payload mass capacity)
On the technical side there are significant and fundamental limitations in chemical propulsion–the energy density of propellants is limited by the energy of chemical bonds, and hence the energy density of the best chemical reaction known. For all intents and purposes that is the H2/O2 reaction, which at high pressure has an Isp of 460 seconds.
Low energy density translates to low Isp; at least a factor of two increase is needed, since
the energy density of all known chemical propellants is barely enough to carry their own weight into space, let alone the structure of the rocket and a payload on top of that. Engineers have shaved structural margins to their limits and resorted to multiple stages so that a payload can be carried into space at all, and even then, only 1–4.2% of the wet mass can be spared. The result is that to make a rocket that can reach orbit, elaborate and expensive construction techniques to remove every possible kilogram must be used. Small structural margins not only increase the cost of conventional expendable rockets, they impede them from evolving toward reusability: Launch is a violent process and a structure operating near its design tolerance is more susceptible to fatigue. The Space Shuttle as a reusable vehicle needs extensive refurbishment and testing between launches, to the extent that the launcher is disassembled, inspected, refurbished and rebuilt before every launch. For example, a hydrogen tank used for the on-board fuel cell is manufactured to burst at 1.5 times its usual operating pressure in order to save mass, but this safety factor of 1.5 means the tank may last only 100 cycles. Such a failure-prone component must have a more regular inspection regime, so operational costs go up. In contrast, the fuselage of a pressurized civil aircraft has a safety factor of two, and for that relatively little extra mass will last tens of thousands of pressurization cycles.
variability of the load, in this case three standard deviations. Given known distributions for loads and strengths, the corresponding safety factor and failure rate can be estimated. Referring to the right hand figure, note that a small increase in safety factor (y-axis) from perhaps 1.2 to 1.5 can decrease the failure rate (x-axis) by orders of magnitude and reduce the accuracy with which the loads and strengths for each part must be known. For reusable launchers this increase translates into less frequent inspections and faster turnaround between flights, lower maintenance costs, easier construction and greater reliability.
Fig. 1-2: Relationship between structural margins and reusability (Koelle, 1961).
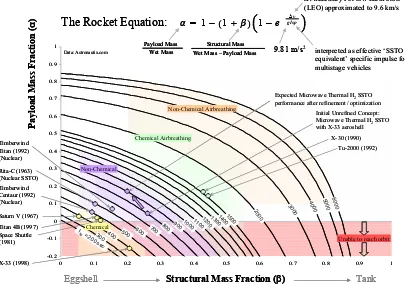
Changing the balance between the propulsive, structural and payload performance is essential to increase structural margins and achieve cheap construction and reusability. This balance is depicted graphically in Fig. 1-3 based on the rocket equation. A 2.5% payload fraction is achieved with an Isp of 450 seconds (nearly the 460 second limit for
chemical propellants) and a structural mass fraction of 0.1. Alternatively, the same payload fraction of 2.5% can be achieved using an Isp of 900 seconds and a structural
mass fraction of 0.3, meaning that the vehicle structure should be cheaper to manufacture and be orders of magnitude more reliable than for the previous case. In this simplistic sense the Isp (propulsive performance) and structural mass fraction (fragility) can be
traded off against one another to provide a given payload fraction, and clearly a structural mass budget three times larger allows for higher margins at lower cost, rather than low margins at high cost.
-0.2 -0.1 0 0.1 0.2 0.3 0.4 0.5 0.6 0.7 0.8 0.9 1
0 0.1 0.2 0.3 0.4 0.5 0.6 0.7 0.8 0.9 1
2000 Saturn V (1967)
Space Shuttle (1981) Rita-C (1963) (Nuclear SSTO) Isp = 20
0 sec
300 400 500 600
Timberwind Centaur (1992) (Nuclear) Timberwind Titan (1992) (Nuclear)
Titan 4B (1997) 1000 1100
120013 0014001500 Chemical
Non-Chemical
3000 4000 5000 6000 Non-Chemical Airbreathing
Chemical Airbreathing
X-33 (1998)
X-30 (1990) Tu-2000 (1992) interpreted as effective ‘SSTO equivalent’ specific impulse for multistage vehicles
Initial Unrefined Concept:
Microwave Thermal H2SSTO
with X-33 aeroshell
Expected Microwave Thermal H2SSTO
performance after refinement / optimization Data: Astronautix.com
700 800 900
Structural Mass Wet Mass – Payload Mass
Structural Mass Fraction (β)
Payload Mass Wet Mass P ayl oad Ma ss F rac ti on ( α )
Unable to reach orbit
1−1 1−e−gIspΔv
Δv necessary For low Earth orbit (LEO) approximated to 9.6 km/s
The Rocket Equation:
9.81 m/s2
Eggshell Tank -0.2 -0.1 0 0.1 0.2 0.3 0.4 0.5 0.6 0.7 0.8 0.9 1
0 0.1 0.2 0.3 0.4 0.5 0.6 0.7 0.8 0.9 1
2000 Saturn V (1967)
Space Shuttle (1981) Rita-C (1963) (Nuclear SSTO) Isp = 20
0 sec
300 400 500 600
Timberwind Centaur (1992) (Nuclear) Timberwind Titan (1992) (Nuclear)
Titan 4B (1997) 1000 1100
120013 0014001500 Chemical
Non-Chemical
3000 4000 5000 6000 Non-Chemical Airbreathing
Chemical Airbreathing
X-33 (1998)
X-30 (1990) Tu-2000 (1992) interpreted as effective ‘SSTO equivalent’ specific impulse for multistage vehicles
Initial Unrefined Concept:
Microwave Thermal H2SSTO
with X-33 aeroshell
Expected Microwave Thermal H2SSTO
performance after refinement / optimization Data: Astronautix.com
700 800 900
Structural Mass Wet Mass – Payload Mass
Structural Mass Wet Mass – Payload Mass
Structural Mass Fraction (β)
Payload Mass Wet Mass Payload Mass Wet Mass P ayl oad Ma ss F rac ti on ( α )
Unable to reach orbit Unable to reach orbit
1−1 1−e−gIspΔv
Δv necessary For low Earth orbit (LEO) approximated to 9.6 km/s
The Rocket Equation:
9.81 m/s2
Eggshell Tank
Past concept studies, particularly RITA-C nuclear SSTO and the X-33, provide bounds on the likely balance between propulsion, structure, and payload for microwave thermal rockets. Assuming the structural inefficiency of the X-33 combined with an average propulsive performance (Isp) of 720 seconds, Fig. 1-3 can be used graphically to predict a
payload fraction of 5%–15% from a launcher with the propulsive capabilities expected for a microwave thermal rocket.
To increase the Isp of the propellant past the practical chemical limit of 460 seconds, the
energy given to each kilogram of propellant must be increased. There are only two ways (using existing physics) to do this: The first is to increase the energy density of the launcher power source. The second way is to supply that energy from outside the rocket, thereby avoiding the chemical energy density limit.
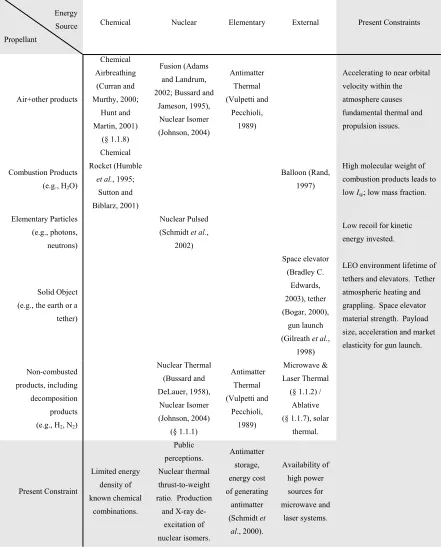
Table 1-1 is a sample of the various concepts that have been proposed to bypass the limitations of conventional rockets. In each category, a present constraint is suggested. Some constraints are fundamental, whereas others are resolvable. The approaches themselves may be judged as near-term or more long term, though this distinction is left to the reader. Some approaches have proven to be promising, others not so. Of the promising concepts, perhaps the greatest drawback to all of them is that they have not been brought to the point where they may considered serious alternatives to chemical rockets.
Energy Source Propellant
Chemical Nuclear Elementary External Present Constraints
Air+other products Chemical Airbreathing (Curran and Murthy, 2000; Hunt and Martin, 2001) (§ 1.1.8) Fusion (Adams and Landrum, 2002; Bussard and
Jameson, 1995), Nuclear Isomer (Johnson, 2004) Antimatter Thermal (Vulpetti and Pecchioli, 1989)
Accelerating to near orbital velocity within the atmosphere causes fundamental thermal and propulsion issues.
Combustion Products (e.g., H2O)
Chemical Rocket (Humble
et al., 1995; Sutton and Biblarz, 2001)
Balloon (Rand, 1997)
High molecular weight of combustion products leads to low Isp; low mass fraction.
Elementary Particles (e.g., photons, neutrons)
Nuclear Pulsed (Schmidt et al.,
2002)
Low recoil for kinetic energy invested.
Solid Object (e.g., the earth or a tether) Space elevator (Bradley C. Edwards, 2003), tether (Bogar, 2000), gun launch (Gilreath et al.,
1998)
LEO environment lifetime of tethers and elevators. Tether atmospheric heating and grappling. Space elevator material strength. Payload size, acceleration and market elasticity for gun launch. Non-combusted
products, including decomposition products (e.g., H2, N2)
Nuclear Thermal (Bussard and DeLauer, 1958), Nuclear Isomer (Johnson, 2004) (§ 1.1.1) Antimatter Thermal (Vulpetti and Pecchioli, 1989) Microwave & Laser Thermal (§ 1.1.2) /
Ablative (§ 1.1.7), solar
thermal. Present Constraint Limited energy density of known chemical combinations. Public perceptions. Nuclear thermal thrust-to-weight ratio. Production
and X-ray de-excitation of nuclear isomers. Antimatter storage, energy cost of generating antimatter (Schmidt et
al., 2000).
Availability of high power sources for microwave and
laser systems.
1.1.1 Nuclear Rockets
Solid core nuclear thermal propulsion has been technologically possible since the 1950s and was developed to an advanced level by the Atomic Energy Commission ROVER and NERVA programs between 1954 and 1971 (Gunn, 2001). Fig. 1-4a shows one such hour-long endurance test in Jackass Flats, Nevada. The stability and transient behavior of the nuclear reactors was an early concern, and the destructive test in Fig. 1-4b was conducted as part of the KIWI program that preceded NERVA in order to better understand this. In Russia, a similar development program brought the RD-0410 nuclear thermal thruster to operational status during the 1980s (Haeseler, 1993).
(a) (b) (c)
In place of a conventional combustion chamber, the hydrogen propellant is passed through a reactor core within a number of small channels, forming a heat exchanger like the one shown in Fig. 1-5.
Fig. 1-5: A 1970 schematic of the NERVA nuclear thermal rocket engine (NASA Image No. NPO-70-15803).
As the hydrogen passes through the channels it is heated to the thermal limits of the refractory materials from which the core is made. This temperature limit in turn limits the Isp in a way that can be deduced by considering the conservation of enthalpy as the
propellant travels from the combustion chamber (or equivalent) and expands through the nozzle to ambient atmospheric conditions. Since Isp is related to the exhaust velocity by
(Humble et al., 1995)
Isp gUe, (1.1)
this can be substituted into the enthalpy conservation equation and rearranged using well-known perfect gas relations to give,
Isp 1g 2h 1g 2cpTc 1g 2Ru−1 MTc
r . (1.2)
The Isp is therefore proportional to the square root of the propellant temperature Tc prior
Hydrogen is the optimum propellant for a propulsion system whose peak temperature is limited by the melting and softening points of materials, because the enthalpy at any given temperature is higher than any other gases and liquids that could be used for propulsion. That is to say it has the highest enthalpy at the maximum material temperature of the heat exchanger, and therefore the most energy per unit mass to convert into kinetic energy, hence exhaust velocity, hence Isp.
The nuclear fuel itself is often in the form of uranium carbide (UC) pellets coated with zirconium carbide (ZrC), a hydrogen resistant refractory metal. A thin ZrC layer can withstand high temperature hydrogen corrosion for many hours at 2500 K, corresponding to a vacuum Isp of 850 seconds.
Aside from thermal and corrosion constraints, the chosen materials must also possess suitable neutronic properties. In practice, this constraint combined with the problem of high temperature uranium diffusion into the propellant kept the NERVA engine temperature down to around 2500 K. In contrast, the Space Shuttle main engine (SSME) uses an H2/O2 reaction to heat its propellant to 3588 K. Despite a higher propellant temperature, the SSME Isp is 453 seconds, whereas the NERVA Isp is 825 seconds, due to
the high specific heat capacity of the hydrogen.
Despite the high Isp of 700–950 seconds, solid core nuclear rockets to date still cannot
reach orbit because the nuclear reactor is heavy and makes the thrust-to-weight ratio (T/W) too low. For example the 1990s Timberwind program increased the nuclear rocket
Isp to 900 seconds and its T/W from 2 to 10 (including shielding mass); but the T/W of the
1.1.2 Laser Thermal Rockets
Laser thermal propulsion is similar to nuclear thermal propulsion in that a heat exchanger is used in place of a combustion chamber to heat a hydrogen propellant. The laser-propelled heat-exchanger (HX launcher) concept was suggested by Kare (1995) and is shown in Fig. 1-6.
Fig. 1-6: HX Laser Heat Exchange Concept of Kare (1995).
The heat exchanger operates in a laminar regime by analogy to designs used for integrated circuit cooling. The heating channels are 200 μm wide by 2 mm deep and 3 cm long, raising the hydrogen propellant temperature to 1300 K; corresponding to an Isp
of ~ 600 s. Kare estimates the heat-exchanger mass to be 125 kg for a 5.4 ton vehicle carrying a 122 kg payload, corresponding to a payload fraction of 2.26%.
The propagation of high power transatmospheric laser beams is discussed in § 1.1.6. 1.1.3 Electrothermal Rockets
conduction. He established an analogy between high-pressure discharges and combustion flames, leading to the terms “laser-supported combustion wave” and “microwave-supported combustion wave.” Following this work, a variety of plasma stabilization schemes were studied for application to electrothermal propulsion systems (Balaam and Micci, 1995; J. Mueller, 1992; Knecht and Micci, 1988).
A microwave electrothermal propulsion system can be built using a waveguide, as shown in Fig. 1-7. Incident microwaves enter through a dielectric window, forming a plasma absorption region by the electron inverse bremsstrahlung mechanism. Without a plasma stabilization scheme the plasma propagates toward the source and impinges on the window, causing damage. In all schemes that employ plasmas for absorption it is important that the plasma, whose electron temperatures generally lie in the 10,000– 13,000 K range, is confined away from any walls to minimize the energy losses and damage to internal surfaces. For this purpose Power (1992) has discussed the use of magnetic nozzles.
Absorption region (plasma)
Incident microwaves
Gas
Dielectric window
Nozzle Mixing region
Fig. 1-7: Microwave-supported combustion wave in a waveguide.
subsequent supersonic expansion from the diverging section of the nozzle, to produce a high exit velocity, and hence high Isp. Mueller (1992) points out that coupling of
microwave energy into gases at pressure on the order of atmospheric is extremely efficient, and that incident power absorption efficiencies in excess of 95% have been obtained experimentally.
Nevertheless, it should be noted that for absorption schemes involving plasmas there are important constraints: The plasma frequency ωpσ is related to the number density of
charged species by Eq. (1.3).
p2 n0q 2
0m (1.3)
As the plasma density n0σ increases, the plasma frequency described by Eq. (1.3) exceeds
the frequency of incident microwaves, and reflection occurs. The net effect of the plasma density limitation is to constrain the maximum power absorbed by the propellant for a given pressure and mass flow rate. The frequency dependence of this constraint suggests that lasers may offer an advantage over microwaves in the context of electrothermal propulsion for application to launch.
Cross-section of discharge tube Electric field
Magnetic field
Microwave plasma absorption region
Gas
Gas
TM011 TM012
Expanding supersonic region
Cross-section of discharge tube Electric field
Magnetic field
Microwave plasma absorption region
Gas
Gas
TM011 TM012
Cross-section of discharge tube Electric field
Magnetic field
Cross-section of discharge tube Electric field
Magnetic field
Microwave plasma absorption region
Gas Gas
Gas Gas
TM011 TM012
Expanding supersonic region
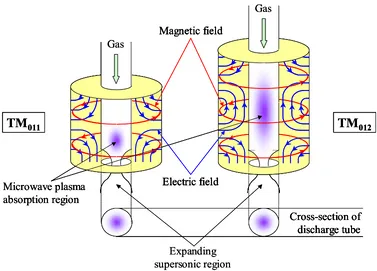
Fig. 1-8: Cylindrical resonant cavity modes suitable for propulsion.
The possibility of increasing the Isp of electrothermal propulsion systems by introducing a
second plasma absorption region in the expanding supersonic region of the nozzle flow was examined by Chiravalle et al. (2001). A resonant cavity thruster was simulated by solving the complete system of Maxwell and Navier-Stokes equations for argon flow in a realistic thruster geometry; however, the results suggest only modest increases in Isp were
possible in this particular case.
1.1.4 Molecular Absorption Propulsion
Molecular absorption of energy has recently been studied for application to laser propulsion (Chiravalle et al., 1998) and can be employed in the microwave region too. In contrast to the electron inverse bremsstrahlung absorption of plasma formation, molecular absorption is achieved via excitation of an internal rotation or vibration mode. By acting on the propellant itself or a seed molecule, heating of the flow can be achieved in subsonic or supersonic flows without the use of plasmas. As shown in Fig. 1-9 this results in the possibility of energy addition throughout the length of a propulsive duct, (a), rather than concentrating energy in a particular region, (b), as with the waveguide and resonant cavity concepts shown in Fig. 1-7 and Fig. 1-8, respectively.
Fig. 1-9: Left: Combustion chamber energy addition. Right: Continuous energy addition. (Chiravalle et al., 1998)
Because area variation along the flowpath can be used to offset temperature increases, more gradual addition of energy at lower temperatures could result in propulsion systems with less stringent cooling requirements and lower frozen-flow losses.
1.1.5 Rectenna-based Concepts
Fig. 1-10: W.C. Brown and the 200 Watt, 2.45 GHz microwave helicopter (1964) as described by Brown (1984).
Fig. 1-11: The 10 kW, 2.45 GHz SHARP UAV (1987) as described by East (1992).
Fig. 1-12: The microwave lightcraft concept of Myrabo (1995).
However, rectennas are currently limited to power densities of less than 1 KW/m2 at 2.45 GHz, which together with the high weight of ~1 kg/kW for DC power processing equipment, limits their use on highly energetic vehicles. Myrabo calculates that the microwave lightcraft requires a 35 GHz rectenna to operate at power densities 10,000 to 40,000 times higher than the present state of the art, and suggests a high-pressure helium-cooled silicon carbide rectenna array as a possible solution.
1.1.6 Transatmospheric Laser Propagation
Transatmospheric laser propagation has been studied for application to launch since the 1970s, and aside from cost, its use is constrained by three important factors: Water vapor absorption, scattering and thermal blooming.
Fig. 1-13: Left: Atmospheric wind profile. Right: Effect of atmospheric turbulence on targeting. (Tyson, 2000)
Adaptive optics techniques developed to address similar problems with astronomical observations have been suggested to help combat the problem of scintillation. Alternatively, spacing multiple laser sources over a wide area combined with a relatively large vehicle as a target can avoid many of the downsides of atmospheric scintillation without the need for adaptive optics.
Thermal blooming occurs as heating of the atmosphere along the path of the laser beam causes the refractive index of the air to change. This nonlinearity of the air can self-focus or defocus the beam. As before, it has been suggested that this problem can be controlled using adaptive optics (Kanev et al., 1998) or avoided to some extent by spacing the laser sources out over a wide area and combining the beams at the target. At laser wavelengths, the aperture diameter required is on the order of a meter and many such apertures can be used at modest power.
1.1.7 Ablative Laser & Microwave Propulsion
by Brandstein & Levy (1998). Most of the attention thus far has focused on ablative laser propulsion (Pakhomov and Gregory, 2000).
The laser lightcraft (Wang et al., 2002) has a diameter of 12.2 cm and weighs roughly 50 grams. It is powered by a 10 kW CO2 laser. A parabolic mirror on the underside of the craft, shown in Fig. 1-14, focuses the beam into the engine air or propellant. The pulsed laser heats the air, causing it to break down into a plasma. The plasma strongly absorbs the incoming pulse, heating to roughly 18,000 K before exploding from the annular underside region, generating thrust.
The ablative microwave lightcraft concept of Myrabo and Benford (1994) shown in Fig. 1-15 uses microwaves rather than lasers. The concept is airbreathing but switches to an on-board hydrogen supply for the later stages of ascent (in vacuum). Because of the optics, the beam must point roughly down the axis of the vehicle, so the ascent trajectory is constrained to be flat initially, and an HPM relay satellite can be used to complete the orbital insertion.
Fig. 1-15: Left: Ultralight microwave-boosted microsatellite (liftoff mass 30 to 50 kg). Right: Airbreathing ascent of the microwave lightcraft. (Myrabo and Benford, 1994)
In 2003 ablative propulsion using a 1 MW 140 GHz gyrotron was demonstrated, and is shown on the right of Fig. 1-14. At present, ablative propulsion converts only a few percent of the incident energy to thrust; however, propulsive cycles using double pulses appear to offer efficiencies as high as 40% (Pakhomov et al., 2002).
1.1.8 Hypersonic Airbreathing Propulsion
Some chemical-energy and beamed-energy concepts use an airbreathing ascent. Conventional airbreathing propulsion has a greater Isp (often greater than 1000 seconds)
because oxidizer does not need to be carried. Although the Isp degrades with increasing
significantly increase the engineering difficulty of practical airbreathing launch vehicles. Nevertheless, the Hyper-X program has recently flight tested the X-43 vehicle to demonstrate airframe-integrated scramjet propulsion (Bahm et al.).
Fig. 1-16: The airbreathing ascent regime. Left: High Mach number propulsion performance (Maurice et al., 2001). Right: The airbreathing ascent corridor (Hunt and Martin, 2001).
For ideal beamed-energy airbreathing propulsion the launcher does not expend an on-board propellant of any kind, so the mass of the launcher remains unchanged and the effective Isp is infinite. However, the airbreathing regime of propulsive performance
brings with it other constraints: From a fundamental point of view, an airbreathing launch vehicle must accelerate to a reasonable fraction of orbital velocity within the atmosphere, unlike rockets, which need no air intake and therefore accelerate outside the atmosphere.
possible to overcome the aforementioned problems, an airbreathing beamed-energy launch vehicle in particular would be formidable, carrying little or no propellant.
1.2
Why Microwave Thermal Propulsion? Summary and References
In the field of propulsion, there are many technologies that could solve the launch problem, and each has its particular advantages and drawbacks. This thesis sets forth the new approach of microwave thermal propulsion, which belongs to the wider class of heat exchanger-based propulsion techniques that includes nuclear thermal and laser thermal propulsion.
As described in the introduction, the launch problem is both a technological and economic problem in nature, and all developments in the launch market since 1960, technological or otherwise, have had little or no effect on the launch price because they do not affect the market size or the price the market will bear. The past 40 years of launch prices (Fig. 1-1) suggest that the elasticity of demand is locally flat at the present launch price of $10,000 per kilogram of payload, in essence a metastable level, and that an evolutionary path to a lower launch price does not exist.
It is unclear whether or not a transition to a lower price at which the market size increases is possible with present technology given that the next lowest stable price is thought to be less than $1,000 per kilogram of payload delivered to LEO. With present technology, such a tenfold reduction in cost is achieved by economies of scale, and these economies are in turn supported by a boost in demand, artificial or otherwise. Furthermore, this boost in demand must be sustained until new markets can develop to support the increased volume of launches.
This thesis offers a technological solution to the problem above: The Launch Problem. Using a nonchemical circumvents the specific impulse (Isp) limitation of 460 seconds for
convectional rockets by using a heat-exchanger. This heat-exchanger approach is used for nuclear thermal propulsion, which achieved an Isp of 825 seconds using the
approximately triples the structural mass fraction of the launcher, sparing a large amount of extra mass that can be used to increase the payload fraction and increase structural margins, leading to lower cost construction.
The highly nonlinear relationship between structural margins and probability of failure (Fig. 1-2) raises the possibility of reusability, leaving a vehicle with mass to spare for an increased payload fraction using only a single stage. The combined effect of lower structural cost, greater payload fraction and higher flight rate can profoundly alter the economics of launch, minimizing the need to boost launch demand in order to solve the launch problem.
Although there are alternatives to microwave thermal propulsion, summarized in Table 1-1, these alternatives appear less attractive for various reasons. This is not to say that the problems cited in Table 1-1 are insurmountable, even with modest investment, simply that the microwave thermal approach appears more practical to implement in the near-term. Airbreathing launch generally requires a complex series of elements in the propulsion flow path, and the problem of thermal protection has yet to be fully resolved. Gun launch imposes extreme conditions on the payload that limit its utility. Tethers, skyhooks and space elevators await solutions to several materials science problems relating to high strength threads combined with atmospheric heating and/or longevity in the space micrometeoroid environment. Laser directed energy launch awaits a substantial reduction in the cost ($/W) of suitable lasers, and finally, antimatter and nuclear thermal approaches carry power sources that are presently so heavy that their thrust-to-weight ratio (T/W) is too low for launch, limiting their utility to in-space applications.
Chapter 2 begins with an explanation of how the microwave thermal idea arose. It is perhaps the raison d’être for this unusual thesis, giving some further context for the work as a whole and the motivations that shaped it. Chapter 2 then goes on to describe the unique elements of a microwave thermal launch system. Unlike conventional launch systems, microwave thermal launch has the peculiar constraints of atmospheric absorption and high power breakdown that affect propagation of the microwave beam, which can be generated by a ground-based array of high power gyrotron sources. The finite diameter of the phased array constrains the maximum useful beam range, leading to a particular new type of ascent trajectory that minimizes the downrange distance traveled during orbital insertion by using unusually high acceleration. A simplistic model of the microwave thermal thruster performance and ascent trajectory is given.
system, the results show unexpected time-dependent dynamics that depend on propellant flow rate and are specific to the resonant cavity approach.
An experimental examination of this 200 watt single tube thruster is presented in Chapter 7. The microwave thermal thruster principle is demonstrated and measurements of thruster surface temperature are compared to the theoretical predictions of Chapter 6. Aside from verifying the basic operational parameters of such a thruster, the measured or calculated temperature distribution of the heat exchanger forms the starting point for several further analyses. Also observed is a time-dependent oscillation similar to that predicted in Chapter 6, though given practical constraints, a direct comparison between theory and experiment is deferred to later study.
Chapter 8 explores future analyses that are important to the design of a microwave thermal thruster and that become possible with the heat exchanger temperature model set forth in Chapter 6. Given the lessons learned from the present work, all the expected engineering challenges in reducing a microwave thermal rocket to practice are summarized.
Adams, R.B. and Landrum, D.B. (2002). Analysis of a fusion-electric airbreathing earth to orbit launch vehicle. Journal of Propulsion and Power 18(4): p. 933–942. Arbit, H.A., Clapp, S.D. and Nagai, C.K. (1970). Investigation of the
Lithium-Fluorine-Hydrogen Trimonellant Svstem. J. Spacecraft 7(10).
Bahm, C., Baumann, E., et al. The X-43A Hyper-X Mach 7 Flight 2 Guidance,
Navigation, and Control Overview and Flight Test Results.
Balaam, P. and Micci, M.M. (1995). Investigation of Stabilized Resonant-Cavity
Microwave Plasmas for Propulsion. Journal of Propulsion and Power 11(5): p.
1021–1027.
Bogar, T.J., et. al. (2000). Hypersonic Airplane Space Tether Orbital Launch System -
Phase 1 Final Report. NASA Institute for Advanced Concepts.
Bradley C. Edwards, E.A.W. (2003). The Space Elevator: A Revolutionary
Brandstein, A. and Levy, Y. (1998). Laser propulsion for space vehicles. Journal of Propulsion and Power 12(12).
Brown, W.C. (1984). The history of power transmission by radio waves. IEEE Transactions on Microwave Theory and Techniques MTT-32(9).
Brown, W.C. (1992). Beamed microwave power and its application to space. IEEE Transactions on Microwave Theory and Techniques 40(6).
Bussard, R.W. and DeLauer, R.D. (1958). Nuclear rocket propulsion. McGraw-Hill series in missile and space technology, New York. McGraw-Hill.
Bussard, R.W. and Jameson, L.W. (1995). Inertial-Electrostatic-Fusion Propulsion
Spectrum – Air-Breathing to Interstellar Flight. Journal of Propulsion and Power
11(2): p. 365–372.
Chang, I. (2000). Overview of world space launches. Journal of Propulsion and Power
16(5): p. 853–866.
Chiravalle, V.P., Miles, R.B. and Choueiri, E.Y. (1998). Laser propulsion using a molecular absorber.
Chiravalle, V.P., Miles, R.B. and Choueiri, E.Y. (2001). Numerical simulation of
microwave-sustained supersonic plasmas for application to space propulsion, in
39th AIAA Aerospace Sciences Meeting and Exhibit. Reno, NV.
Curran, E.T. and Murthy, S.N.B. (2000). Scramjet propulsion. Progress in astronautics and aeronautics; v. 189., Reston, VA. American Institute of Aeronautics and Astronautics.
East, T.W.R. (1992). A Self-Steering Array for the Sharp Microwave-Powered Aircraft. IEEE Transactions on Antennas and Propagation 40(12): p. 1565–1567.
Gilreath, H., Driesman, A., et al. (1998). The Feasibility of Launching Small Satellites
with a Light Gas Gun, in 12th AIAA/USU Conference on Small Satellites.
Gunn, S. (2001). Nuclear propulsion – a historical perspective. Space Policy 17: p. 291– 298.
Haeseler, D. (1993). Informational material from Chemical Automatics Design Bureau,
Voronezh. Private Communication to M. Wade.
Hickman, R. (2004). The Space Shuttle and the Future of Space Launch Vehicles.
Humble, R.W., Henry, G.N. and Larson, W.J. (1995). Space propulsion analysis and
design. 1st ed. Space technology series, New York. McGraw-Hill.
Hunt, J.L. and Martin, J.G. (2001). Rudiments and methodology for design and analysis
of hypersonic air-breathing launch vehicles. Progress in Astronautics and
Aeronautics 189: p. 939–978.
J. Mueller, M.M.M. (1992). Microwave waveguide helium plasmas for electrothermal propulsion. Journal of Propulsion and Power 8(5): p. 1017-1022.
Johnson, B.L. (2004). Isomer Energy Source for Space Propulsion Systems. Wright-Patterson Air Force Base, Air Force Institute of Technology.
Kanev, F., Lukin, V. and Lavrinova, L. (1998). Analysis of algorithms for adaptive control of laser beams in a nonlinear medium. Applied Optics 37(21).
Kantrowitz, A. (1972). Propulsion to orbit by ground-based lasers. Astronautics and Aeronautics 10(74-76 ).
Kantrowitz, A. (2004). Regarding 1972 paper. Private Communication to K. Parkin. Kare, J.T. (1995). Laser-Powered Heat-Exchanger Rocket for Ground-to-Orbit Launch.
Journal of Propulsion and Power 11(3): p. 535–543.
Knecht, J.P. and Micci, M.M. (1988). Analysis of a microwave-heated planar
propagating hydrogen plasma. AIAA Journal 26(2).
Koelle, H.H. (1961). Handbook of Astronautical Engineering. McGraw-Hill.
Maurice, L., Edwards, T. and Griffiths, J. (2001). Liquid hydrocarbon fuels for hypersonic propulsion. Progress in astronautics and aeronautics 189: p. 939–978. Minovich, M.A. California Institute of Technology (1972). The laser rocket – A rocket
engine design concept for achieving a high exhaust thrust with high ISP.
Myrabo, L.N. (1995). Hyper-energetic manned aerospacecraft propelled by intense
pulsed microwave beam. SPIE 2557 p. 193–208.
Myrabo, L.N. and Benford, J. (1994). Propulsion of Small Launch Vehicles Using High
Power Millimeter Waves. SPIE 2154: p. 198.
Oda, Y., Nakagawa, T., et al. (2003). An observation of plasma inside of microwave
boosted thruster, in Second International Symposium on Beamed Energy
Propulsion. Sendai, Japan: Conf. Proc. AIP.
Pakhomov, A.V. and Gregory, D.A. (2000). Ablative laser propulsion: An old concept revisited. AIAA Journal 38(4): p. 725–727.
Pakhomov, A.V., Gregory, D.A. and Thompson, M.S. (2002). Specific impulse and other
characteristics of elementary propellants for ablative laser propulsion. AIAA
Journal 40(5): p. 947–952.
Power, J.L. (1992). Microwave electrothermal propulsion for space. IEEE Transactions on Microwave Theory and Techniques 40(6).
Raizer, Y.P. (1972). Propagation of a high-pressure microwave discharge. Soviet Physics JETP 34(Jan): p. 114–120.
Rand, J.L. (1997). Balloon assisted launch to orbit – An historical perspective, in 33rd AIAA/ASME/SAE/ASEE Joint Propulsion Conference and Exhibit, Seattle, WA, July 6–9.
Schmidt, G.R., Bonometti, J.A. and Irvine, C.A. (2002). Project Orion and future prospects for nuclear pulse propulsion. Journal of Propulsion and Power 18(3): p. 497–504.
Schmidt, G.R., Gerrish, H.P., et al. (2000). Antimatter Requirements and Energy Costs
for Near-Term Propulsion Applications. Journal of Propulsion and Power 16(5).
Sutton, G.P. and Biblarz, O. (2001). Rocket propulsion elements. 7th ed, New York. John Wiley & Sons.
Tsiolkovsky, K.E. (1924). Spaceship, 1924, in Izbrannye Trudy, Compiled by Vorob'ev, B.N., Sokol'skii, V.N., General Editor Acad. Blagonravov, Izdatel'stvo Akademii Nauk SSSR, Moscow, Russia, 1962, 222 (in Russian). Edited Machine Translation prepared by Translation Division, Foreign Technology Division, WP-AFB, Ohio, on May 5th, 1966, 307.
Tyson,