VERIFICATION OF AUSTROADS CONCRETE
PAVEMENT DESIGN METHOD USING EVERFE
COMPUTER PROGRAM
Jake Tobler, Roads and Maritime Services of NSW, Australia
Andreas Nataatmadja, University of Southern Queensland, Australia
ABSTRACT
The current Austroads concrete pavement design procedure is based on the PCA’s empirical design method originally developed in 1960’s, which may only be applicable for certain loading and environmental conditions. With the increased utilisation of larger and heavier commercial vehicles, eventually future pavements cannot be designed using this method. While this method is still considered adequate at present, this paper attempts to investigate whether there is a need to revise the design procedure in the future.
In the present study, pavement design was initially performed as per the Austroads procedure using the RMS pavement design spreadsheet for a comparison with the EverFE 3D Finite Element Analysis computer program. Traffic data from Pennant Hills Road in North Parramatta and the eastbound lanes of the M2 motorway in North Epping, Sydney were used.
The results of this study reveals that the equivalent stress values of standard vehicles obtained from Austroads method are lower than the maximum tensile stress obtained from EverFE for unbonded boundary condition by as little as 5.7% (for TRDT) to a maximum of 15.7% (for SAST). However, for the selected traffic compositions, it has been found that the difference in equivalent stress values does not influence allowable axle repetitions and the resulting pavement thickness.
EverFE was subsequently used to model the response of a rigid pavement configuration to hypothetical axle loadings for different wheel positions from pavement edge. It was found that under the assumed traffic loading the pavement stresses could increase threefold but temperature gradient in the pavement would still be the most significant factor in affecting pavement stresses. The overall results therefore suggest that the Austroads concrete pavement design method is presently adequate, but there may be a need to revise the current design method if the traffic loading increases significantly in the future.
INTRODUCTION
The Austroads design method for rigid pavement base thickness calculations (Austroads, 2012) is based on the methods developed in the USA by Packard and Tayabji (1985) for the Portland Cement Association (PCA). Design of pavement thickness using the PCA method is based on semi-empirical charts and models developed based on analytical methods and experimental testing of pavements in the field using typical joint spacing. Changes have been made to the guide to reflect Australian conditions and it is assumed in Austroads that the base and subbase layers are unbonded. Inputs required for design include traffic volume, traffic composition (heavy vehicle percentage), axle load grouping and load distribution, subgrade CBR, project design reliability and concrete flexural strength (Austroads, 2012).
The PCA method only considers a standard 8 tonne Single Axle Dual Tyre (SADT) and a 16 tonne Tandem Axle Dual Tyre (TADT). However, the Austroads method has included Single Axle Single Tyre (SAST), Tandem Axle Single Tyre (TAST), Triple Axle Dual Tyre (TRDT).and Quad Axle Dual Tyre (QADT). In the PCA thickness design procedure, the basic input parameters were assumed as: concrete modulus of elasticity = 28000 MPa, concrete Poisson's ratio µ = 0.15, slab length = 4600 mm, and slab width = 3700 mm.
configurations. However, question remains as to the adequacy of the Austroads design method in predicting traffic loading in the future. Austroads (2012) states that the guide may be used for design of rigid pavements under conventional road traffic conditions. Hence, it is not immediately known if the current Austroads design guide can continue to be extrapolated for future heavy vehicle loading if these traffic conditions change such as increased heavy vehicle mass and dimension limits.
While there are a number of areas which may require further investigation, this paper is focussed on two issues namely, the effects of possible changes in vehicle loading and the influence of the change in vehicle position along a typical concrete pavement. Additionally, effects of temperature variation are also discussed. The finite element computer program EverfFE2.23 (Davids et al., 1998 and 2003) has been selected as an analytical tool in this study because it is a public domain software and easy to use.
PREDICTED CHANGES IN VEHICLE LOADING
A report by Mitchell (2010) identifies the trend in heavy vehicle transportation and road freight regulation. In this report it is forecast that freight volume carried by B-doubles will grow to over 50% of the total road freight moved by the year 2030 with the increased use of B-doubles resulting in a decline in use of other heavy vehicles in freight transportation (assuming no changes to heavy vehicle regulations).
A report from the Australian Department of Infrastructure and Transport (2011) projects a similar trend as the B-double offers improved freight movement efficiency over other forms of heavy vehicle movements. It is stated however that the growth in B-double freight movements will not be as strong as they were 15 years ago. This report also takes the assumption that there is no regulatory change to heavy vehicle regulations.
A report by the ARRB Transport Research (Pearson and Foley, 2001) examined emerging issues in the Australian transportation industry for the years 2000 – 2015. This report summarises the following trends to emerge between the years 2000 to 2015, also making predictions through to the year 2020:
Average number of axles per vehicle will be greater (particularly an increased number of B-doubles and Road trains).
Gross loading allowances will be increasing as shown in Table 1, which compares the predicted allowable mass to the current allowable vehicle masses.
Regulation changes will influence the use of wide single tyres (if no differentiation is made between them and dual tyres on triaxles) and see an increase in their use.
Axle group masses for articulated trucks to increase by approximately 1% per annum with gross vehicle masses increasing by 2% (approximately 0.4 tonne per annum).
Axle group masses for B-doubles increased by approximately 3% per annum with gross vehicle masses increasing by 3% per annum also (equating to approximately one tonne per annum). This trend is greater than the historical trend (0.45 tonne per annum).
Engine power will increase faster than the increase in axle loads leading to greater tractive efforts being applied to road pavements.
Potential move to quad axles for general freight vehicles if an allowable mass of approximately three tonne is granted above the current limit on triaxles.
While the above changes have not fully occurred as yet, current trends show changes are indeed happening in Australian roads albeit rather slowly due to various reasons. Since it is difficult to predict the possible changes in traffic loading with any certainty, a worst-case scenario for the future loading condition will be assumed in this paper solely for the purpose of studying the effects of mass limit increase and axle group variation on rigid pavements.
Table 1: Predicted vehicle loads and current allowable limits (after Pearson and Foley, 2001)
Axle Configuration Predicted Load
(t) 2015 - 2020 Allowable Limit (t)2015
Single axle, single tyre 7 6
Single axle, dual tyre 10-13 9
Tandem axle, dual tyre 19-20 16.5
Triaxle, dual tyre 26-27 20
Gross mass, 6 tyre articulated trucks
50-53 42.5
CHANGES IN VEHICLE POSITIION
While the PCA method considers that most heavy vehicles are located at a distance of 600 mm from the edge line, it assumes that 6% of traffic passes on the edge line of the travel lane. These assumptions may be questionable in the light of more recent studies.
In a study by Lee and Garner (1996) the lateral positioning of vehicles is examined as it provides guidance on the edge loading for pavement slabs. A statement is made that if all vehicles were to travel in the centre of the travel lane, heavy vehicles would travel closer to the edge line than passenger cars due to the wider dimensions of heavy vehicles. The study also found that as the number of axles on a vehicle increased, the vehicles travelled closer to the edge line and shoulder of the pavement.
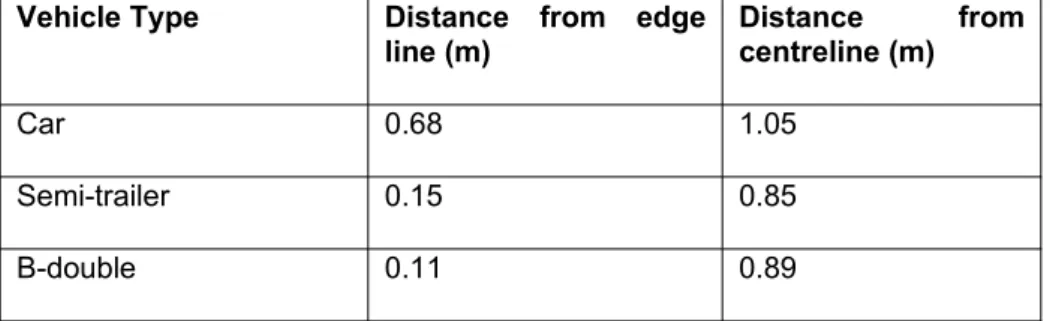
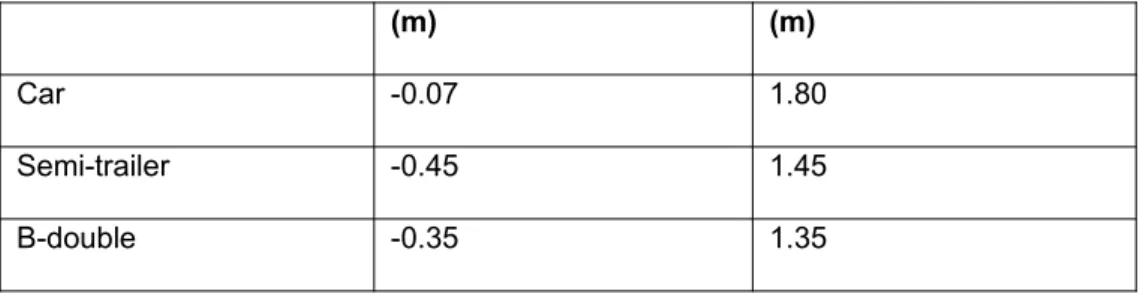
Bunker and Parajuli (2006) performed a study to examine lateral positioning of light vehicles and heavy vehicles on a roadway examining both unopposed vehicle travel in which there was no oncoming traffic and opposed vehicle travel with traffic in the opposite direction. The results summarised that vehicle positioning for passenger cars was located straddling the edge line of the travel lane whilst heavy vehicle positioning was located closer to the edge line (unopposed) and into the shoulder area (opposed). The results are shown in Table 2 and Table 3.
Results of the study found that the 95th percentile passenger car, semi-trailer and B-double
straddled the edge line of the road. The study also showed that both semi-trailers and B-doubles occupied part of the shoulder, with semi-trailers wandering further onto the road shoulder than B-doubles. The findings of this study are in agreement with the findings of the previous study by Lee and Garner (1996), showing larger volume of traffic travelling on the edge line than has been allowed for in the PCA method and Austroads deign guide.
Table 2: Unopposed vehicle lateral positioning (Bunker and Parajuli, 2006)
Vehicle Type Distance from edge
line (m) Distancecentreline (m) from
Car 0.68 1.05
Semi-trailer 0.15 0.85
B-double 0.11 0.89
Table 3: Opposed vehicle lateral position (Bunker and Parajuli, 2006)
(m) (m)
Car -0.07 1.80
Semi-trailer -0.45 1.45
B-double -0.35 1.35
With the study by Bunker and Parajuli (2006) finding the 95th percentile of traffic (cars and heavy
vehicles included) travels straddling the edge line, pavement stresses due to wheel loading may be different from those predicted by the Austroads method.
ANALYTICAL APPROACHES
The full background to EverFE software can be obtained from the available literature (Davids et al., 1998 and 2003) with features and capabilities of the software outlined. EverFE software provides a simple, easy to use platform for the analysis of rigid pavement stresses of varying configurations and under different loading conditions inclusive of thermal loadings induced from temperature gradients. Although EverFE provides a powerful processing tool for rigid pavement analysis, it is a relatively new program and utilisation of the software is not widespread in Australia. The capabilities and ease of use of the software do however provide an opportunity for utilisation of the software in the design and development of rigid pavements in Australia.
For the purpose of this study, TLD data were provided by RMS-NSW in spreadsheet format identifying axle group types and their percentage of total heavy vehicle traffic, separated into axle group loadings from 10 kN through to 400 kN. These data were used to design a model concrete pavement for further analyses (for future loading conditions, different wheel positions and temperature effects) with EverFE.
Assumed future loadings
Studies undertaken by Mitchell (2010) and the Australian Department of Infrastructure and Transport (2011) focused on heavy vehicle productivity trends and forecasts up to the year 2030. In these studies the forecast trends that were observed were based on the condition that there would be no changes to heavy vehicle rules and regulations. Therefore, in reflection of assumptions made by these studies for determination of future heavy vehicle loading parameters, it was assumed there would be no significant changes to current laws and regulations on heavy vehicles for the purpose of this study.
The report by Pearson and Foley (2001) identified the trends for axle mass increase for articulated trucks of about 1% and for gross vehicle mass increase by 2% per annum, which equates to an increased loading capacity of 0.4 tonne per annum. Trends for B-doubles predicted increases to axle loading and gross vehicle mass by up to 3% (approximately 1.0 tonne) per annum. If these changes were to occur at some stage in the future (perhaps for along some restricted routes), significant changes in axle loading values as shown in Table 4 would be expected. These hypothetical axle loadings were adopted for the current study.
Table 4: Current and hypothetical future axle load limits
Axle Configuration Current Limit in kN Hypothetical FutureLimit (2050) in kN
SAST 58.86 165.62
SADT 88.29 248.44
TAST 107.91 303.64
TADT 161.86 455.47
TRDT 196.2 552.08
Most PCA investigators considered a single axle load with dual wheels although Packard and Tayabji (1985) consider different types of axle groups as shown in Table 4. EverFE only allows full-axle loading inputs for SAST, SADT, TAST and TADT. Hence, analysis of TRDT and QADT configurations requires axle superposition to produce the desired configuration, with axle spacing specified as 1500 mm.
As previously discussed, it was identified that currently B-doubles travel much closer to the pavement edge. Traffic load distribution was therefore analysed for two wheel positions i.e. with the outermost wheel at a distance of 600 mm and 100 mm from the edge line.
Model pavement
A model pavement was required to be analysed so that concrete tensile stresses could be calculated using the Austroads equations and EverFE software for comparison. Pavement layer thicknesses were initially determined using the RMS rigid pavement design spreadsheet according to Austroads (2012). For the purposes of this study traffic data were taken from two roads in Sydney, NSW. The first was from Pennant Hills Road in North Parramatta and the second was from the eastbound lanes of the M2 Motorway in North Epping, Sydney. The traffic volume was taken as 5.1 x10⁷ HVAGs. The project reliability factor was 95%, representing a
load safety factor of 1.20.
In this study dowelled pavements were chosen (to represent jointed pavements with good load transfer); hence, a slab length of 4.5 m was used for the pavement modelling. The selected pavements incorporated integrally cast shoulders. In accordance with the RMS standard drawings, the shoulder widths were taken as 2.5 m.
A relatively low subgrade CBR value of 3.5% was assumed as used by Darestani et al. (2006). As per the Austroads Design Guide, 150 mm LCS was selected for subbase; which provides an Effective Subgrade Strength CBR value of about 50%. For pavement thickness design, a concrete flexural strength of 4.5MPa was assumed.
To avoid unnecessary complexity in the model and to represent the worst pavement geometry a 2x2 pavement slab configuration (with one travel lane plus a shoulder) was adopted. This pavement was analysed using EverFE with the following input parameters, which are generally in agreement with the values used in the Austroads (2012):
Slab length (length between transverse joints) – 4500mm (Austroads,2012)
Slab width (distance between longitudinal joints) – 3500mm for vehicle lane and 2500mm for shoulder
Slab thickness – 240mm (calculated using RMS rigid pavement design spreadsheet)
Base/subgrade – One layer of 150mm thickness
Skew angles – Zero degrees
Material Properties:
Modulus of elasticity (slab) – 28000 MPa
Poisson’s ratio (slab) – 0.2
Subbase depth – 150mm
Coefficient of Thermal Expansion – 1x10⁻⁵ mm/mm/°C
Concrete density – 2400 kg/m3
Modulus of elasticity (subbase) – 5000 MPa
Poisson’s ration (subbase) – 0.2
Subgrade modulus of reaction – 0.03 MPa/mm (CBR approximately 3.5)
Dowels – Eleven evenly spaced cylindrical dowels of 32mm diameter, 450mm length, embedment length 225mm and 1000 MPa dowel-slab modulus support
Ties – Tie bars of 13mm diameter, 1000mm length and 1000mm spacing centre to centre.
unbonded condition it was assumed that a frictionless interface exists with no shear transfer between base and subbase. A tensionless subgrade condition was also assumed as per the studies by Darestani et al. (2006).
PAVEMENT ANALYSIS AND RESULTS
Comparison between Austroads and EverFE
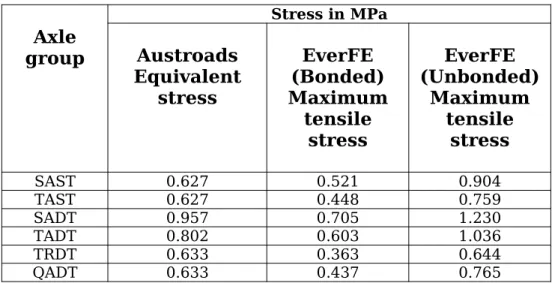
EverFE was used to model the response of a rigid pavement configuration to the current allowable loading conditions for the axle configurations specified. The axles were input into EverFE using the load parameters as specified in Table 4. Axle loading was positioned in the centre of the loaded slab, 600 mm from the edge line. The EverFE maximum tensile stress values, as shown in Table 5, were compared with the equivalent stress values from Austroads.
Table 5: Comparison of stresses for current traffic loading
Axle
group
Stress in MPa
Austroads
Equivalent
stress
EverFE
(Bonded)
Maximum
tensile
stress
EverFE
(Unbonded)
Maximum
tensile
stress
SAST 0.627 0.521 0.904
TAST 0.627 0.448 0.759
SADT 0.957 0.705 1.230
TADT 0.802 0.603 1.036
TRDT 0.633 0.363 0.644
QADT 0.633 0.437 0.765
It can be seen that EverFE for an unbonded boundary condition results in higher, and for bonded condition produces lower maximum tensile stresses than the Austroads equivalent stress. The differences between Austroads and EverFE (unbonded) are to be expected due to the fact that the former considers the distribution of wheel truck in transverse direction. As Austroads (2012) assumes unbonded boundary condition between base and subbase, the subsequent discussions on the effects of wheel loading and wheel positions will focus on the EverFE results for an unbonded boundary condition.
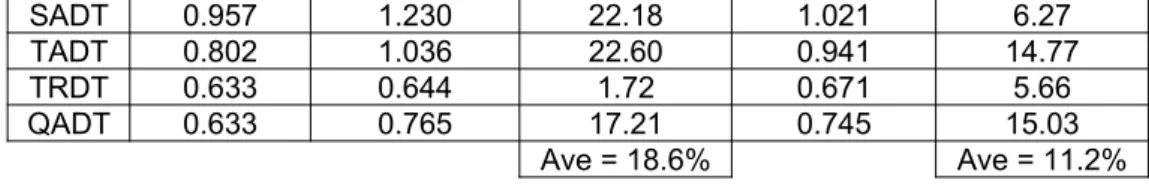
The results shown previously were based on a finite element mesh structure of 12 elements. To determine the significance of meshing on the results and to minimise the differences, finite element meshing was increased. It was found that meshing of 13 elements presented results closer to those of Austroads (Table 6). It can also be seen that on the average, the Austroads equivalent stress is about 11% lower than the maximum stress obtained from EverFE.
Table 6: Comparison between 12 elements and 13 elements in EverFE for current traffic loading Axle Grou p Austroads equivalent stress (MPa) EverFE (Unbonded) 12 elements Maximum tensile stress (MPa) Austroads % lower compared to EverFE (Unbonded) 12 elements EverFE (Unbonded) 13 elements Maximum tensile stress (MPa) Austroads % lower compared to EverFE (Unbonded) 13 elements
SAST 0.627 0.904 30.68 0.744 15.73
SADT 0.957 1.230 22.18 1.021 6.27
TADT 0.802 1.036 22.60 0.941 14.77
TRDT 0.633 0.644 1.72 0.671 5.66
QADT 0.633 0.765 17.21 0.745 15.03
Ave = 18.6% Ave = 11.2%
As a further check, the maximum tensile stress values from EverFE for the current traffic loading were input into the Austroads design spreadsheet to determine influence on allowable axle repetitions. It was found that the allowable axle load repetitions for fatigue analysis remaining unchanged at infinite repetitions for the adopted thickness. Under erosion analysis, the allowable repetitions also remain unchanged. This indicates that the differences in stress values between Austroads and EverFE do not influence allowable axle repetitions of the model pavement.
From these results it can be concluded that EverFE provides adequate capability in modelling of Austroads equivalent stresses for any loading and pavement conditions. The maximum tensile stress values obtained from EverFE can be used to determine the allowable load repetitions for damage analysis as per Austroads (2012).
Effects of future traffic loading
The Technical Basis to the Austroads Design Guide (Austroads, 2008) describes that an upper limit of 65 kN wheel load is assumed in the design guide. It is stated in the document that while there are no sighted references to justify the use of this limit, the limit is considered sufficient for coverage of the current Australian legal axle limits. On the other hand, the axle loads have been forecast (Table 4) in excess of this upper maximum load limit. Although these forecast increases have yet to occur, if such axle loads increases do occur in the future the Austroads method would need to be revised to predict responses to these high loads and hence concrete pavement performance.
EverFE can in this case be used to obtain the maximum tensile stresses under future loading conditions which may subsequently be used for damage analysis by assuming the applicability of the current formulas for calculating allowable load repetitions. However, since the erosion analysis of the Austroads method does not take into consideration the pavement stress, only fatigue failure will be subsequently discussed.
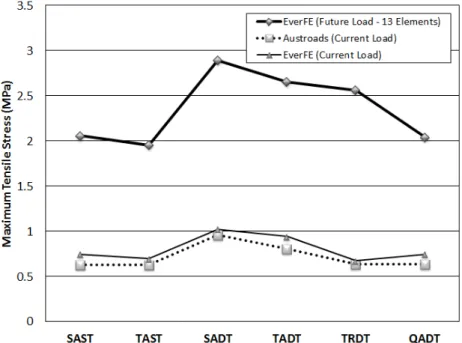
EverFE was then used to obtain the response of the model pavement to the hypothetical future loadings for the axle configurations specified (see Table 4). Axle loading was positioned in the centre of the loaded slab, 600 mm from the edge line as per the previous modelling conditions. Thirteen elements were used for FE meshing. The following results shown in Table 7 were obtained for the maximum tensile stresses in the pavement. A comparison between the pavement maximum stresses under the hypothetical loadings and the current stresses (as calculated by Austroads and EverFE) is presented in Figure 1 for comparison.
Table 7: EverFE maximum tensile stress for the hypothetical future loading
Axle Group Type
EverFE maximum tensile stress 13 elements (MPa)
SAST 2.059
TAST 1.952
SADT 2.891
TADT 2.654
TRDT 2.560
QADT 2.044
conditions increases threefold from the average tensile stress of the current loading. Under such high stresses it was found that future loading conditions will result in early fatigue failure of the 240 mm thick model concrete pavement. While it would be possible to increase the concrete thickness to cater for the future loading conditions, such an iterative procedure would be time consuming and hence, was not attempted in the current study.
Figure 1: Comparison of concrete tensile stresses under different loading conditions
Effects of wheel position
As previously described, past studies suggested that commercial vehicles tend to travel closer to the edge pf pavement (see Table 2). EverFE was therefore used to model the response of the model rigid pavement to both the current allowable loadings and the hypothetical future loadings at two different wheel locations. The first was for an axle loading positioned at the centre of the loaded slab at a location 600 mm from the edge line (i.e. Austroads condition), and the second involves a similar axle loading but positioned 100 mm from the pavement edge. For each case pavements were modelled as unbonded. The following results, shown in Table 8 were obtained from EverFE.
Table 8: EverFE maximum tensile stress at two different wheel positions (for current loading)
Maximum tensile stress (MPa)
Axle types
600 mm from edge line
100 mm from edge line
Stress
Difference (MPa)
SAST 0.744 0.860 0.116
SADT 0.695 1.121 0.426
TAST 1.021 0.776 -0.245
TADT 0.941 1.004 0.063
TRDT 0.671 0.707 0.036
QADT 0.745 0.730 -0.015
To quantify the impact of a changed load location under current loading conditions; maximum tensile stress results from EverFE were input the Austroads spreadsheet to determine its influence on the allowable axle repetitions for concrete fatigue. It was subsequently found that while changing the load location to the edge line of pavement tends to increase the concrete stresses under different axle types, for current loading conditions such changes does not significantly alter the fatigue life of the model pavement.
The impact of shifting the load location for the hypothetical axle loadings was also studied. The impact on pavement stress from the shift in load location is shown in Table 9.
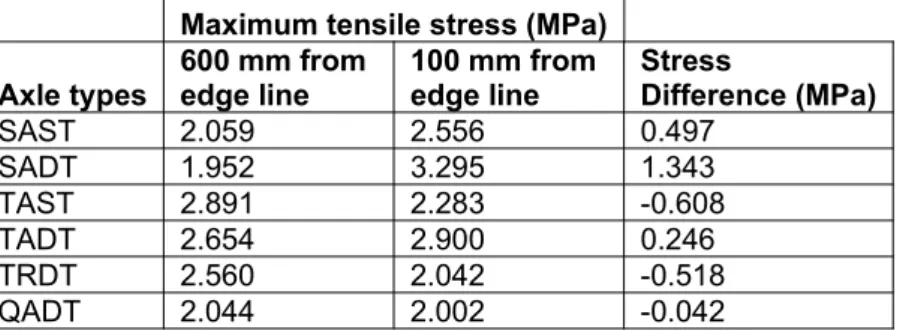
Table 9: EverFE maximum tensile stress at two different wheel positions (for future loading)
Maximum tensile stress (MPa)
Axle types 600 mm fromedge line 100 mm fromedge line StressDifference (MPa)
SAST 2.059 2.556 0.497
SADT 1.952 3.295 1.343
TAST 2.891 2.283 -0.608
TADT 2.654 2.900 0.246
TRDT 2.560 2.042 -0.518
QADT 2.044 2.002 -0.042
From Table 9 it can be seen that maximum stress increases for a shift in load location to the edge line for axle configurations of SAST, SADT and TADT. A maximum stress increase of 1.343 MPa was found for axle configuration of SADT. A maximum stress decrease of 0.608 MPa was obtained for the TAST axle configuration. The general trends of the stress results were similar to those results obtained for the current load limits albeit the higher stress difference for SADT and TAST which may aggravate the stress effect on pavement life.
Effects of temperature gradient
EverFE offers capability in modelling pavements subjected to axle loading and loading from temperature gradients and was therefore used to determine the change in pavement stress from inclusion of temperature differentials. A sensitivity analysis was performed on the results presented previously for both current and hypothetical future loading conditions, including both loading locations (600 mm from edge line and 100 mm from edge line).
Four temperature differentials between the top and bottom surface layers of the concrete base were analysed. These were positive and negative temperature differentials of 10C, and positive and negative temperature differentials of 25C. These values represent the average and the extreme values of temperature differentials, respectively. Boundary condition between base and subbase plays a significant role in pavement performance as this influences the ability of the pavement to curl freely. As stated previously Austroads assumes an unbonded boundary condition, although temperature gradients are not considered in any detail as part of the design procedure. For the purpose of sensitivity analysis in this section pavements were modelled using both unbonded and bonded boundary conditions.
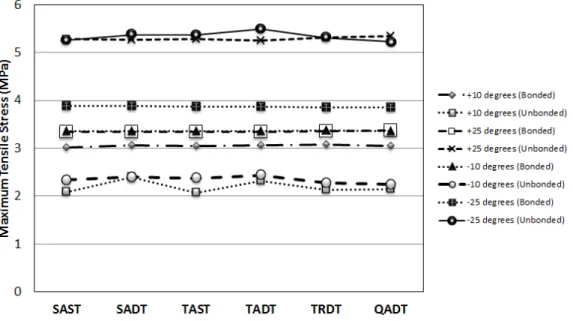
Sensitivity analysis for the impact of temperature gradients was conducted on current allowable axle loads under both loading conditions, at 600 mm from edge line and 100 mm from edge line (Figure 2 to Figure 5). From observation of results it can be seen that with consideration of temperature gradients, pavement stress is predominantly dictated by the temperature differential and not by the axle loading. This is evident in the graphs for both current-loading cases as they present almost linear results for all axle group types under each condition tested. Stress resultants are varied depending on each temperature differential and boundary condition, however in each case pavement stress does not vary to a large degree across all axle types.
Stress results for temperature gradient of 10C (positive and negative differentials) presented lower stress values for unbonded boundary conditions, with stress values for both conditions below the flexural strength of the concrete pavement. For temperature differential of 25C these results were different, with unbonded boundary condition showing higher pavement stress compared to bonded condition. The increase in this condition resulted in stress levels above the flexural strength of the concrete pavement (maximum tensile stress value of 5.59 MPa). In this extreme condition concrete strength adopted in design would have to be increased to allow for a large temperature induced stress in the pavement, as the concrete used in design is 4.5 MPa.
Figure 2: Maximum tense stresses under the current load (600 mm from edge line)
Figure 3: Maximum tensile stresses under the current load (100 mm from edge line)
CONCLUSIONS
It was found that the average concrete stress for the hypothetical future loading is much larger than the average stress for the current loading condition. It was also discovered that that while changing the load location to the edge line of pavement tends to increase the concrete stresses under different axle types, for current loading conditions such changes does not significantly alter the fatigue life of pavement. The general trends of the stress results under the hypothetical future loading are similar to those results obtained for the current load limits but the higher stress difference for SADT and TAST may adversely affect the pavement life.
For the assumed temperature differentials, results returned stress values greater than those obtained from vehicle landing only. This suggests that in some cases pavement stress may be governed by the temperature difference between the top and bottom pavement surfaces. Moreover, the choice between bonded and unbonded will have to be carefully considered in order to minimise the effect of temperature gradients.
The overall results therefore suggest that the Austroads concrete pavement design method is presently adequate, but there may be a need to revise the current design method if the traffic loading increases significantly in the future.
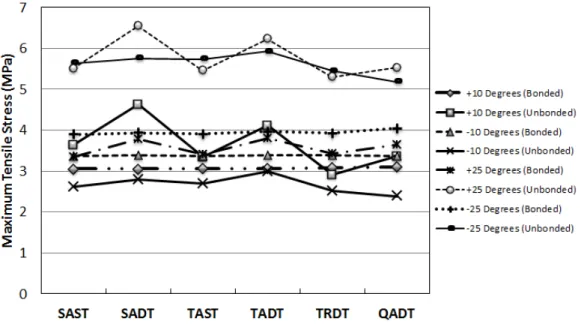
Figure 4: Maximum tensile stresses under the hypothetical load (600 mm from edge line)
REFERENCES
Austroads 2004, ‘Technical Basis of Austroads Pavement Design Guide’ Austroads Inc., Sydney, Australia.
Austroads 2012, ‘Guide to Pavement Technology Part 2: Pavement Structural Design’, Austroads Inc., Sydney, Australia.
Bunker, J. & Parajuli, A., 2006, ‘Examining Lateral Positions of Cars and Heavy Vehicles on a Two Lane, Two Way Motorway’, Journal of Transport Engineering in Australia, vol. 10, no. 2, p. 1-11.
Darestani, M.Y., Nataatmadja, A., Thambiratnam, D.P. & Baweja, D. 2006, ‘A review of 2004 Austroads Rigid Pavement Design’, Proceedings of the 22nd ARRB Conference – Research into Practice, Canberra, Australia.
Davids, W.G., Turkiyyah, G.M., & Mahoney, J.P., 1998, ‘EverFE: Rigid Pavement Three-Dimensional Finite Element Analysis Tool’, Transportation Research Record 1629, Transportation Research Board, Washington, D.C., USA, pp. 41–49.
Davids, W.G., Wang, Z., Turkiyyah, G., Mahoney, J.P. & Bush, D., 2003, ‘3D Finite Element Analysis of Jointed Plain Concrete Pavement With EverFE 2.2’, Transportation Research Record 1853, Transportation Research Board, Washington, D.C., USA, 92–99.
Department of Infrastructure and Transport, 2011, ‘Truck Productivity: Sources, Trends and Future Prospects’, Australian Government, Canberra, Australia.
Lee, C.E. & Garner, J.E., 1996, ‘Collection and Analysis of Augmented Weigh-In-Motion (WIM) Data’, Texas Department of Transportation, Report no. 987-8, Texas, USA.
Mitchell, D. 2010, ‘Heavy Vehicle Productivity Trends and Road Freight Regulation in Australia’, Proceedings Australasian Transport Research Forum 2010, Canberra, Australia.
Packard, R.G. & Tayabji, S.D., 1985. ‘New PCA Thickness Design Procedure for Concrete Highway and Street Pavements’, Third International Conference on Concrete Pavement Design and Rehabilitation, Purdue, West Lafayette, Indiana, USA.
Pearson, R.A., & Foley, G.D., 2001, ‘Emerging Issues in the Australian Transport Industry (2000-2015)’, ARRB Transport Research Ltd. Research Report No. 350.
AUTHOR BIOGRAPHIES
Jake Tobler: Jake works full-time as a Project Engineer with the Roads and Maritime Services (RMS) in New South Wales, working out of the Tamworth District Office. Jake completed the Bachelor of Engineering (Honours) – Civil Major in 2015 whilst studying externally through the University of Southern Queensland.
Andreas Nataatmadja: Andreas is a Senior Lecturer in Geotechnical and Pavement Engineering at the University of Southern Queensland and a Fellow of the Institution of Engineers, Australia. He holds a PhD from Monash University. He previously worked for RMS-NSW as the Supervising Pavement Engineer (Design & Analysis).
Copyright Licence Agreement
The Author allows ARRB Group Ltd to publish the work/s submitted for the 27th ARRB Conference, granting ARRB the non-exclusive right to:
The Author retains the right to use their work, illustrations (line art, photographs, figures, plates) and research data in their own future works