Smoking cessation and smoking patterns in the general population: a one year follow-up
Robert West1 Andy McEwen1
Keith Bolling2 Lesley Owen2
1St George’s Hospital Medical School Cranmer Terrace, London SW17 0RE 2Health Education Authority, London
Correspondence to: Professor Robert West,
Psychology Department, 6th Floor Hunter Wing, St George’s Hospital Medical School, Cranmer Terrace, London SW17 0RE, UK.
Tel: 0181 725 5596 Fax: 0181 767 27451 Email: [email protected]
Summary
Objective: to assess the prevalence of motivation and behaviours relating to smoking
cessation and attempts at harm minimisation and the stability of these over a one year
period; to identify demographic, social, behavioural and psychological predictors of
attempts to stop smoking and the success of these attempts.
Design: Face to face interviews were carried out with a national sample of UK
smokers in April/May 1996 with follow-up one year later.
Subjects: 1911 adult smokers of whom 1012 were followed up one year later (68% of
those who were contactable).
Results: Thirty-one percent of smokers reported making at least one quit attempt
during the follow-up period and 17% made a quit attempt in the first 9 months of that
period. Of these 29% were still not smoking at least 3 months later. Fifty-one percent
of smokers had tried to cut down in the year leading up to the first survey. There was a
fair degree of consistency over time in individual smokers’ desires and intentions to
stop smoking across both surveys and in the incidence of quit attempts and attempts to
cut down. Beliefs about the effects of smoking on future health and having a partner
who disliked their smoking were positively associated with making a quit attempt at
follow-up while reporting enjoying smoking at baseline was negatively associated
with making a quit attempt at follow-up. Time to first cigarette and age of starting
Conclusions: Motivation and behaviours relating to smoking cessation are prevalent
and fairly stable over time. Different factors appear to be related to attempts to stop
and the success of those attempts. Interventions to increase smoking cessation in the
The health benefits of smoking cessation are well established1,2. It is also known that a
majority of smokers would like to stop and indeed attempt to stop many times3, 4. The
large majority of quit attempts take place without professional support, for example
from a smokers clinic4. Our understanding of self-quitting is far from complete. This
report describes analyses from a longitudinal study examining factors that predispose
towards making quit attempts and factors that affect the chances of success of quit
attempts. Recently, interest has also increased in smoking reduction and switching to
low tar cigarettes in the attempt to mitigate the harm done by smoking5. The study
examined the prevalence of attempted harm minimisation strategies and the
relationships between these and subsequent cessation.
The present study involved measurement of a range of variables that may be expected
to influence smoking cessation. A distinction may be made between factors that
influence attempts to stop smoking and those that influence the chances of success of
quit attempts. Cessation rates are lower in more deprived socio-economic groups6-8
and lower educational levels8-10and this appears to reflect both attempts to stop and
the success of those attempts. The chances of success of quit attempts are lower in
those who live with smokers versus non-smokers, and those who live alone versus
with a partner11-13. There is some evidence that younger age of starting smoking is
associated with a reduced probability of cessation14. In general social support has been
shown in some studies to be linked with success of attempts to stop9. Conversely,
spending more time in the company of smokers appears to be related to lower success
rates in quit attempts7,15,16,. There is some evidence that women find it harder to stop
found that younger smokers are more likely to make a quit attempt10but older
smokers may be more likely to be successful in attempts to stop smoking7,10 . Having
managed to go a long time without smoking in recent years has been shown in some
studies to be related to success of attempts to stop19. It has also been suggested that
having children at home may affect desire to stop and success at stopping20. As one
would expect, stated intentions to stop and desire to stop are related to subsequent quit
attempt9. The concept of ‘readiness to change’ behaviours has been formalised in the
stages/cycle of change model21 and there is consistent, though unsurprising, evidence
to indicate that smokers who are at a stage that is closer to the actual behaviour of
stopping smoking are more likely to be ex-smokers at follow up22. As one would
expect, attempts to stop smoking are a function of the perceived adverse effects of
smoking and smoking cessation as well as the perceived benefits6,8,23,16,24,. There is
some evidence that confidence in success may affect attempts to stop or the success of
those attempts9,25,26. Amount smoked has consistently been shown to predict failure of
attempts to stop smoking19as have questionnaire measures of dependence16,7,22.
Most of the above research has examined cessation in the context of specific
interventions. These range from work-site smoking bans to trials of nicotine
replacement therapies. Clearly the special characteristics of the samples may influence
the results. Surprisingly little data are available from population surveys. The present
study examined the variables concerned in a general population sample.
With increased interest in smokers’ attempts at harm minimisation, there has been
some research into whether cutting down may affect subsequent quitting behaviour4.
the imperative to stop is reduced; or it may increase the chances because it
demonstrates that control can be gained over the behaviour. With regard to success at
stopping, cutting down may reduce the chances because each cigarette becomes more
rewarding or it may increase the chances if it is associated with reduced nicotine
intake27. One may also find an association between cutting down and subsequent
stopping smoking because both reflect a continuing desire to improve one’s health.
Relatively little information is available on the stability of motivations and intentions
about stopping smoking and smoking behaviours themselves. There is evidence that
past quit attempts predict future ones9. Some studies have examined how far smokers
remain in or move between ‘stages of change’ in relation to smoking behaviour but
the definitions of these stages make it difficult to interpret the results in terms that can
be readily understood in everyday terms. The present study provided an opportunity to
examine the stability of desire to stop smoking, intention to stop, attempts to cut down
and attempts to stop.
Thus the present study reports findings relating to:
1. Prevalence of motives and behaviours relating to cessation and attempts at harm
reduction
2. The stability of these behaviours over a 12 month period
3. Demographic, social, behavioural and psychological predictors of attempts to stop
smoking
4. Demographic, social, behavioural and psychological predictors of success of
Methods
Sample and procedures
Out of a sample of 1911 smokers identified in a survey in April/May 1996, a total of
1012 smokers at the time of the first survey were followed up one year later.
In the first survey, 1911 smokers were interviewed face-to-face in their homes during
Spring and early Summer of 1996. The sample was selected to be representative of the
adult population. A random probability sampling technique was employed using
postcodes in England and Wales as the basic sampling frame. Three hundred postcode
sectors were selected with a probability proportional to population after stratification
by local authority and social class indicators. Within each postcode sector one address
was selected at random and then every 15th address subsequently with a total of 38
addresses being selected in each postcode sector (giving a total of 11400 households).
At least four attempts were made to contact a responsible adult (16+) at each address.
Where contact was made (successful contact was made with 81% of all valid
addresses) demographic details, and details of smoking habits were collected for each
adult in the household.
In households where it was established that one current smoker or recent ex-smoker
(given up in the past 6 months) existed (N=3133), a further interview was attempted.
Where there was two or more, the one with the most recent birthday was selected and
the interview attempted. The response rate was 61% among households where there
One year after the initial interview an attempt was made to re-contact the sample for a
follow-up interview. A total of 301 respondents had moved or died. No contact was
achieved in 132 cases. A total of 1012 usable interviews were conducted (68% of the
contactable cases).
The fieldwork was carried out by BMRB International.
Appendix A describes the measures used in this report.
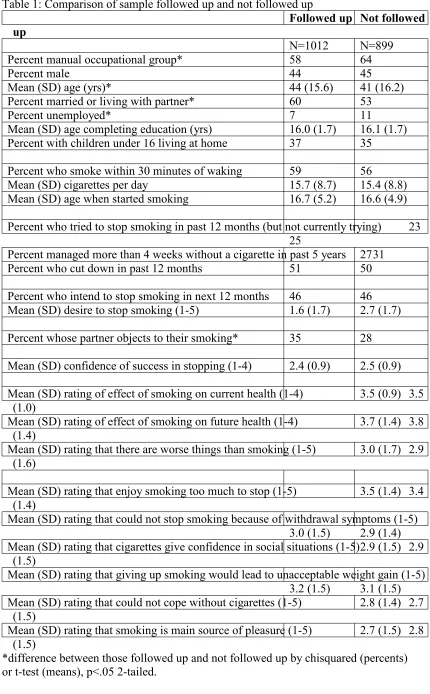
Table 1 shows the demographic characteristics and smoking behaviour of the sample
followed up and those not followed up. Those followed up were older, more likely to
be married, less likely to be unemployed and less likely to be from manual social
classes. They were more likely to have partners that objected to their smoking.
However, there were no differences in terms of smoking behaviour or intentions about
stopping smoking.
Table 1 here
Results
The results are presented in terms of answers to key research questions posed at the
start of the study.
Prevalence of motives and desires relating to smoking cessation
year period?
31% (309) of the 1012 smokers contacted at follow up reported making a failed quit
attempt or were ex-smokers by the second survey. This was made up of 10% (104)
who had made a failed quit attempt, 11% (106) who reported that they were currently
trying to quit and 10% (99) who reported that they were not current smokers.
2. What is the medium term quit rate?
A total of 167 (17%) of the smokers at baseline made a quit attempt 3 to 12 months
before the follow-up survey. Of these, 54 (5% of all the original smokers and 29% of
those made a quit attempt 3 to 12 months ago) were not smoking at the time of the
second survey.
3. How much variation is there in daily cigarette consumption among smokers
over a one-year period?
This analysis was limited to smokers of manufactured cigarettes at both time points. A
large number of smokers smoked hand rolled cigarettes at one or both time points and
these were excluded because of the difficulty of determining equivalence between
amount of tobacco used and manufactured cigarettes per day. Among 661 smokers of
manufactured cigarettes at both time points the mean cigarette consumption in this
group was 16.1 per day in both surveys. The mean absolute variation between the two
periods was 4.1 cigarettes per day and the Pearson correlation between cigarettes per
day in the two time periods was 0.66 (p<.001).
4. Are smokers who make an attempt to stop smoking in one year more likely to
make another attempt the following year?
at the time of the first survey. This was to avoid the possibility of a tautological
relationship between measures of quit attempts in the two time periods (because the
baseline quit attempt may have extended into the follow-up period). There were 865
smokers not currently making an attempt to stop at the time of first survey of which
23% had made an attempt in the previous 12 months. Those who had made a quit
attempt prior to the first survey were 2 times more likely to make another quit attempt
in the following 12 months than those who had not (40.7% vs 16.5%), chisquared=
55.3, p<.001.
5. What is the prevalence of switching to low-yield brands over a one-year
period?
Of 661 smokers who were smokers of manufactured cigarettes at both surveys, 7%
said they had switched to a low tar brand in the second survey.
6. What proportion of smokers make a deliberate attempt to cut down in a one
year period?
Of the 1012 smokers at baseline, 51% (518) said at follow-up they had attempted to
cut down in the preceding year. Of the 683 respondents who were smoking
manufactured cigarettes at follow-up (some of whom had been smoking hand-rolled
cigarettes at baseline), those who said that they had tried to cut down reported a daily
consumption of 14.9 cigarettes per day (SD=7.2) compared with 16.9 cigarettes per
day (SD=9.8) among those who did not say they had cut down, F=9.2, p<.005.
7. In what proportion of cases is cutting down seen as a prelude to cessation?
Of the 518 smokers who attempted to cut down in the 12 months prior to the first
who cut down then managed to stop altogether were not included because the question
was only asked of continuing smokers.
8. Are smokers who make an attempt to cut down in one year more likely to
make an attempt to cut down in the next?
Of the 913 respondents who were smokers in both surveys, cutting down in the first
survey was predictive of cutting down in the second survey (53% vs 31%,
chisquared=48.4, p<.001).
9. What is the stability of desire to stop, intentions to stop?
Of the 913 respondents who were smokers in both surveys, those who wanted to stop
in the first survey were 3 times more likely to say they wanted to stop in the second
than those who did not, chisquared=206.3, p<.001. Thus 70% of those who wanted to
stop in the first survey also wanted to stop at follow-up compared; while only 24% of
those who did not want to stop in the first survey wanted to stop at follow-up. Note
that this analysis excludes smokers who managed to stop by the time of the second
survey.
Of those who were smokers in both surveys, those who intended to stop within the
next 12 months were nearly 4 times more likely to intend to stop in the next 12
months at the follow-up survey, (54% vs 15%, chisquared=155.1, p<.001). Again, it
should be noted that smokers who stopped by the second survey were necessarily
excluded.
10. What factors measured in the baseline survey are associated with making an
Table 2 shows bivariate associations of predictor variables and attempt to stop
smoking in those who were smoking at baseline and not currently making a quit
attempt. The analyses were limited to the 865 smokers not currently making an
attempt to stop at the time of the baseline survey. This was to avoid contamination of
the dependent variable by that quit attempt. Of the 865, 221 reported having made at
least one quit attempt in the previous 12 months when asked at the follow-up survey.
It is apparent that previous quit attempts and attempts to cut down as a prelude to
cessation predicted future quit attempts, as did desire to quit and beliefs about the
damaging health effects of smoking. Interestingly, cutting down for its own sake was
not associated with subsequent quit attempts. Enjoyment of smoking was negatively
associated with subsequent quit attempts.
Table 2 here
11. What is the best model of this process?
These analyses were limited to 865 smokers who were not in the process of making an
attempt to stop smoking at the time of the first survey of whom 221 subsequently
made a quit attempt in the following 12 months.
To gain a better understanding of the process that may be involved in making a quit
attempt, we undertook a forward stepwise regression in which variables representing
three kinds of factor were included as potential predictors of attempts to stop smoking
Beliefs about health risks were represented by the ratings of current health effects,
future health effects and that there are worse things than smoking (see Table 2).
Enjoyment was represented by the rating of endorsement of the statement about
enjoying smoking too much to stop. Social pressure was represented by the rated
endorsement of the statement that the respondent’s partner would prefer them not to
smoke. Note that behavioural indices of motivation to stop such as past quit attempts,
cutting down as a prelude to cessation and intention to stop were not included because
the aim was to obtain an understanding of the beliefs and influences behind quit
attempts.
Tables 3
A forward stepwise multiple regression revealed that enjoyment of smoking and
beliefs about the future health effects of smoking and perception that their partner
wanted them to stop independently predicted quit attempts at follow-up (Table 3). A
similar result was obtained when a backwards stepwise regression was used.
12. What factors in the baseline survey are associated with success of attempts to
stop smoking (defined as lasting three or more months)?
Table 4 shows the bivariate associations between baseline factors and success of
attempts to stop. This involved a series of logistic regressions using only the 167
respondents who had made a quit attempt at least three months ago. It included those
who were smokers but were making a quit attempt at the time of the first survey.
Successes were those that were still not smoking (N=54). Success at quitting was
cigarette of the day soon after waking and who believed that withdrawal symptoms
were a problem for them.
Table 4 here
13. What is the best model of this process?
A forward stepwise logistic regression involving all the variables that had shown a
bivariate relationship with success at stopping smoking (see Table 4) revealed two
which were independently associated with success at stopping: time to first cigarette
of the day and age of starting smoking (Table 5). A similar result was obtained with a
backwards stepwise regression.
Table 5 here
Discussion
The results indicate that attempts to stop smoking and reduce the harm from smoking
are remarkably common. These behaviours are also quite stable from one year to the
next as is motivation to stop smoking. Daily cigarette consumption is relatively stable
but perhaps not as stable as might be thought. Attempts to stop smoking come under
the control of different factors than those that influence the success of those attempts.
Beliefs about the health effects of smoking, enjoyment of smoking and pressure from
one’s partner appear to be important in attempts to stop while behavioural markers of
dependence are related to success of those attempts. We did not find that confidence
in success was independently related to attempts to stop or success of attempts.
The percentage of smokers achieving cessation for at least 3 months (29% of those
making a quit attempt) is in line with some previous surveys but not others. Gritz et
al28found a 6 month abstinence rate of 27% in a cohort of smokers attempting to stop
whereas Hughes et al29found 11% reporting abstinence for 3 months after the quit
date. Differences may be accounted for by differences in what counts as a quit attempt
and exactly how abstinence is defined. The issue of population quit rates and deriving
consistent indices of these requires further research.
These findings are unusual in enabling a distinction to be made between attempts to
stop and success of those attempts and they indicate the need to distinguish between
these two aspects of the process. They suggest that efforts to induce more quit
attempts should continue to communicate about the health effects of smoking, and
perhaps address issues of enjoyment and social support. To improve the success of
attempts to stop, attention needs to be paid to dependence issues. It should be noted,
however, that this study did not examine all the possible factors that might come into
play.
This study was limited in several respects. First of all, 32% of those contactable did
not respond to the follow-up survey. However, those that responded did not differ
from non-respondents in terms of smoking-related variables and where they did differ
(e.g. in social class) this would result in a restricted range of values that would
militate against showing associations. Nevertheless, the issue of representativeness of
the sample as a whole must be considered. It is reasonable to assume that in general
smokers who are more interested in cessation may be more likely to respond. Thus the
It is noteworthy that females were over-represented in the sample. This would arise
out of the fact that women would be more available for interview. A second issues is
that there is no agreed-upon definition of what constitutes a quit attempt and it is
likely that respondents construed this in various ways. This would have added noise to
the data and would not undermine the validity of positive associations that were
found. Thirdly, there was no biochemical verification of smoking status. However, in
surveys of this kind (as opposed to intervention trials) there is very little deception30.
The definition of success at stopping was to some extent arbitrary including people
who would subsequently have resumed smoking and those that would become
permanent ex-smokers. However, a cut-off had to be drawn at some point and it had
to include enough people who had made a quit attempt sufficiently long ago that their
data could be used. At present there are no data to suggest that different factors are
linked to relapse to smoking after three months than in the early part of the quit
attempt.
A further issue concerns the ability of respondents to recall their quit attempts. It is
likely that the longer ago these were the less likely they were to be recalled,
particularly if they only lasted a short period. This would lead to an underestimate of
the number of quit attempts and an overestimate of the success rates from quit
attempts. In fact this seems likely to have been the case because a success rate of more
than 30% for 3 months or more is more than three times what has been found in
prospective studies of self-quitting31. Figure 2 shows the proportions of smokers at
each survey who said their most recent quit attempt was in each of the 12 months
leading up to the survey. There is evidence of a large peak 4 months prior to the
before that in November of both years. This coincides with the budget at which tax
increases on cigarettes are announced. There were also peaks at 0 and 12 months ago
which probably reflect quantising error (in the same way that cigarettes per day
typically clusters around multiples of 5). Apart from that there is evidence of a trend
towards fewer quit attempts the further back one goes and this suggests a forgetting
effect. It is also possible, however, that this is a genuine phenomenon in which less
quitting goes on in the summer months.
Figure 1 here
If quit attempts are being forgotten then their actual frequency must be remarkably
high, the more so given that some smokers try to stop several times in a given year.
Surveys of this kind are essential in tracking changes in cessation patterns and can in
principle be used to provide indicators enabling the effects of national or regional
policies to be assessed. However, further thought needs to be given to ways of
collecting the necessary data. For this study, certain simplifications and assumptions
had to be made and the results, while useful for examining correlates of quitting
behaviours, are weak in terms of estimating the prevalence of those behaviours.
To obtain reliable indicators of incidence of attempts to stop smoking a rolling
programme of surveys on a month by month basis could be mounted asking only
about attempts to stop in that month. This should minimise any forgetting bias. To
assess the success rates of quit attempts it will be important to include current and
an ex-smoker will need to be decided upon; 12 months’ continuous abstinence would
seem sensible. Thus the survey could identify each month a sample of people who
were smokers 12 months ago and establish what proportion stopped in that month the
previous year and have not smoked since. Thus for each month one would have the
incidence of quit attempts in that month and the incidence of successful quitting for
the corresponding month one year ago. After one year of surveying, it would be
possible to match the quitting figures with the attempt to stop figures to establish the
success rate.
Conclusion
This study found that there was a fair amount of consistency in smokers’ motivation
and behaviour relating to stopping smoking and attempts at harm reduction over a 12
month period. Different factors appeared to come into play in generating quit attempts
versus the success of those attempts. Continuing to communicate the health effects of
smoking may be a useful strategy in generating quit attempts. In addition, it may be
important to address smokers’ perceived enjoyment of smoking and to utilise social
pressures. However, tackling the problem of dependence is important in converting
quit attempts into lasting abstinence.
References
1. Doll, R., Peto, R., Wheatley, K., Gray, R. & Sutherland, I. Mortality in relation to
smoking: 40 years’ observation on male British doctors. British Medical Journal,
2. US Department of Health and Human Services. The health consequences of
smoking cessation: a report of the US Surgeon General. Rockville (MD): Public
Health Service, Office on Smoking and Health, 1990.
3. Office for National Statistics. Living in Britain: Results from the 1996 General
Household Survey. London, The Stationary Office, 1997.
4. West, R., McEwen, A. & Bates, C. Sex & Smoking: Comparisons between male &
female smokers. London: No Smoking Day, 1999.
5. Hughes, J. Reduced Smoking: An Introduction and Review of the Evidence.
Addiction, in press, 1999.
6. Hymowitz, N., Cummings, K., Hyland, A., Pechacelk, T. & Hartwell, T.
Predictors of smoking cessation in a cohort of adult smokers followed for five
years. Tobacco Control, 1997; 6 (Suppl.), S57 - S62.
7. Richmond, R., Kehoe, L. & Webster, I. Mulitvariate models for predicting
abstention following intervention to stop smoking by general practitioners.
Addiction, 1993; 88: 1127-1135.
8. Wilcox, N., Prochaska, J., velicer, W. & DiClemente, C. Subject characteristics as
predictors of self-change in smoking. Addictive behaviors, 1985; 10: 407-412.
cessation of smoking after the introduction of workplace smoking bans. Health
Psychology, 1991; 10:336-342.
10. Hatziandreu, E., Pierce, J., Lefkopoulou, M. et al Quitting smoking in the United
States in 1986. Journal of the National Cancer Institute, 1990; 82(17): 1402 - 6.
11. Gourlay, S., Forbes, A., Marriner, T., Pethica, D. & McNeil, J. Prospective study
of factors predicting outcome of transdermal nicotine treatment in smoking
cessation. British Medical Journal, 1994; 309: 842-846.
12. Office for National Statistics Living in Britain: Results from the 1994 General
Household Survey. London, The Stationary Office, 1996.
13. Senore, C., Battista, R., Shapiro, S., Segnan, N., Ponti, A., Rosso, S. & Aimar, D.
Predictors of Smoking Cessation Following Physicians’ Counselling.Preventive
Medicine, 1998; 27: 412 - 421.
14. Chen, J. & Millar, W. Age of smoking initiation: implications for quitting. Health
Reports, 1998; 9: 39-46.
15. Hebert, J., Kristeller, J., Ockene, J., Landon, J., Luippold, R., Goldberg, R. &
Kalan, K. Patient characteristics and the effect of three physician-delivered
smoking interventions. Preventive Medicine, 1992; 21: 557-573.
cessation programme administered by general practitioners. International journal
of Epidemiology, 1988; 17: 530-534.
17. Jacobsen, B. The Ladykillers: Why Smoking is a Feminist Issue. London, Pluto
Press, 1981.
18. Jarvis, M. Gender and Smoking: Do Women Really Find it Harder to Give Up?
British Journal of Addiction, 1984; 79:383 - 387.
19. Farkas, A., Pierce, J., Zhu, S., Rosbrook, B., Gilpin, E., Berry, C. & Kaplan, R.
Addiction versus stages of change models in predicting smoking cessation.
Addiction, 1996; 91: 1281-1292.
20. Hibbard, H. Social roles as predictors of cessation in a cohort of women smokers.
Women and Health, 1993; 20: 71 - 79.
21. DiClemente, C., Prochaska, J., Fairhurst, S., Velicer, W., Velasquaz, M. & Rossi,
J. The process of smoking cessation: an analysis of precontemplation,
contemplation and preparation stages of change. Journal of Consulting and
Clinical Psychology, 1991; 59: 294-304.
22. Rohren, C., Croghan, I., Hurt, R., Offord, K., Marusic, Z. & McClain, F.
Predicting smoking cessation outcome in a medical centre from readiness:
23. Hu, S. & Lanese, R. The applicability of the theory of planned behavior to the
intention to quit smoking across workplaces in southern Taiwan. Addictive
Behaviors, 1994; 23: 225-237.
24. Velicer, W., DiClemente, C., Prochaska, J. & Brandenburg, N. Decisional balance
measure for assessing and predicting smoking status. Journal of Personality and
Social Psychology, 1985; 48: 1279-1289.
25. Gulliver, S., Hughes, J., Solomon, L. & Dey, A. An investigation of self-efficacy,
partner support and daily stress as predictors of relapse to smoking in self-quitters.
Addiction, 1995; 90: 767 - 772.
26. Haaga, D. Issues in relating self-efficacy to smoking relapse: importance of an
‘Achilles’ heel’ situation and prior quitting experience. Journal of Substance
Abuse, 1990; 2: 191-200.
27. Benowitz, N., Jacob, P., Kozlowski, L. & Yu, L. Influence of smoking fewer
cigarettes on exposure to tar, nicotine, and carbon monoxide. New England
Journal of Medicine, 1986; 315: 1310 - 3.
28. Gritz, E., Carr, C., & Marcus, A. (1988). Unaided smoking cessation: Great
American Smokeout and New Year's Day Quitters. Journal of Psychosocial
Oncology, 6,217-234.
S., Shea, P., Solomon, L. J., & Flynn, B. S. (1992). Smoking cessation among
self-quitters. Health Psychology, 11, 331-4.
30. Prescott-Clarke P, Primatesta P, eds. Health Survey for England 1996. London:
The Stationery Office, 1998
31. Hughes, J., Gulliver, S., Fenwick, J. et al. Smoking cessation among self-quitters.
Table 1: Comparison of sample followed up and not followed up
Followed up Not followed up
N=1012 N=899 Percent manual occupational group* 58 64
Percent male 44 45
Mean (SD) age (yrs)* 44 (15.6) 41 (16.2)
Percent married or living with partner* 60 53
Percent unemployed* 7 11
Mean (SD) age completing education (yrs) 16.0 (1.7) 16.1 (1.7) Percent with children under 16 living at home 37 35
Percent who smoke within 30 minutes of waking 59 56
Mean (SD) cigarettes per day 15.7 (8.7) 15.4 (8.8) Mean (SD) age when started smoking 16.7 (5.2) 16.6 (4.9)
Percent who tried to stop smoking in past 12 months (but not currently trying) 23 25
Percent managed more than 4 weeks without a cigarette in past 5 years 2731 Percent who cut down in past 12 months 51 50
Percent who intend to stop smoking in next 12 months 46 46 Mean (SD) desire to stop smoking (1-5) 1.6 (1.7) 2.7 (1.7)
Percent whose partner objects to their smoking* 35 28
Mean (SD) confidence of success in stopping (1-4) 2.4 (0.9) 2.5 (0.9)
Mean (SD) rating of effect of smoking on current health (1-4) 3.5 (0.9) 3.5 (1.0)
Mean (SD) rating of effect of smoking on future health (1-4) 3.7 (1.4) 3.8 (1.4)
Mean (SD) rating that there are worse things than smoking (1-5) 3.0 (1.7) 2.9 (1.6)
Mean (SD) rating that enjoy smoking too much to stop (1-5) 3.5 (1.4) 3.4 (1.4)
Mean (SD) rating that could not stop smoking because of withdrawal symptoms (1-5) 3.0 (1.5) 2.9 (1.4) Mean (SD) rating that cigarettes give confidence in social situations (1-5)2.9 (1.5) 2.9
(1.5)
Mean (SD) rating that giving up smoking would lead to unacceptable weight gain (1-5) 3.2 (1.5) 3.1 (1.5) Mean (SD) rating that could not cope without cigarettes (1-5) 2.8 (1.4) 2.7
(1.5)
Mean (SD) rating that smoking is main source of pleasure (1-5) 2.7 (1.5) 2.8 (1.5)
Table 2: Prediction of attempts to stop smoking measured at 12-month follow up: bivariate associations (N=865)
Predictor (Measured at baseline) Odds ratio Signif
Social class 1.07 ns
Sex 0.79 ns
Age 1.00 ns
Marital status or living with partner 1.22 ns
Unemployed 0.99 ns
Age completing education 1.02 ns
One or more children under 16 living at home 0.91 ns
Time to first cigarette of the day 1.08 ns
Cigarettes per day 0.99 ns
Age when started smoking 1.02 ns
Whether tried to stop smoking in past 12 months 3.49 P<.001 Longest time gone without smoking in past 5 years 1.20 P<.001 Whether cut down in past 12 months 1.62 P<.005 Whether cut down in the past 12 months 'as a first step to cessation' vs not cutting
down 3.30 P<.001
Whether cut down in the past 12 months for its own sake vs not cutting down
1.09 ns
Whether intend to stop in next 12 months 2.26 P<.001 How much want to stop smoking 1.44 P<.001
Whether partner objects to smoking (vs with no partner or partner does not mind) 1.58 P<.005
Confidence of success in stopping 0.93 ns
Belief about effect of smoking on current health 1.20 P<.05 Belief about effect of smoking on future health 1.15 P<.05 Belief that there are far worse things for self than smoking 0.87 P<.05
Belief that enjoy smoking too much to stop 0.74 P<.001 Belief that could not stop smoking because of withdrawal symptoms 0.94 ns
Belief that cigarettes give confidence in social situations 0.99 ns
Belief that giving up smoking would lead to unacceptable weight gain 0.97 ns
Table 3: Final model from forward stepwise regression of predictors of attempts to stop smoking (N=865)
Variable Odds ratio Signif
Table 4: Prediction of success of attempts to stop smoking: bivariate associations (N= 167)
Predictor Odds ratio Signif
Social class 0.77 p<.05
Sex 0.79 ns
Age 1.02 ns
Marital status 1.90 ns
Employment status 0.98 ns
Age completing education 1.04 ns
Children under 16 living at home 0.98 ns
Time to first cigarette of the day 1.38 p<.005
Cigarettes per day 0.95 p=.05
Age when started smoking 1.08 p<.01
Whether tried to stop smoking in past 12 months 0.38 p<.02 Longest time gone without smoking in past 5 years 1.08 ns Whether cut down in past 12 months 0.90 ns Whether cut down in the past 12 months 'as a first step to cessation' vs not cutting
down 0.59 ns
Whether cut down in the past 12 months for its own sake vs not cutting down
1.30 ns
Whether intend to stop in next 12 months 0.73 ns
Whether wants to stop smoking 0.77 ns
How much want to stop smoking 0.93 ns
Whether partner objects to smoking 1.84 ns
Confidence of success in stopping 0.84 ns
Belief about effect of smoking on current health 0.74 ns Belief about effect of smoking on future health 0.95 ns Belief that there are far worse things for self than smoking 1.16 ns
Belief that enjoy smoking too much to stop 0.84 ns Belief that could not stop smoking because of withdrawal symptoms 0.76
p<.05
Belief that cigarettes give confidence in social situations 0.88 ns Belief that giving up smoking would lead to unacceptable weight gain 1.07
ns
Table 4: Final model from forward stepwise logistic regression predicting success of attempts to stop smoking (N=167)
Predictor Odds ratio Signif
Time to first cigarette of the day 1.36 p<.005
Appendix A: Measures Used
Variable Measure
Social class Based on occupation of chief income earner, I professional, II managerial, IIIN clerical, IIIM skilled manual, IV semi-skilled manual, V unskilled manual
Sex Male=2, Female=1
Age Years
Marital status Married or living with partner=2, single, divorced or widowed=0 Unemployed Currently unemployed and seeking work=1, other=0
Age completing education
Responses in categories: 14 or less, 15, 16, 17-19 (coded as 18), 20+ (coded as 21)
Children under 16 living at home
Are there any children under 16 living in the household? Yes=1, No=0
Time to first cigarette of the day*
How soon after waking do you normally smoke your first cigarette of the day? 1=within five minutes, 2=within 15 minutes, 3=within 30 minutes, 4=within 1 hr, 5=within 2 hrs, 6=more than 2 hrs
Cigarettes per day* (Usual daily consumption on weekdays*5+usual daily consumption at weekends*2)/7 (manufactured cigarettes only)
Age when started smoking
How old were you when you first started to smoke cigarettes regularly? Years
Whether tried to stop smoking in past 12 months
In the last 12 months have you tried to give up smoking altogether? Yes=1, No=0
Longest time gone without smoking in past 5 years
Not counting any times when you have been ill or in hospital, what is the longest time you have ever gone without smoking over the past 5 years? 1 =have not stopped, 2=less than a day, 3=a day, 4=up to a week, 5=up to 4 weeks, 6 =up to 3 months, 7=up to 6 months, 8=up to 12 months, 9=longer
Whether cut down in past 12 months*
Within the last 12 months, have you ever cut down on the amount you smoke? Yes=1, No=0
Whether cut down as a prelude to cessation
Were you cutting down as a first step towards stopping smoking or were you just cutting down? First step to stopping=1, Just cutting down=0
Whether switched to lower tar brand in past 12 months
Have you tried to0 change to a lower tar cigarette in the last 12 months? Yes=1, No=0
Whether intend to stop in next 12 months*
How much want to stop smoking*
Do you want to give up smoking altogether? No=1. If Yes, How much do you want to give up smoking altogether? 2=a little, 3=a fair amount, 4=quite a lot, 5=very much indeed.
Whether partner objects to smoking
As far as you can say which if any of the statements on this card would your partner agree with regarding your smoking? ‘Would prefer it if I didn’t smoke’ or ‘hates me smoking and wants me to stop’=1, otherwise=0
Confidence of success in stopping
If you decided to give up smoking altogether in the next few months, how likely do you think you would be to succeed? 1=very unlikely, 2=fairly unlikely, 3=fairly likely, 4=very likely
Beliefs about effect of smoking on current health
How much if at all do you think the amount you smoke affects your health now? 1=Not at all, 2=just a little, 3=a fair amount, 4=a great deal Beliefs about effect of smoking on future health
How much if at all do you think the amount you smoke will affect your health in the future? 1=Not at all, 2=just a little, 3=a fair amount, 4=a great deal
Belief that there are far worse things for self than smoking
‘There are things which are far worse for me than smoking’, 1 =Strongly disagree to 5=strongly agree.
Belief that enjoy smoking too much to stop
‘I enjoy smoking too much to give it up’, 1=Strongly disagree to 5=strongly agree.
Belief that could not stop smoking because of withdrawal symptoms
‘I don’t think I could give up smoking because I would suffer too much from withdrawal symptoms’, 1=Strongly disagree to 5=strongly agree.
Belief that cigarettes give confidence in social situations
‘I feel more confident in social situations if I have a cigarette’, 1 =Strongly disagree to 5=strongly agree.
Belief that giving up smoking would lead to unacceptable weight gain
‘If I tried to give up smoking I would probably put on too much weight’, 1=Strongly disagree to 5=strongly agree.
Belief that could not cope without cigarettes
‘I couldn’t cope without cigarettes’, 1=Strongly disagree to 5 =strongly agree.
Belief that smoking is main source of pleasure
‘Smoking is my main source of pleasure’, 1=Strongly disagree to 5=strongly agree.
Attempt to stop smoking at follow-up
Code 1 if Yes to: ‘Are you currently trying to give up smoking altogether?’ or ‘In the last 12 months have you tried to give up smoking altogether?’ or No to ‘Do you smoke cigarettes nowadays?’. Otherwise code 0.
Code 1 if attempted to stop (see above) and reported that attempt was at least 3 months before follow-up interview. Code 0 otherwise.
Succeeded in attempt to stop smoking
In those that attempted to stop smoking in first 9 months of follow-up, code 1 if not currently smoking and not smoked for at least three months and 0 otherwise.