Probing the nuclear structure in the vicinity of
78Ni
E.Sahin1,∗,K.Hady´nska-Kle¸k1,2,3,4,F.L.Bello Garrote1, andA.Görgen1for the EURICA and SEASTAR collaborations 1University of Oslo, Department of Physics, Oslo, Norway.
2Laboratori Nazionali di Legnaro dell’INFN, Legnaro, Italy 3University of Surrey, Department of Physics, Surrey, UK 4Heavy Ion Laboratory, University of Warsaw, Poland
Abstract. Theoretical and experimental studies of neutron-rich nuclei have shown that the general concept of shell structure is not as robust and universal as earlier thought, but can exhibit significant changes as a function of neutron excess. New magic numbers appear and some other conventional ones disappear mainly because of a different ordering of the single-particle orbitals. In the present contribution, recent experimental
studies of neutron-rich Cu isotopes, performed at RIKEN usingβdecay and one-proton knockout reactions, will be discussed. Neutron-rich nuclei near78Ni were populated through in-flight fission of238U on thick9Be targets in both experiments. In the β-decay study, 75,77Ni nuclei were implanted into the WAS3ABi silicon array, whileγrays from excited states in75,77Cu emitted afterβdecay of the implanted ions were detected with the EURICA Ge detector array that was surrounding the active stopper. In a second experiment within the SEASTAR campaign at RIKEN, the same75,77Cu nuclei were produced in (p,2p) knockout reactions from 76,78Zn beam particles at around 250 MeV/nucleon impinging onto the MINOS liquid hydrogen target. In the latter experiment the DALI2 NaI array was used to detect de-excitationγrays measured in coincidence with Cu nuclei identified in the Zero Degree Spectrometer. Both studies are complimentary and greatly contribute to our understanding on the nuclear structure in the78Ni region.
1 Introduction
Over the last two decades, investigations at radioactive ion beam facilities have revealed that atomic nuclei undergo significant changes in their shell structure when moving towards neutron-rich isotopes. This so-called shell evo-lutionfor nuclei with large neutron-to-proton asymmetry is due to specific properties of the nucleon-nucleon inter-action, which can lead to a different ordering of
single-particle orbitals and, hence, to the appearance or dis-appearance of shell gaps. The phenomenon is by now well established in lighter mass regions withZ <28 and N<40.
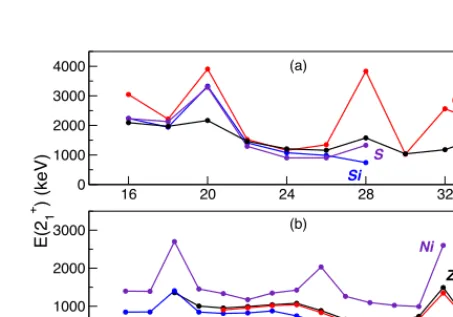
As an example, Figure 1a shows the energies of the first excited 2+states,E(2+
1), as a function of neutron
num-berNfor isotopes of Si, S, Ar, and Ca. One can clearly see the disappearance of the neutronN =28 shell gap in 42Si [1],44S [2], and46Ar [3], as evidenced by their low
E(2+
1) energies. On the other hand, the excitation
ener-gies for52,54Ca are very high, indicating the appearance
of new shell gaps at N = 32 and 34. The shell gap at N = 34 appears to be rather robust, as illustrated by the
high excitation energy of the 2+
1 state in52Ar [4]. The
re-duction or even collapse of shell closures when going far away from stability is connected with an onset of deforma-tion. The phenomenon where deformation is favored due to particle-hole excitations across major shells has been
∗e-mail: [email protected]
16 20 24 28 32
0 1000 2000 3000 4000
E(2
1
+ ) (keV)
25 30 35 40 45 50
N 0
1000 2000 3000
Ca
S Si
Ni Zn
Ar
Ge Fe
(a)
(b)
Figure 1.First excited 2+states as a function of neutron number
(a) for Si, S, Ar, Ca and (b) for Fe, Ni, Zn, and Ge isotopes. Data is taken from References [4, 6, 7].
termed "island of inversion". In general, the coexistence of intruder and normal configurations leads to shape co-existence, which consequently can be expected in regions of disappearing shell closures. As an illustrative example
44S can be mentioned, where a prolate 0+
1 ground state
co-exists with a spherical excited 0+
2 state [5]. In this case
the reduction of theN =28 shell gap enables quadrupole
excitations from the 1f7/2to the 2p3/2orbitals.
EPJ Web of Conferences 223, 01054 (2019) https://doi.org/10.1051/epjconf/201922301054
In the light of these results, questions arise concerning
the robustness of theN = 50 shell gap for neutron-rich
nuclei, the magic character of78Ni, and possible intruder
states and an onset of deformation in the region around
78Ni. Experimental information in this region of the
nu-clear chart is very sparse due to the extreme proton-to-neutron ratio, which makes production of these nuclei dif-ficult and experimental studies in general very
challeng-ing. The energy of the 2+
1 state in78Ni was only very
re-cently measured to be 2.6 MeV [6]. This high energy
sup-ports the notion of doubly magic character for78Ni and
the persistence of theZ =28 andN =50 shell gaps (see
Figure 1b). However, detailed studies on the evolution of single-particle orbitals in this mass region are still very much incomplete. The aim of the experiments that are pre-sented here was to contribute to a more quantitative
under-standing of the shell structure near78Ni. More specifically,
the evolution of the proton single-particle energies will be discussed as a function of neutron number, together with the consequences for the occupation of intruder configura-tions and the onset of deformation and collectivity.
2 Evolution of the Z=28 shell gap
Changes in the single-particle structure are strongly re-lated to certain properties of the (residual) interactions be-tween nucleons. In particular the tensor component of the monopole interaction was found to be responsible for the changes in the single-particle energies (SPEs) [8]. The ten-sor force is attractive between two orbits with relative spin
orientationsj>=l+1/2 andj<=l−1/2 (or j<=l−1/2
and j
> =l+1/2) and repulsive between those with spin
orientationsj>and j>(or j<andj<).
Figure 2. Calculated proton SPEs for the Ni chain. Figure is taken from Ref. [9]. The same color code is also used in Fig-ures 3, 4, and 6.
The evolution of the Z = 28 shell gap was
previ-ously investigated by systematically studying the
prop-erties of the Ni isotopes from 68Ni (N = 40) to 78Ni
(N = 50). Figure 2 shows the resulting proton SPEs as
a function of neutron number from shell model calcula-tions for the Ni isotopes [9]. Note that the SPEs change more dramatically when including the tensor component of the monopole interaction (solid lines), while the relative
changes are less pronounced when the tensor component is not included (dashed lines). According to these calcula-tions, the changes in the proton SPEs lead to an inversion
of theπ2p3/2andπ1f5/2orbitals with increasing number of
neutrons in theν1g9/2orbital. The crossing of theπ2p3/2
andπ1f5/2 orbitals is consistent with the measured 5/2−
spin-parity for the ground state in75Cu [10]. Furthermore,
the calculations predict a reduction for theZ = 28 shell
gap as a result of the attraction between theπ1f5/2and the
ν1g9/2and the repulsion between theπ1f7/2andν1g9/2
or-bitals.
Proton SPEs as a function of neutron number can be determined by studying single-proton excitations in the Cu
(Z = 29) isotopes, where the last uncoupled proton
re-sides above theZ=28 gap in the f5/2pshell (1f5/2, 2p3/2,
2p1/2). Indeed, the neutron-rich copper isotopes from69Cu
(N=40) to79Cu (N=50) have played an important role to
study the single-particle structure in the78Ni region.
Pre-vious experimental and theoretical studies, however,
indi-cated that the low-lying states in Cu nuclei can have diff
er-ent origins [11, 12] and can be classified into the following types:
• the 3/2−and 5/2−"single-particle" states, dominated by
the single-proton configurations,π2p3/2andπ1f5/2,
re-spectively,
• the "particle-core coupled" states from 9/2−to 1/2−and
from 7/2− to 1/2−will appear as a result of the π2p3/2
andπ1f5/2single-particle excitations coupled to the first
excited 2+ state of the even-even Ni core, denoted as
2p3/2⊗2+1 and 1f5/2⊗2+1, respectively
• the 7/2−"intruder" state arises from the excitation of a
proton from the 1f7/2orbital across theZ=28 shell gap,
leaving a hole in the 1f7/2orbit,i.e. π1f−7/12.
2.1 Beta-decay of75,77Ni
Cu nuclei have been studied in detail up to73Cu via
dif-ferent reaction mechanisms such as β-decay, Coulomb
excitation, and single- and multi-nucleon transfer
reac-tion studies [13–21]. For the heavier isotopes 75Cu and
77Cu, only the spin and parity of the ground state was
known [10], and, in case of75Cu, two low-lying isomeric
states [22, 23]. To identify low-lying states and
estab-lish the level schemes for75Cu and77Cu,β-decay
experi-ments were carried out at RI Beam Factory (RIBF) of the RIKEN Nishina Center [24]. The secondary beam
parti-cles near78Ni were produced via fission reaction of the
238U primary beam on a thick 9Be target. After particle
identification in atomic number (Z) and mass-to-charge
ra-tio (A/Q) using the TOF −Bρ−∆E technique [25] in
the BigRIPS fragment separator [26, 27], the ions were delivered to the experimental setup through the ZeroDe-gree Spectrometer (ZDS) [27] and implanted in a stack of eight highly pixelised double-sided silicon strip detectors (WAS3ABI [28]). Each DSSSD had 60 horizontal and 40 vertical strips of 1 mm pitch, respectively. Surrounding the implantation detector was the EURICA germanium
detec-tor array [28, 29] for the detection ofγrays emitted after
βdecay of the implanted ions.
EPJ Web of Conferences 223, 01054 (2019) https://doi.org/10.1051/epjconf/201922301054
In the light of these results, questions arise concerning
the robustness of theN = 50 shell gap for neutron-rich
nuclei, the magic character of78Ni, and possible intruder
states and an onset of deformation in the region around
78Ni. Experimental information in this region of the
nu-clear chart is very sparse due to the extreme proton-to-neutron ratio, which makes production of these nuclei dif-ficult and experimental studies in general very
challeng-ing. The energy of the 2+
1 state in78Ni was only very
re-cently measured to be 2.6 MeV [6]. This high energy
sup-ports the notion of doubly magic character for78Ni and
the persistence of theZ =28 andN =50 shell gaps (see
Figure 1b). However, detailed studies on the evolution of single-particle orbitals in this mass region are still very much incomplete. The aim of the experiments that are pre-sented here was to contribute to a more quantitative
under-standing of the shell structure near78Ni. More specifically,
the evolution of the proton single-particle energies will be discussed as a function of neutron number, together with the consequences for the occupation of intruder configura-tions and the onset of deformation and collectivity.
2 Evolution of the Z=28 shell gap
Changes in the single-particle structure are strongly re-lated to certain properties of the (residual) interactions be-tween nucleons. In particular the tensor component of the monopole interaction was found to be responsible for the changes in the single-particle energies (SPEs) [8]. The ten-sor force is attractive between two orbits with relative spin
orientationsj>=l+1/2 andj<=l−1/2 (or j<=l−1/2
and j
> =l+1/2) and repulsive between those with spin
orientationsj>and j>(or j<and j<).
Figure 2. Calculated proton SPEs for the Ni chain. Figure is taken from Ref. [9]. The same color code is also used in Fig-ures 3, 4, and 6.
The evolution of the Z = 28 shell gap was
previ-ously investigated by systematically studying the
prop-erties of the Ni isotopes from 68Ni (N = 40) to 78Ni
(N = 50). Figure 2 shows the resulting proton SPEs as
a function of neutron number from shell model calcula-tions for the Ni isotopes [9]. Note that the SPEs change more dramatically when including the tensor component of the monopole interaction (solid lines), while the relative
changes are less pronounced when the tensor component is not included (dashed lines). According to these calcula-tions, the changes in the proton SPEs lead to an inversion
of theπ2p3/2andπ1f5/2orbitals with increasing number of
neutrons in theν1g9/2orbital. The crossing of theπ2p3/2
andπ1f5/2 orbitals is consistent with the measured 5/2−
spin-parity for the ground state in75Cu [10]. Furthermore,
the calculations predict a reduction for theZ = 28 shell
gap as a result of the attraction between theπ1f5/2and the
ν1g9/2and the repulsion between theπ1f7/2andν1g9/2
or-bitals.
Proton SPEs as a function of neutron number can be determined by studying single-proton excitations in the Cu
(Z = 29) isotopes, where the last uncoupled proton
re-sides above theZ =28 gap in the f5/2pshell (1f5/2, 2p3/2,
2p1/2). Indeed, the neutron-rich copper isotopes from69Cu
(N=40) to79Cu (N=50) have played an important role to
study the single-particle structure in the78Ni region.
Pre-vious experimental and theoretical studies, however,
indi-cated that the low-lying states in Cu nuclei can have diff
er-ent origins [11, 12] and can be classified into the following types:
• the 3/2−and 5/2−"single-particle" states, dominated by
the single-proton configurations,π2p3/2andπ1f5/2,
re-spectively,
• the "particle-core coupled" states from 9/2−to 1/2−and
from 7/2− to 1/2−will appear as a result of the π2p3/2
andπ1f5/2single-particle excitations coupled to the first
excited 2+ state of the even-even Ni core, denoted as
2p3/2⊗2+1 and 1f5/2⊗2+1, respectively
• the 7/2−"intruder" state arises from the excitation of a
proton from the 1f7/2orbital across theZ=28 shell gap,
leaving a hole in the 1f7/2orbit,i.e. π1f−7/12.
2.1 Beta-decay of75,77Ni
Cu nuclei have been studied in detail up to73Cu via
dif-ferent reaction mechanisms such as β-decay, Coulomb
excitation, and single- and multi-nucleon transfer
reac-tion studies [13–21]. For the heavier isotopes 75Cu and
77Cu, only the spin and parity of the ground state was
known [10], and, in case of75Cu, two low-lying isomeric
states [22, 23]. To identify low-lying states and
estab-lish the level schemes for75Cu and77Cu,β-decay
experi-ments were carried out at RI Beam Factory (RIBF) of the RIKEN Nishina Center [24]. The secondary beam
parti-cles near78Ni were produced via fission reaction of the
238U primary beam on a thick 9Be target. After particle
identification in atomic number (Z) and mass-to-charge
ra-tio (A/Q) using the TOF −Bρ−∆E technique [25] in
the BigRIPS fragment separator [26, 27], the ions were delivered to the experimental setup through the ZeroDe-gree Spectrometer (ZDS) [27] and implanted in a stack of eight highly pixelised double-sided silicon strip detectors (WAS3ABI [28]). Each DSSSD had 60 horizontal and 40 vertical strips of 1 mm pitch, respectively. Surrounding the implantation detector was the EURICA germanium
detec-tor array [28, 29] for the detection ofγrays emitted after
βdecay of the implanted ions.
πf5/2/πp3/2⊗2+
πp3/2
πf5/2
πf7/2-1
πf5/2/πp3/2⊗4+ SM space: pfg9d5
Core: 40Ca
π ν
1f7/2 1f5/2 2p3/2 2p1/2 1g9/2
Z=28
N=50 2d5/2 1g7/2 3s1/2
1f7/2 1f5/2 2p3/2 2p1/2 1g9/2
N=28 2d5/2
E.S., F. Bello, Y. Tsunoda, T. Otsuka et al., Phys.Rev.Lett. 118,242502,(2017). Figure 3. Excited states of77Cu compared to the MCSM
cal-culations. The orbital configurations are indicated for the lowest states.
The level structure of75,77Cu was investigated through
γ-ray spectroscopy following theβdecay of75,77Ni. The
implanted Ni ions were correlated on an event-by-event
basis in time and position with β decays detected in
WAS3ABI. It was required that theβ-decay electrons were
detected in the same DSSSD within a correlation area that covered up to two pixels away from the implantation
po-sition. The time correlation betweenβ-decay events and
detectedγrays was used to identify γ-ray transitions as
originating from75,77Cu or their respective daughter
de-cays. Due to the high efficiency of EURICA it was
pos-sible to analyzeγ-γcoincidences and use the coincidence
relationships to build level schemes up to around 4 MeV excitation energy for both nuclei. A total of 28 new excited
states were identified in 75Cu [33] and 12 in 77Cu [32].
Tentative spin-parity values were assigned for all states in
77Cu based on theβ-decay feeding (log(f t) values) andγ
-decay properties, whereas this was only possible for the
lowest states in75Cu. Figure 3 shows the level scheme
for77Cu obtained from the present data together with
re-sults from state-of-the-art Monte Carlo Shell Model calcu-lations [30, 31]. The calcucalcu-lations used the A3DA
interac-tion [30] with rather large valence space,i.e. the full f p
shell (1f7/2, 1f5/2, 2p3/2, 2p1/2) plus the 1g9/2 and 2d5/2
orbitals outside a40Ca core.
There is rather good agreement between the experi-mental results and the results from the shell model calcu-lations, in particular for the states up to 2 MeV excitation energy. All low-lying states are explained as having either single-particle, core-coupled, or intruder character as ex-plained above. With new experimental results available, the shell model calculations have been refined compared to the previous results shown in Figure 2. The SPEs from the new shell model calculations are shown in Figure 4.
The results indicate that the inversion of theπ2p3/2 and
π1f5/2 orbitals does not occur at N = 46 (75Cu), as was
Figure 4. Calculated proton SPEs for the Ni chain. Figure is adapted from Ref. [32].
reported in 2010 in the work of Otsuka et al. [9], but
oc-curs instead atN=48 (77Cu). The fact that the 5/2−state
is lower than the 3/2− state already in75Cu is explained
by correlation effects due to multipole interaction, which
are stronger for the 5/2−state than for the 3/2−state [32].
Furthermore, with the crossing of these two orbits found to occur later than previously thought, the reduction of the
Z = 28 shell gap is also smaller than in previously
cal-culations. As one of the main results from the presentβ
-decay study it can be concluded that the size of theZ=28
shell gap is reduced from 6.5 MeV atN =40 to 5 MeV
atN =50 [32]. More detailed discussions, together with
extended results on75Cu and their comparison to the
large-scale shell-model calculations, will be presented in a forth-coming article [33].
3 Proton excitations across
Z
=
28
Theβ-decay experiment discussed above gave insight into
the single-particle properties in the78Ni region based on
comparisons with shell model calculations. It also gave
a first indication for a 7/2−intruder state based on a
pro-ton excitation across theZ =28 shell gap (see Figure 4).
Complementary experiments using direct reaction mech-anism such as one-proton knockout selectively populate excited states arising from single-proton excitations. Such experiments can give a more direct identification of
single-particle states based on 2p3/2 and 1f5/2 protons, and, in
particular, of the (π1f7/2)−1particle-hole excitation across
theZ = 28 shell gap. As the interpretation of the 7/2−
states found in theβ-decay experiment is less
straightfor-ward as compared to the other low-lying states, comple-mentary knock-out experiments can provide essential in-formation on the evolution of the shell structure close to
78Ni. The location of the 7/2−2p−1hintruder state along
the chain of the Cu isotopes is important to provide sen-sitive information on the expected shape coexistence and
onset of deformation in the78Ni region [31].
3.1 One-proton removal reaction
Experiments to study neutron-rich Cu isotopes in knock-out reactions were performed within the SEASTAR
col-EPJ Web of Conferences 223, 01054 (2019) https://doi.org/10.1051/epjconf/201922301054
laboration and campaign at RIKEN. The75,77Cu nuclei
were produced through one-proton knockout of 76,78Zn
beam particles. In terms of reaction mechanism, the one-proton knockout strength is expected to be largest for the 1f7/2orbital since there are almost 8 protons in the
ground-state configuration of the 76,78Zn isotopes, while the
re-maining single-particle strength due to 2 protons above Z=28 will be mostly shared between the 1f5/2, 2p3/2, and
1p1/2orbitals. As a consequence, the cross section to
pop-ulate the 7/2− particle-hole state is expected to be large,
and the corresponding state can be clearly identified. The experiment used again an intense primary beam of238U and a primary9Be target. The BigRIPS separator
was optimized to select neutron-rich Zn isotopes. Identi-fication of the incoming projectiles and outgoing reaction products was performed on event-by-event basis similar to the technique mentioned in Sect. 2.1. For the purpose of one-proton knockout, a reaction target of 10 cm thick liquid hydrogen, surrounded by the active target time pro-jection chamber MINOS [34], was exploited during the experiment. The DALI2 array [35], coupled to the MI-NOS device, was used for the detection of theγrays emit-ted from the reaction products. The setup allowed per-forming event-by-event Doppler correction of theγrays detected in DALI2 using the reaction vertex information reconstructed in MINOS. Details of the procedure can be found in Ref. [36].
Figure 5 shows the Doppler-corrected γ-ray spec-tra obtained for 75Cu and 77Cu resulting from the 76Zn(p,2p)75Cu and 78Zn(p,2p)77Cu knockout reactions
,respectively. Eight transitions of 490(10), 530(10), 880(10), 950(10), 990(10) 1410(20), 1480(20), and 1680(30) keV energies are visible in the spectrum for75Cu
(Figure 5a) while six transitions of 290 (10), 860(20), 950(20), 1150(20), 1740(30), and 2060(20) keV are seen in in the spectrum for77Cu (Figure 5b). The knowledge of
the level schemes of75Cu and77Cu from theβ-decay
ex-periments was of great help for the identification of tran-sitions in the spectra following the knock-out reactions. In fact, allγ-ray transitions indicated in Figure 5 were also seen following theβdecay of75Ni and77Ni,
respec-tively [32, 33].
The transition at 290 keV lies in the low-energy region where a large atomic background makes its identification difficult. The spectrum shown in the inset of Figure 5b
was obtained using only DALI2 detectors at forward an-gles. Due to a relatively long lifetime of the (3/2−) state
at 290 keV excitation energy, its decay transition appears shifted to 260 keV under these conditions. Using the line-shape of this transition depopulating the level at 290 keV, a lower limit of about 0.5 ns for the half life of the (3/2−)
state could be extracted in the present experiment. Fig-ure 6 shows examples of the coincidence spectra gated on the 530- and 490-keV transitions in75Cu. The coincidence
relation between 530 keV and 880 keV and 950 keV and between 490 keV and 990 keVγ-ray transitions confirms the level scheme obtained in Ref. [33]. The similar anal-ysis has been performed for77Cu and confirms the level
scheme reported in Ref. [32]
1
Introduction
The results of our SEASTAR data analysis will be presented for75Cu and77Cu in the following sections. The reaction channels analyzed here are76Zn (p,2p)75Cu and78Zn (p,2p)77Cu.
Without the level schemes from the EURICA beta-decay experiment, identification of the transitions and the final states populated in the reaction would be almost impossible. This is especially the case for77Cu where we have no coincidence data but some hints of the populated states. Level schemes obtained in the beta-decay work are given in Appendix A.
2
Results
2.1 Gamma single spectra
Gamma-single spectra for75Cu are obtained for the (p,2p) channel by gating on76Zn before and on75Cu after the target. The spectra are doppler corrected and with addback. TimeO↵setted gates are set to reduce the bg for better looking spectra (these gates are removed when the exclusive cross sections are calculated). Figure 1 and Figure 2 show the doppler-corrected spectra for75Cu and77Cu, respectively, for mult=All and mult=1 .
400 800 1200 1600 2000 2400 2800 50
100 150
Counts (16 keV/bin)
400 800 1200 1600 2000 2400 2800 Energy (keV) 250 500 750 1000 Mult=1 Mult=All 1410+1480 880 940 990 490 530 1680
Figure 1: Doppler corrected gamma single spectrum for75Cu.
Gamma-single spectra for77Cu are obtained for the (p,2p) channel by gating on78Zn before and on77Cu after the target. The spectra are doppler corrected and with addback. TimeO↵setted gates are set to reduce the bg for better looking spectra. Figure 2 shows the doppler-corrected spectrum for mult=1.
2
(16 keV/bin)
400 800 1200 1600 2000 2400 2800 20
40
Counts (20 keV/bin)
400 800 1200 1600 2000 2400 2800 Energy (keV) 100 200 Mult=1 Mult=1234 1150 940 2068
Figure 2: Doppler corrected gamma single spectrum for77Cu.
2.2 Gamma coincidence examples
Coincidence data are sufficient for75Cu. We are using gates with exponential bg subtrac-tion. Figures 3a and b show the gated spectra satisfying the level scheme constructed in
the beta-decay work using EURICA. The matrix and the projection on one axis
accordingly were produced for mult= 2+3.
In the case of the spectrum gated on 950 keV in Figure 3a, we believe that under the peak at 530 keV there is a contribution from 490 keV which is in coincidence with 990 keV, close to the value of 950 keV. Figure 3b shows the relation between the transitions 490 and 990 keV. Like the case above, here there is a contribution from 530 keV under the peak area of 490 keV due to the fact that 950- and 990-keV peaks are lying closer than the resolution limit of DALI. The same applies to the gated spectrum on 490 keV in which 880+950 keV is slightly visible as 490 keV is lying close to 530 keV.
3
400 800 1200 1600 2000 2400 2800 20
40
Counts (20 keV/bin)
400 800 1200 1600 2000 2400 2800 Energy (keV) 100 200 Mult=1 Mult=1234 1150 940 2068
Figure 2: Doppler corrected gamma single spectrum for77Cu.
2.2 Gamma coincidence examples
Coincidence data are sufficient for75Cu. We are using gates with exponential bg subtrac-tion. Figures 3a and b show the gated spectra satisfying the level scheme constructed in
the beta-decay work using EURICA. The matrix and the projection on one axis
accordingly were produced for mult= 2+3.
In the case of the spectrum gated on 950 keV in Figure 3a, we believe that under the peak at 530 keV there is a contribution from 490 keV which is in coincidence with 990 keV, close to the value of 950 keV. Figure 3b shows the relation between the transitions 490 and 990 keV. Like the case above, here there is a contribution from 530 keV under the peak area of 490 keV due to the fact that 950- and 990-keV peaks are lying closer than the resolution limit of DALI. The same applies to the gated spectrum on 490 keV in which 880+950 keV is slightly visible as 490 keV is lying close to 530 keV.
3 75Cu
400 800 1200 1600 2000 2400 2800
20 40
Counts (20 keV/bin)
400 800 1200 1600 2000 2400 2800
Energy (keV) 100 200 Mult=1 Mult=1234 1150 940 2068
Figure 2: Doppler corrected gamma single spectrum for77Cu.
2.2 Gamma coincidence examples
Coincidence data are sufficient for75Cu. We are using gates with exponential bg subtrac-tion. Figures 3a and b show the gated spectra satisfying the level scheme constructed in
the beta-decay work using EURICA. The matrix and the projection on one axis
accordingly were produced for mult= 2+3.
In the case of the spectrum gated on 950 keV in Figure 3a, we believe that under the peak at 530 keV there is a contribution from 490 keV which is in coincidence with 990 keV, close to the value of 950 keV. Figure 3b shows the relation between the transitions 490 and 990 keV. Like the case above, here there is a contribution from 530 keV under the peak area of 490 keV due to the fact that 950- and 990-keV peaks are lying closer than the resolution limit of DALI. The same applies to the gated spectrum on 490 keV in which 880+950 keV is slightly visible as 490 keV is lying close to 530 keV.
3
400 800 1200 1600 2000 2400 2800
20 40
Counts (20 keV/bin)
400 800 1200 1600 2000 2400 2800
Energy (keV) 100 200 Mult=1 Mult=1234 1150 940 2068
Figure 2: Doppler corrected gamma single spectrum for77Cu.
2.2 Gamma coincidence examples
Coincidence data are sufficient for75Cu. We are using gates with exponential bg subtrac-tion. Figures 3a and b show the gated spectra satisfying the level scheme constructed in
the beta-decay work using EURICA. The matrix and the projection on one axis
accordingly were produced for mult= 2+3.
In the case of the spectrum gated on 950 keV in Figure 3a, we believe that under the peak at 530 keV there is a contribution from 490 keV which is in coincidence with 990 keV, close to the value of 950 keV. Figure 3b shows the relation between the transitions 490 and 990 keV. Like the case above, here there is a contribution from 530 keV under the peak area of 490 keV due to the fact that 950- and 990-keV peaks are lying closer than the resolution limit of DALI. The same applies to the gated spectrum on 490 keV in which 880+950 keV is slightly visible as 490 keV is lying close to 530 keV.
3
(20 keV/bin)
77Cu
Counts per 16 keV
Counts per 20 keV
3
correction of theγrays detected in DALI2, as
demon-167
strated in Ref. [35, 40]. Due to the extended size of the
168
target, the full-energy-peak efficiency of the array was
169
determined with a detailed GEANT4 simulation [41]. It
170
took into consideration the measured intrinsic resolution
171
of each crystal and the lifetimes of the decaying states.
172
500 1000 1500 2000 2500 3000
0 200 400 600 800 1000 1200 1400
490 + 530
890 + 950 + 990 1417 + 1483
1680
400 600 800 1000 1200 1400 1600 0
20
40 gate on 490 keV
400 600 800 1000 1200 1400 1600 0
20
40 gate on 530 keV
Cu
75 (a)
500 1000 1500 2000 2500 3000
0 200 400 600 800 1000 1200 1400 290
860 + 940
1150 1740 2068
1200 1400 1600 1800 2000 2200 0
10 20
30 gate on 940 keV
600 800 1000 1200 1400 1600 0
5
10 gate on 1740 keV
Cu 77
(b)
Energy [keV]
Counts (20 keV/bin)
0 500 1000 1500 2000 2500 0
100
200 75Cu
(c)
0 500 1000 1500 2000 2500 0 100 200 300 Cu 77
FIG. 1. (Color online) Doppler corrected -ray energy spec-trum measured with DALI2 array corresponding to75Cu (a) and77Cu (b): the experimental data (black), the double-exponential background (blue dashed line), the simulated re-sponse function of each transition (purple), the sum of the simulated response functions with the background (red).The insets show the background subtracted - coincidences (c): Doppler corrected -ray energy spectra for75Cu in and77Cu obtained using forward detectors of DALI2 and with multi-plicity 1.
173 174
Figure 1 shows the Doppler-correctedγ-ray spectra
175
for75Cu and77Cu resulting from the76Zn(p,2p)75Cu
176
and78Zn(p,2p)77Cu knockout reactions (top and bottom
177
panel, respectively). The experimental background
origi-178
nated mainly from the atomic processes (bremsstrahlung
179
in the target) in the low energy region (E <500 keV)
180
and from the Compton scattering. Eight transitions of
181
490(10), 530(10), 880(10), 950(10), 990(10) 1410(20),
182
1480(20), and 1680(30) keV energies were identified in
183
the spectrum of 75Cu (Fig.1a), corresponding to the
184
transitions de-populating the low-lying states reported
185
in Ref. [31]. Five transitions are noticeable in Fig.1b in
186
the spectrum of77Cu, in which the one at 1740(30) keV
187
was observed but not placed in the level scheme given
188
in Fig.3 of Ref. [32]. Transitions at 860(20), 950(20),
189
1150(20), and 2060(20) keV were previously reported in
190
Ref. [32]. In order to understand population in the
low-191
energy region below 500 keV, the spectra in Fig.1a and b
192
were obtained using DALI2 detectors at forward angles
193
with multiplicity equal to one. Figure 1c shows these
194
spectra for both nuclei in which a 293-keVγtransition
195
de-exciting the (3/2 ) state in77Cu is visible and shifted
196
towards 260 keV. A lower limit of about 0.5 ns for the
197
half life could be extracted for the state at 293 keV
us-198
ing the lineshape of theγ-ray transition depopulating
199
this level. The obtained value is in a good agreement
200
with the value of 1.5 ns from the MCSM calculations
201
which predict the 3/2 state in77Cu to be dominated by
202
the⇡2p3/2single-proton configuration [32]. Instead, the
203
66.2-keV transition decaying from the 3/2 state in75Cu
204
could not be observed in the present measurement due
205
to its low-energy and long half-life, 149(6) ns [29].
206
The experimental spectra in Fig.1a and b were fitted
207
using the least-square method (red solid lines) to
ob-208
tain theγ-ray intensities. The previously measuredγ
-209
ray branching ratios from Ref. [31, 32] were used in the
210
fitting procedure. The response function of DALI2 for
211
each peak (purple solid lines) and a combination of two
212
exponential functions for the background (blue dashed
213
lines) were implemented in the fit as done previously in
214
similar analyses [35, 40]. Simulated energy (E ) and the
215
intensity values (I ) for both Cu nuclei are summarized
216
in Table I. The main sources of the uncertainties in the
217
transition energies come from the energy calibration (5
218
keV for all energies) and from the statistical
uncertain-219
ties of the fit. Due to the presence of the long-lived 8+
220
state in78Zn [42], a fraction of ions could reach the
sec-221
ondary target in the isomeric state instead of the ground
222
state. The isomeric ratio was measured during the
exper-223
iment with the EURICA array to be 7.7(8) %. Although
224
the detailed level schemes are known from the beta-decay
225
experiments [31, 32], theγ-γcoincidence data helped to
226
determine the partial level schemes for both Cu isotopes
227
in the present work. The insets in Fig.1 show examples
228
of the coincidence spectra gated on the 530- and
490-229
keV transitions in75Cu and on the 940- and 1740-keV
230
transitions in77Cu. Figure 2 shows the level schemes of
231
75
Cu and77Cu determined in the presentγ-γcoincidence
232
analysis. The known states observed in the recent
mea-233
surement agree with those reported in Ref. [31, 32] for
234
both Cu isotopes.
235 236
The inclusive cross sections (ICS) for76Zn(p,2p)75Cu
237
and78Zn(p,2p)77Cu reactions in the present work were
238
found to be equal to 15.0(7) mb and 11.5(8) mb,
respec-239
tively, compared to 7.9(2) mb for the80Zn(p,2p)79Cu
re-240
action reported in Ref. [35]. A rather high ICS obtained
241 860 940
950 1740 260 2060 (a) (b)
Figure 5. Doppler correctedγ-ray spectra (a) for75Cu and (b)
for77Cu. Inset: The same spectrum as (b) obtained only using DALI2 detectors at forward angles.
400 800 1200 1600 2000 2400
0 20 40
400 800 1200 1600 2000 2400
Energy (keV) 0
20 40
Counts/16 keV
Gate on 530 keV
Gate on 490 keV
880 950
990
Figure 6.Background subtractedγ-γcoincidences for75Cu. The
spectra gated on 530-keV and on 490-keV transitions are shown in upper and bottom panel, respectively.
From Figure 5 it is evident that the transitions at around 1.5 MeV in75Cu and 2 MeV in 77Cu are more
strongly populated compared to the other transitions seen in the spectra. Accordingly, the state at 1483 keV in75Cu
and at 2068 keV in77Cu will have the largest population
through the (p,2p) reaction and, hence, can be assigned as the states based on the (π1f7/2)−1particle-hole excitation.
The detailed analysis including extraction of the exclusive cross sections and spectroscopic factors will be reported in another forthcoming article [37].
The preliminarily results from the one-proton knock-out and beta-decay experiments at RIKEN can be trans-lated into systematics of the excited states along the Cu chain. Figure 7 shows the energy of the low-lying states of the Cu isotopes as a function of the neutron number. From the systematics we can make the following observations:
• An increase in the energy of the 3/2− single-particle
state (green full dots) and a decrease in the 5/2−
single-particle state (red full squares) state is clearly visible as a result of the monopole tensor interaction, which is
re-EPJ Web of Conferences 223, 01054 (2019) https://doi.org/10.1051/epjconf/201922301054
laboration and campaign at RIKEN. The 75,77Cu nuclei
were produced through one-proton knockout of 76,78Zn
beam particles. In terms of reaction mechanism, the one-proton knockout strength is expected to be largest for the 1f7/2orbital since there are almost 8 protons in the
ground-state configuration of the 76,78Zn isotopes, while the
re-maining single-particle strength due to 2 protons above Z=28 will be mostly shared between the 1f5/2, 2p3/2, and
1p1/2orbitals. As a consequence, the cross section to
pop-ulate the 7/2−particle-hole state is expected to be large,
and the corresponding state can be clearly identified. The experiment used again an intense primary beam of238U and a primary9Be target. The BigRIPS separator
was optimized to select neutron-rich Zn isotopes. Identi-fication of the incoming projectiles and outgoing reaction products was performed on event-by-event basis similar to the technique mentioned in Sect. 2.1. For the purpose of one-proton knockout, a reaction target of 10 cm thick liquid hydrogen, surrounded by the active target time pro-jection chamber MINOS [34], was exploited during the experiment. The DALI2 array [35], coupled to the MI-NOS device, was used for the detection of theγrays emit-ted from the reaction products. The setup allowed per-forming event-by-event Doppler correction of theγrays detected in DALI2 using the reaction vertex information reconstructed in MINOS. Details of the procedure can be found in Ref. [36].
Figure 5 shows the Doppler-corrected γ-ray spec-tra obtained for 75Cu and 77Cu resulting from the 76Zn(p,2p)75Cu and 78Zn(p,2p)77Cu knockout reactions
,respectively. Eight transitions of 490(10), 530(10), 880(10), 950(10), 990(10) 1410(20), 1480(20), and 1680(30) keV energies are visible in the spectrum for75Cu
(Figure 5a) while six transitions of 290 (10), 860(20), 950(20), 1150(20), 1740(30), and 2060(20) keV are seen in in the spectrum for77Cu (Figure 5b). The knowledge of
the level schemes of75Cu and77Cu from theβ-decay
ex-periments was of great help for the identification of tran-sitions in the spectra following the knock-out reactions. In fact, allγ-ray transitions indicated in Figure 5 were also seen following theβdecay of75Ni and77Ni,
respec-tively [32, 33].
The transition at 290 keV lies in the low-energy region where a large atomic background makes its identification difficult. The spectrum shown in the inset of Figure 5b
was obtained using only DALI2 detectors at forward an-gles. Due to a relatively long lifetime of the (3/2−) state
at 290 keV excitation energy, its decay transition appears shifted to 260 keV under these conditions. Using the line-shape of this transition depopulating the level at 290 keV, a lower limit of about 0.5 ns for the half life of the (3/2−)
state could be extracted in the present experiment. Fig-ure 6 shows examples of the coincidence spectra gated on the 530- and 490-keV transitions in75Cu. The coincidence
relation between 530 keV and 880 keV and 950 keV and between 490 keV and 990 keVγ-ray transitions confirms the level scheme obtained in Ref. [33]. The similar anal-ysis has been performed for77Cu and confirms the level
scheme reported in Ref. [32]
1
Introduction
The results of our SEASTAR data analysis will be presented for75Cu and77Cu in the following sections. The reaction channels analyzed here are76Zn (p,2p)75Cu and78Zn (p,2p)77Cu.
Without the level schemes from the EURICA beta-decay experiment, identification of the transitions and the final states populated in the reaction would be almost impossible. This is especially the case for77Cu where we have no coincidence data but some hints of the populated states. Level schemes obtained in the beta-decay work are given in Appendix A.
2
Results
2.1 Gamma single spectra
Gamma-single spectra for75Cu are obtained for the (p,2p) channel by gating on76Zn before and on75Cu after the target. The spectra are doppler corrected and with addback. TimeO↵setted gates are set to reduce the bg for better looking spectra (these gates are removed when the exclusive cross sections are calculated). Figure 1 and Figure 2 show the doppler-corrected spectra for75Cu and77Cu, respectively, for mult=All and mult=1 .
400 800 1200 1600 2000 2400 2800 50
100 150
Counts (16 keV/bin)
400 800 1200 1600 2000 2400 2800 Energy (keV) 250 500 750 1000 Mult=1 Mult=All 1410+1480 880 940 990 490 530 1680
Figure 1: Doppler corrected gamma single spectrum for75Cu.
Gamma-single spectra for77Cu are obtained for the (p,2p) channel by gating on78Zn before and on77Cu after the target. The spectra are doppler corrected and with addback. TimeO↵setted gates are set to reduce the bg for better looking spectra. Figure 2 shows the doppler-corrected spectrum for mult=1.
2
(16 keV/bin)
400 800 1200 1600 2000 2400 2800 20
40
Counts (20 keV/bin)
400 800 1200 1600 2000 2400 2800 Energy (keV) 100 200 Mult=1 Mult=1234 1150 940 2068
Figure 2: Doppler corrected gamma single spectrum for77Cu.
2.2 Gamma coincidence examples
Coincidence data are sufficient for75Cu. We are using gates with exponential bg subtrac-tion. Figures 3a and b show the gated spectra satisfying the level scheme constructed in
the beta-decay work using EURICA. The matrix and the projection on one axis
accordingly were produced for mult= 2+3.
In the case of the spectrum gated on 950 keV in Figure 3a, we believe that under the peak at 530 keV there is a contribution from 490 keV which is in coincidence with 990 keV, close to the value of 950 keV. Figure 3b shows the relation between the transitions 490 and 990 keV. Like the case above, here there is a contribution from 530 keV under the peak area of 490 keV due to the fact that 950- and 990-keV peaks are lying closer than the resolution limit of DALI. The same applies to the gated spectrum on 490 keV in which 880+950 keV is slightly visible as 490 keV is lying close to 530 keV.
3
400 800 1200 1600 2000 2400 2800 20
40
Counts (20 keV/bin)
400 800 1200 1600 2000 2400 2800 Energy (keV) 100 200 Mult=1 Mult=1234 1150 940 2068
Figure 2: Doppler corrected gamma single spectrum for77Cu.
2.2 Gamma coincidence examples
Coincidence data are sufficient for75Cu. We are using gates with exponential bg subtrac-tion. Figures 3a and b show the gated spectra satisfying the level scheme constructed in
the beta-decay work using EURICA. The matrix and the projection on one axis
accordingly were produced for mult= 2+3.
In the case of the spectrum gated on 950 keV in Figure 3a, we believe that under the peak at 530 keV there is a contribution from 490 keV which is in coincidence with 990 keV, close to the value of 950 keV. Figure 3b shows the relation between the transitions 490 and 990 keV. Like the case above, here there is a contribution from 530 keV under the peak area of 490 keV due to the fact that 950- and 990-keV peaks are lying closer than the resolution limit of DALI. The same applies to the gated spectrum on 490 keV in which 880+950 keV is slightly visible as 490 keV is lying close to 530 keV.
3 75Cu
400 800 1200 1600 2000 2400 2800
20 40
Counts (20 keV/bin)
400 800 1200 1600 2000 2400 2800
Energy (keV) 100 200 Mult=1 Mult=1234 1150 940 2068
Figure 2: Doppler corrected gamma single spectrum for77Cu.
2.2 Gamma coincidence examples
Coincidence data are sufficient for75Cu. We are using gates with exponential bg subtrac-tion. Figures 3a and b show the gated spectra satisfying the level scheme constructed in
the beta-decay work using EURICA. The matrix and the projection on one axis
accordingly were produced for mult= 2+3.
In the case of the spectrum gated on 950 keV in Figure 3a, we believe that under the peak at 530 keV there is a contribution from 490 keV which is in coincidence with 990 keV, close to the value of 950 keV. Figure 3b shows the relation between the transitions 490 and 990 keV. Like the case above, here there is a contribution from 530 keV under the peak area of 490 keV due to the fact that 950- and 990-keV peaks are lying closer than the resolution limit of DALI. The same applies to the gated spectrum on 490 keV in which 880+950 keV is slightly visible as 490 keV is lying close to 530 keV.
3
400 800 1200 1600 2000 2400 2800
20 40
Counts (20 keV/bin)
400 800 1200 1600 2000 2400 2800
Energy (keV) 100 200 Mult=1 Mult=1234 1150 940 2068
Figure 2: Doppler corrected gamma single spectrum for77Cu.
2.2 Gamma coincidence examples
Coincidence data are sufficient for75Cu. We are using gates with exponential bg subtrac-tion. Figures 3a and b show the gated spectra satisfying the level scheme constructed in
the beta-decay work using EURICA. The matrix and the projection on one axis
accordingly were produced for mult= 2+3.
In the case of the spectrum gated on 950 keV in Figure 3a, we believe that under the peak at 530 keV there is a contribution from 490 keV which is in coincidence with 990 keV, close to the value of 950 keV. Figure 3b shows the relation between the transitions 490 and 990 keV. Like the case above, here there is a contribution from 530 keV under the peak area of 490 keV due to the fact that 950- and 990-keV peaks are lying closer than the resolution limit of DALI. The same applies to the gated spectrum on 490 keV in which 880+950 keV is slightly visible as 490 keV is lying close to 530 keV.
3
400 800 1200 1600 2000 2400 2800
20 40
Counts (20 keV/bin)
400 800 1200 1600 2000 2400 2800
Energy (keV) 100 200 Mult=1 Mult=1234 1150 940 2068
Figure 2: Doppler corrected gamma single spectrum for77Cu.
2.2 Gamma coincidence examples
Coincidence data are sufficient for75Cu. We are using gates with exponential bg subtrac-tion. Figures 3a and b show the gated spectra satisfying the level scheme constructed in
the beta-decay work using EURICA. The matrix and the projection on one axis
accordingly were produced for mult= 2+3.
In the case of the spectrum gated on 950 keV in Figure 3a, we believe that under the peak at 530 keV there is a contribution from 490 keV which is in coincidence with 990 keV, close to the value of 950 keV. Figure 3b shows the relation between the transitions 490 and 990 keV. Like the case above, here there is a contribution from 530 keV under the peak area of 490 keV due to the fact that 950- and 990-keV peaks are lying closer than the resolution limit of DALI. The same applies to the gated spectrum on 490 keV in which 880+950 keV is slightly visible as 490 keV is lying close to 530 keV.
3
(20 keV/bin)
77Cu
Counts per 16 keV
Counts per 20 keV
3
correction of theγrays detected in DALI2, as
demon-167
strated in Ref. [35, 40]. Due to the extended size of the
168
target, the full-energy-peak efficiency of the array was
169
determined with a detailed GEANT4 simulation [41]. It
170
took into consideration the measured intrinsic resolution
171
of each crystal and the lifetimes of the decaying states.
172
500 1000 1500 2000 2500 3000
0 200 400 600 800 1000 1200 1400
490 + 530
890 + 950 + 990 1417 + 1483
1680
400 600 800 1000 1200 1400 1600 0
20
40 gate on 490 keV
400 600 800 1000 1200 1400 1600 0
20
40 gate on 530 keV
Cu
75 (a)
500 1000 1500 2000 2500 3000
0 200 400 600 800 1000 1200 1400 290
860 + 940
1150 1740 2068
1200 1400 1600 1800 2000 2200 0
10 20
30 gate on 940 keV
600 800 1000 1200 1400 1600 0
5
10 gate on 1740 keV
Cu 77
(b)
Energy [keV]
Counts (20 keV/bin)
0 500 1000 1500 2000 2500 0
100
200 75Cu
(c)
0 500 1000 1500 2000 2500 0 100 200 300 Cu 77
FIG. 1. (Color online) Doppler corrected -ray energy spec-trum measured with DALI2 array corresponding to75Cu (a) and77Cu (b): the experimental data (black), the double-exponential background (blue dashed line), the simulated re-sponse function of each transition (purple), the sum of the simulated response functions with the background (red).The insets show the background subtracted - coincidences (c): Doppler corrected -ray energy spectra for75Cu in and77Cu obtained using forward detectors of DALI2 and with multi-plicity 1.
173 174
Figure 1 shows the Doppler-correctedγ-ray spectra
175
for75Cu and77Cu resulting from the76Zn(p,2p)75Cu
176
and78Zn(p,2p)77Cu knockout reactions (top and bottom
177
panel, respectively). The experimental background
origi-178
nated mainly from the atomic processes (bremsstrahlung
179
in the target) in the low energy region (E <500 keV)
180
and from the Compton scattering. Eight transitions of
181
490(10), 530(10), 880(10), 950(10), 990(10) 1410(20),
182
1480(20), and 1680(30) keV energies were identified in
183
the spectrum of 75Cu (Fig.1a), corresponding to the
184
transitions de-populating the low-lying states reported
185
in Ref. [31]. Five transitions are noticeable in Fig.1b in
186
the spectrum of77Cu, in which the one at 1740(30) keV
187
was observed but not placed in the level scheme given
188
in Fig.3 of Ref. [32]. Transitions at 860(20), 950(20),
189
1150(20), and 2060(20) keV were previously reported in
190
Ref. [32]. In order to understand population in the
low-191
energy region below 500 keV, the spectra in Fig.1a and b
192
were obtained using DALI2 detectors at forward angles
193
with multiplicity equal to one. Figure 1c shows these
194
spectra for both nuclei in which a 293-keVγtransition
195
de-exciting the (3/2 ) state in77Cu is visible and shifted
196
towards 260 keV. A lower limit of about 0.5 ns for the
197
half life could be extracted for the state at 293 keV
us-198
ing the lineshape of theγ-ray transition depopulating
199
this level. The obtained value is in a good agreement
200
with the value of 1.5 ns from the MCSM calculations
201
which predict the 3/2 state in77Cu to be dominated by
202
the⇡2p3/2single-proton configuration [32]. Instead, the
203
66.2-keV transition decaying from the 3/2 state in75Cu
204
could not be observed in the present measurement due
205
to its low-energy and long half-life, 149(6) ns [29].
206
The experimental spectra in Fig.1a and b were fitted
207
using the least-square method (red solid lines) to
ob-208
tain theγ-ray intensities. The previously measuredγ
-209
ray branching ratios from Ref. [31, 32] were used in the
210
fitting procedure. The response function of DALI2 for
211
each peak (purple solid lines) and a combination of two
212
exponential functions for the background (blue dashed
213
lines) were implemented in the fit as done previously in
214
similar analyses [35, 40]. Simulated energy (E ) and the
215
intensity values (I ) for both Cu nuclei are summarized
216
in Table I. The main sources of the uncertainties in the
217
transition energies come from the energy calibration (5
218
keV for all energies) and from the statistical
uncertain-219
ties of the fit. Due to the presence of the long-lived 8+
220
state in78Zn [42], a fraction of ions could reach the
sec-221
ondary target in the isomeric state instead of the ground
222
state. The isomeric ratio was measured during the
exper-223
iment with the EURICA array to be 7.7(8) %. Although
224
the detailed level schemes are known from the beta-decay
225
experiments [31, 32], theγ-γcoincidence data helped to
226
determine the partial level schemes for both Cu isotopes
227
in the present work. The insets in Fig.1 show examples
228
of the coincidence spectra gated on the 530- and
490-229
keV transitions in75Cu and on the 940- and 1740-keV
230
transitions in77Cu. Figure 2 shows the level schemes of
231
75
Cu and77Cu determined in the presentγ-γcoincidence
232
analysis. The known states observed in the recent
mea-233
surement agree with those reported in Ref. [31, 32] for
234
both Cu isotopes.
235 236
The inclusive cross sections (ICS) for76Zn(p,2p)75Cu
237
and78Zn(p,2p)77Cu reactions in the present work were
238
found to be equal to 15.0(7) mb and 11.5(8) mb,
respec-239
tively, compared to 7.9(2) mb for the80Zn(p,2p)79Cu
re-240
action reported in Ref. [35]. A rather high ICS obtained
241 860 940
950 1740 260 2060 (a) (b)
Figure 5. Doppler correctedγ-ray spectra (a) for75Cu and (b)
for77Cu. Inset: The same spectrum as (b) obtained only using DALI2 detectors at forward angles.
400 800 1200 1600 2000 2400
0 20 40
400 800 1200 1600 2000 2400
Energy (keV) 0
20 40
Counts/16 keV
Gate on 530 keV
Gate on 490 keV
880 950
990
Figure 6.Background subtractedγ-γcoincidences for75Cu. The
spectra gated on 530-keV and on 490-keV transitions are shown in upper and bottom panel, respectively.
From Figure 5 it is evident that the transitions at around 1.5 MeV in 75Cu and 2 MeV in 77Cu are more
strongly populated compared to the other transitions seen in the spectra. Accordingly, the state at 1483 keV in75Cu
and at 2068 keV in77Cu will have the largest population
through the (p,2p) reaction and, hence, can be assigned as the states based on the (π1f7/2)−1particle-hole excitation.
The detailed analysis including extraction of the exclusive cross sections and spectroscopic factors will be reported in another forthcoming article [37].
The preliminarily results from the one-proton knock-out and beta-decay experiments at RIKEN can be trans-lated into systematics of the excited states along the Cu chain. Figure 7 shows the energy of the low-lying states of the Cu isotopes as a function of the neutron number. From the systematics we can make the following observations:
• An increase in the energy of the 3/2− single-particle
state (green full dots) and a decrease in the 5/2−
single-particle state (red full squares) state is clearly visible as a result of the monopole tensor interaction, which is
re-pulsive between theπ2p3/2 andν1g9/2and strongly
at-tractive between theπ1f5/2andν1g9/2 orbitals,
respec-tively.
• The particle-core coupled states (orange full diamonds) dominate the higher-energy regions. For the lighter iso-topes fromN = 36 to 44 one observes 7/2−and 11/2−
states based largely on the 2p3/2⊗2+1 coupling, while for the heavier isotopes from N = 46 to 48 one observes
9/2−and 13/2−states based largely on the 1f5/2⊗2+1 cou-pling. All these core-coupled states follow very closely the trend of the 2+
1 and 4+1 states in the corresponding (A−1)Ni core.
• The 7/2− "intruder" state (blue full triangle) exhibits
a parabolic behavior indicating a possible existence of shape coexistence along the copper chain fromN =40
toN =50. Similar parabolic behaviors have been
ob-served in different mass regions such as the Hg (Z=80),
Pb (Z=82), and Sn (Z=50) isotopic chains [38, 39].
36 38 40 42 44 46 48 50
N 0
1 2 3
Excitation enerrgy [MeV]
πf5/2 πp3/2 (πf7/2)-1
πp3/2/πf5/2⊗21 +
πp3/2/πf5/2⊗41 +
Figure 7. Systematics of the low-lying states in the Cu nuclei.
Experimental values are from References [7, 12, 14, 32, 33]
4 Conclusion
In conclusion, the status of the current spectroscopic stud-ies for75Cu and77Cu performed at RIKEN has been
dis-cussed. Level schemes up to around 4 MeV were con-structed for both nuclei from theβ-decay studies of75Ni
and 77Ni within the EURICA campaign. The
single-particle character of the low-lying states was identified more selectively via one-proton knockout reactions of
76Zn and 78Zn projectiles on a proton target within the
SEASTAR campaign. The results were compared to large-scale shell model calculations, yielding information about the single-particle structure in the78Ni region in general
and the size of theZ =28 shell gap in particular. The
re-sults allow a significant extension of the systematics along the chain of Cu isotopes. The identification of intruder states suggest that deformation and shape coexistence are important for the78Ni region. Further results and more
detailed discussions will be presented in forthcoming pub-lications.
References
[1] B. Bastinet al., Phys. Rev. Lett.99(2007) 022503. [2] T. Glasmacheret al., Phys. Lett. B395(1997) 163. [3] H.Scheitet al., Phys.Rev.Lett.77, 3967 (1996) [4] H.N. Liuet al., Phys.Rev.Lett.122, 072502 (2019). [5] C. Forceet al., Phys.Rev.Lett.105, 102501 (2010). [6] R. Taniuchiet al., Nature (London)569, 53 (2019). [7] NNDC-National Nuclear Data Center,
https://www.nndc.bnl.gov.
[8] T. Otsuka, T. Suzuki, R. Fujimoto, H. Grawe, and Y. Akaishi, Phys. Rev. Lett.95, 232502 (2005).
[9] T. Otsukaet al., Phys. Rev. Lett.104, 012501 (2010). [10] K.T. Flanagan et al., Phys. Rev. Lett. 103, 142501
(2009).
[11] A.M. Oros-Peusquens and P.F. Mantica., Nucl. Phys. A669(2000).
[12] T. Ishii, M. Asai,M. Makishima, I. Hossain, M. Ogawa, J. Hasegawa, M. Matsuda, and S. Ichikawa, Phys. Rev. Lett.84, 39 (2000).
[13] S. Franchooet al., Phys. Rev. Lett.81, 3100 (1998). [14] S. Franchooet al., Phys. Rev. C64054308 (2001). [15] I. Stefanescu et al., Phys. Rev. Lett. 100, 112502
(2008).
[16] I. Stefanescu et al., Phys. Rev. Lett. 100, 112502 (2008).
[17] B. Zeidman and J. A. Nolen, Phys. Rev. C18, 2122 (1978).
[18] P. Morfouaceet al., Phys.Lett. B751, 306 (2015). [19] P. Morfouaceet al., Phys.Rev. C93, 064308 (2016). [20] M. Doncelet al., Acta Phys. Pol.B44, 505 (2013). [21] E. Sahinet al., Phys. Rev. C91034302 (2015). [22] J.M. Daugas et al., Phys. Rev. C81, 034304 (2010). [23] C. Petrone at al., Phys. Rev. C94, 024319 (2016). [24] T. Onishiet al., J. Phys. Soc. Jpn.79, 073201 (2010). [25] N. Fukuda, T. Kubo, T. Ohnishi, N. Inabe, H. Takeda, D. Kameda, and H. Suzuki, Nucl. Instrum. Methods Phys. Res., Sect. B317323 (2013).
[26] T. Kubo, Nucl. Instrum. Methods Phys. Res., Sect. B
20497 (2003).
[27] T. Kuboet al., Prog. Theor. Exp. Phys.20123C003 (2012).
[28] S. Nishimura, Prog. Theor. Exp. Phys.201203C006 (2012).
[29] P.-A. Söderström, S. Nishimura, P. Doornenbal, G. Lorusso, T. Sumikama, H. Watanabe, Z. Xu, H. Baba, F. Browne, S. Go et al., Nucl. Instrum. Meth-ods Phys. Res., Sect. B317649 (2013).
[30] N. Shimizu, T. Abe, Y. Tsunoda, Y. Utsuno, T. Yoshida, T. Mizusaki, M. Honma, and T. Otsuka, Prog. Theor. Exp. Phys.201201A205 (2012).
[31] Y. Tsunoda, T. Otsuka, N. Shimizu, M. Honma, and Y. Utsuno, Phys. Rev. C89, 031301(R) (2014). [32] E. Sahinet al., Phys. Rev. Lett.118, 242502 (2017). [33] F. Bello Garroteet al., submitted to Phys. Rev. C. [34] A. Obertelliet al., Eur. Phys. J. A50, 8 (2014).
EPJ Web of Conferences 223, 01054 (2019) https://doi.org/10.1051/epjconf/201922301054
[35] S. Takeuchi, T. Motobayashi, Y. Togano, M. Mat-sushita, N. Aoi, K. Demichi, H. Hasegawa, and H. Mu-rakami, Nucl. Instrum. Methods Phys. Res., Sect. A
763, 596 (2014).
[36] C. Santamariaet al., Phys. Rev. Lett.115, 192501 (2015).
[37] E. Sahinet al., submitted to Phys. Rev. Lett. [38] J. Elsevierset al., Phys. Rev. C84034307 (2011). [39] K. Heyde and J. L. Wood, Rev. Mod. Phys.83, 1467
(2011).
EPJ Web of Conferences 223, 01054 (2019) https://doi.org/10.1051/epjconf/201922301054
![Figure 2. Calculated proton SPEs for the Ni chain. Figure istaken from Ref. [9]. The same color code is also used in Fig-ures 3, 4, and 6.](https://thumb-us.123doks.com/thumbv2/123dok_us/7989447.1325966/2.625.78.261.489.636/figure-calculated-proton-spes-chain-figure-istaken-color.webp)
![Figure 4. Calculated proton SPEs for the Ni chain. Figure isadapted from Ref. [32].](https://thumb-us.123doks.com/thumbv2/123dok_us/7989447.1325966/3.625.57.288.79.285/figure-calculated-proton-spes-chain-figure-isadapted-ref.webp)
