8th International Symposium of the Digital Earth (ISDE8)
IOP Conf. Series: Earth and Environmental Science 18 (2014) 012051 doi:10.1088/1755-1315/18/1/012051
Entropy algorithm for automatic detection of oil spill from
radarsat-2 SAR data
M Marghany1, J van Genderen
Institute of Geospatial Science and Technology (INSTeG)
Universiti Teknologi Malaysia, 81310 UTM, Skudai, Johor Bahru, Malaysia Email:[email protected]
Abstract. Synthetic aperture radar (SAR) is a precious foundation of oil spill detection, surveying and monitoring that improves oil spill detection by various approaches. The main objective of this work is to design automatic detection procedures for oil spill in synthetic aperture radar (SAR) satellite data. In doing so the Entropy algorithm tool was designed to investigate the occurrence of oil spill in Gulf of Mexico using RADARSAT-2 SAR satellite data. The study shows that entropy algorithm provides accurate pattern of oil slick in SAR data. This shown by 90% for oil spill, 3% look-alike and 7% for sea roughness using the receiver -operational characteristics (ROC) curve. It can therefore be concluded Entropy algorithm can be used as automatic tool for oil spill detection in RADARSAT-2 SAR data.
1. Introduction
Consistent with Marghany [1], Synthetic aperture radar (SAR) is a precious foundation of oil spill detection, surveying and monitoring that improves oil spill detection by various approaches. The different SAR tools to detect and observe oil spills are vessels, airplanes, and satellites [2,3,4,5]. Vessels can detect oil spills at sea, covering restricted areas, say for example, (2500 m x 2500 m), when they are equipped with the navigation radars [6]. On the other hand, airplanes and satellites are the main tools that are used to record sea-based oil pollution [5,7].
Further, SAR data have distinctive features as equated to optical satellite sensors which makes SAR extremely valuable for spill watching and detection [4,6,8,5]. These features are involved with several parameters: operating frequency, band resolution, incidence angle and polarization [5]. Marghany and Hashim [6] develop comparative automatic detection procedures for oil spill pixels in Multimode (Standard beam S2, Wide beam W1 and fine beam F1) RADARSAT-1 SAR satellite data post the supervised classification (Mahalanobis), and neural network (NN) for oil spill detection. They found that NN shows a higher performance in automatic detection of oil spill in RADARSAT-1 SAR data as compared to the Mahalanobis classification with a standard deviation of 0.12. In addition, they W1 beam mode is appropriate for oil spill and look-alikes discrimination and detection [5]. Recently, Skrunes et al., [8], nevertheless, reported that there are several disadvantages are associated with Current SAR based oil spill detection and monitoring. They stated that, SAR sensors are not able to detect thickness distribution, volume, the oil-water emulsion ratio and chemical properties of the SAR data. In this regard, they recommended to utilize multi-polarization acquisition data such as RADARSAT-2 and TerraSAR-X satellites. They concluded that the multi-polarization data show a prospective for prejudice between mineral oil slicks and biogenic slicks [7,8].
This work has hypothesized that the dark spot areas (oil slick or look-alike pixels) and its surrounding backscattered environmental signal complex looks in the RADARSAT-2 data can detect using Entropy Algorithm. The contribution of this work concerns with designing Entropy Algorithm
8th International Symposium of the Digital Earth (ISDE8)
IOPConf. Series: Earth and Environmental Science 18 (2014) 012051 doi:10.1088/1755-1315/18/1/012051
based on co-occurrence matrix. The objective of this work is to examine Entropy Algorithm for oil spill automatic detection in RADARSAT-2 data.
2. Data acquisition
The SAR data acquired in this study are from the RADARSAT-2 SAR that involves Standard beam mode (S2); W1beam mode (F1) image. SAR data are C-band and have a lower signal-to noise ratio due to their HH polarization with wavelength of 5.6 cm and a frequency of 5.3 GHz [6]. Further, RADARSAT-SAR data have 3.1 looks and cover an incidence angle of 23.7° and 31.0° [5]. In addition, RADARSAT-2 SAR data cover a swath width of 100 km.
3. Entropy algorithm based co-occurrence matrix
Entropy is a measure of unpredictability or information content. It is named after Boltzmann's H- theorem, Shannon denoted the entropy H of a discrete random variable of radar backscatter (
P
;, Pj )in pixels (i) and lines (j) with possible values P , ...,P n} and probability mass functionP
(P
) as,H (
P
) = E [- ln(P(P
))]. (1)Here E is the expected value operator when taken from a finite sample. Co-occurrence is implemented to discriminate oil slick in RADARSAT-2 data. Eight textures with 0°, 45o, 90o, 135o angular relationship and d=1, 2, 3...., dn is employed such as: Energy; Homogeneity; mean; variance; contrast dissimilarity; Entropy; correlation. On other hand, RADARSAT-2 SAR grey tone can describe as texture (i.e., the microstructure). A co-occurrence matrix or co-occurrence distribution (less often co- occurrence matrix or co occurrence distribution) is a matrix or distribution that is defined over an image to be the distribution of co-occurring values at a given offset. Mathematically, a co-occurrence matrix C is defined over an n x m image I, parameterized by an offset (A;, A j ) as [6]:
C — y n y m (1, if x(p,q)=i and x(p+AX ,q+Ay )=j
A;,Aj p —1 q—1^0, Otherwise(2)
According to Marghany [2,9], the texture feature for oil spill and look-alike detections are computed by the following formula:
h ( P ) —
yy
p-(P)log p,j (P). (3)In general, i and j are the row and column, Pxi and Py j are the marginal probability matrix obtained through the summation of Pj in the direction of the row and column. In this study, the window size is 7x7 pixels and lines [3,9].
4. Results and discussions
8th International Symposium of the Digital Earth (ISDE8)
IOP Conf. Series: Earth and Environmental Science 18 (2014) 012051 doi:10.1088/1755-1315/18/1/012051
Figure 1. RADARSAT-2 SAR data along the Gulf of Mexico.
Figure 2 shows the implementation of entropy algorithm with window 7 x 7 pixels and lines. It is interesting to find that entropy can isolate dark patches of oil spill from surrounding environment. It is clear that the oil spill was covered area more than 150 km in the Gulf of Mexico. Ships or platforms are dominated by bright tones that indicates highest backscatter values as compared to surrounding environment. This finding confirms the study of Marghany et al.[10]. In aspect Marghany et al. [4] found that fractal algorithm can discriminate between ships as highest bright tones and oil spill patches with darkest tones.
Figure 2. Entropy with kernel window of 7 x 7 pixels and lines.
Figure 3 shows the threshold out put result for entropy algorithm with kernel window size of 7 x7 pixels and lines. The implementation of threshold assists the dark patches to be isolated totally from the surrounding pixels. This mechanism confirms with other scene of RADARSAT-2 SAR data which acquired on April 28 2010. The visual interpretation shows different features with dark patches. Beside the oil spill dark patches, there are two other zones of low wind speed and wind shelter close to the land. The current boundary feature has brightest tone compared to surrounding features (Figure 4a). Therefore, the integration between oil spill and threshold produced excellent promise for oil spill semi automatic detection (Figure 4b).
8th International Symposium of the Digital Earth (ISDE8)
IOP Conf. Series: Earth and Environmental Science 18 (2014) 012051 doi:10.1088/1755-1315/18/1/012051
(a) (b)
Figure 4. RADARSAT-2 acquired on April 28 2010 (a) different features with oil spill and (b) semiautomatic detection of oil spill.
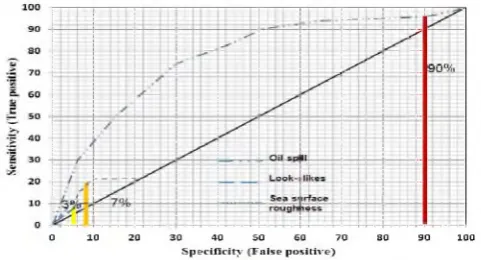
The receiver-operator characteristics (ROC) curve in Figure 5 indicates a significant difference in the discriminated between oil spill, look-alikes and sea surface roughness pixels. In terms of ROC area, the oil spill has an area difference of 90% and 3% for look -alike and 7% for sea roughness and a p value less than 0.0005 which confirms the study of Marghany [1]. According to Marghany [9] and Marghany and Hashim [6], entropy is measure of uniformity in SAR image. In general, the entropy is a measure of variability or randomness because the concentration of the backscatter changes in relatively few locations would be non-random essentially.
O 10 20 30 40 SO 60 70 80 90 100 S p e c i f i c i t y ( F a l s e p o s i t i v e )
Figure 5. ROC for oil spill discrimination using entropy.
On other words, entropy measures the absolute variability in backscatter change over the selected window. Further, the window size of 7x7 gives more details on an image [3]. Spatial parameter was specified as the relationship of a pixel to its neighbor to define the direction and distance for texture analysis. The spatial relationship has been considered for a pixel and its neighbor [9]. In this study, 0 and 1 selected the spatial (texture) algorithm, considered the relationship between each pixel and the one below it [5,6]. Therefore, steeper incident angle of RADARSAT-2 SAR data of 23.7° and 31.0° with swath width of 100 km are provided RADARSAT-2 extreme privilege for monitoring oil spill disaster occurrences as can be observed in the Gulf of Mexico crises [8].
5. Conclusions
8th International Symposium of the Digital Earth (ISDE8)
IOP Conf. Series: Earth and Environmental Science 18 (2014) 012051 doi:10.1088/1755-1315/18/1/012051
References
[1] Marghany 2013 Comp. Sci. and Its Appl. - ICCSA 2013 Lec. Not in Comp. Sci. 7972 587. [2] Brekke C and Solberg A 2005 Rem. Sens. of Env. 95 1.
[3] Marghany M 2001 Int. J. o f App. Ear. Obs. and Geo. 3 191.
[4] Marghany M, Cracknell A P and Hashim M 2009 Int. J. o f App. Ear. Obs. and Geo. 11 96.
[5] Topouzelis K, Karathanassi V, Pavlakis P and Rokos D 2009 Geo. Int. 24 179.
[6] Marghany M and Hashim M 2010 Int. J. o f the Phy. Sci. 5 1475.
[7] Migliaccio M, Gambardella A and Tranfaglia M 2007 IEEE Tran. on Geos. and Rem. Sen. 45 506.
[8] Skrunes S, Brekke C and Eltoft T 2012 An Experimental Study on Oil Spill Characterization by Multi-Polarization SAR,” in Proc. European Conference on Synthetic Aperture Radar,
Nuremberg, Germany p. 139.
[9] Marghany M 2004 Env. Mod. & Sof. 19 473.