ABSTRACT
GIL, GUK-HO. An Accessible Cognitive Modeling Tool for Evaluation of
Human-Automation Interaction in the Systems Design Process. (Under the direction of David B. Kaber.)
One of the main limitations of existing approaches to complex human-in-the-loop
system design is the requirement for empirical data as a basis for alternative design
se-lections. Experimental studies can be time consuming and costly. In addition, design
decisions are often based on collections of design guidelines with limited theoretical
ex-planations for why such guidelines may be effective from a human information processing
(HIP) perspective. The lack of a cognitive explanation limits understanding of when and
how guidelines can be applied. In order to better support conceptual design, various
cognitive modeling techniques and tools have been developed based on HIP
architec-tures. However, these techniques and tools also have several limitations from a design
perspective. Existing tools are not easy to use and designers or developers may need
extensive training and practice in use. Furthermore, there is currently no fundamental
set of tool capabilities, such as providing a task workload analysis or identifying patterns
of HIP (e.g., memory use), simulating visual object use (e.g., eye movements),
provid-ing interface design support, etc. This research integrated various capabilities of existprovid-ing
modeling tools into a new enhanced cognitive modeling language based on GOMS (Goals,
Operators, Methods, and Selection Rules).
While GOMS modeling methods and GOMS language are considered easy to learn
and use, the modeling approach has several limitations. The language is limited to
representing expert behavior in tasks. In addition, GOMS models do not support
peripheral) as well as parallel processing of visual and motor operations. Another
ma-jor limitation of GOMS modeling is that the operator time estimates are deterministic.
Therefore, model output may not accurately represent individual differences in
perfor-mance or the stochastic nature of human behavior in complex tasks. On the basis of these
limitations, there is a need to develop a new cognitive modeling tools. This research
de-veloped a computational cognitive modeling tool using the enhanced-GOMS language to
aid complex system designers in assessing the potential for automation-induced human
performance errors. Application of the tool focused on pilot use of automation on the
commercial aircraft flight-deck. The GOMS language was extended for application to this
context. Output of the tool was compared with experiment data for validation purposes.
It is expected that this approach would allow for accurate explanation and prediction of
user behaviors during the design of complex aircraft systems and/or interfaces.
The modeling tool development included: a prototyping module; a user activity flow
diagram (AFD) development module; an AFD to GOMS language translator; an
E-GOMSL editor; a model parser and compiler; and a model simulation tool and report
generator. This research used Microsoft (MS) Excel with Visual Basic for Application
(VBA) Macros in the modeling tool development. A designer is able to use images to
define a prototype including visual and non-visual objects (e.g., auditory interfaces). The
designer can also develop an AFD based on the results of a cognitive task analysis (CTA)
involving expert operators. The AFD is directly translated to E-GOMS by the translator
module. Alternatively, the designer is able to code an E-GOMS code model using the
E-GOMS editor. After coding the model, the parser and compiler can be used to obtain
a quantitative analysis including task execution times based on stochastic estimates of
individual operation times and a workload analysis. With these results and the GOMSL
and present a graphical workload analysis. Last, the report generator can be used to
produce a summary of the quantitative analysis and simulation.
In order to validate the results of the modeling tool, a flight simulator experiment was
conducted with a futuristic forms of cockpit automation (a Continuous Descent Approach
(CDA) tool for flight route replanning). A CTA was conducted to identify pilot behaviors
and to generate a data set for validation of the cognitive model output. An E-GOMS
model of pilot behavior with the CDA tool was compared against the experiment data.
Results demonstrated that the modeling approach provided as it was expected that this
approach would allow for accurate explanation and prediction of pilot cockpit behaviors
and that the tool would be useful during the design of complex aircraft systems and/or
An Accessible Cognitive Modeling Tool for Evaluation of Human-Automation Interaction in the Systems Design Process
by Guk-Ho Gil
A dissertation submitted to the Graduate Faculty of North Carolina State University
in partial fulfillment of the requirements for the Degree of
Doctor of Philosophy
Industrial Engineering
Raleigh, North Carolina
2010
APPROVED BY:
Michael S. Feary Robert St. Amant
Yuan-Shin Lee David A. Dickey
David B. Kaber
DEDICATION
To my wife and sons, Hyunjin, Daniel and David.
And my parents,
BIOGRAPHY
Guk-ho Gil was born in Gunsan, Korea. He completed his high school education in
Gunsan in 1995. He then joined Woosuk University. After two years of military service
in the Korean Army, he transferred to the Chonbuk National Univeristy. He received
the B.S. degree in 2003 and M.S. degree in 2005 in Industrial Engineering at Chonbuk
National University. During his masters degree, his study focused on development of a
scheduling management system for small-and medium-sized mold makers using process
patterns and 5-axis machining systems for manufacture of impellers and blades.
Since 2007, he has been working towards a doctorial degree in the department of
Industrial and Systems Engineering (ISE) at North Carolina State University (NCSU)
under the guidance of Dr. David Kaber. While at NCSU, he was a research assistant
funded by NASA Ames Research Center to study design of an advanced computational
modeling systems. He was also a teaching assistant in the ISE Department for Work
ACKNOWLEDGEMENTS
I would like to thank my academic advisor and committee chair Dr. David Kaber for his
continuous support, assistance and guidance throughout my graduate studies at NCSU.
He has shown me enthusiasm for work in academics and is a role model for my future
carrier. I would also like to thank the members of my committee, Dr. David Dickey,
Dr. Yuan-Shin Lee, Dr. Robert St. Amant, and Dr. Michael Feary for their trust and
comments in my study. I also thank Dr. Paul Picciano for giving me comments on
my research relate to software tool development. Related to this, I thank NASA Ames
for supporting my research and studies through a grant to the NCSU ISE Department
(Grant No. NNA07BC2SC). under the technical monitor of Dr. Feary. My education
would not have been possible without the support of NASA.
I would also like to thank my colleagues in the North Carolina State University
Cognitive Ergonomics Lab. Specifically, I wish to express my special appreciation to
Karl Kaufmann and Dr. Sang-Hwan Kim for their assistance during my research project
and experimentation.
I also wish to express my appreciation to my Korean friends (Eui-Seok Kim,
Kyoung-Ook Lee, Jaejun Lee, and Jaewook Seok) at NCSU and the church I have attended. I am
deeply indebted to them for providing encouragement and support during my degree.
Lastly, I would like to thank my parents and parents-in-law for their unconditional
support and endless love. I would also like to express my thankfulness to my wife, Hyunjin
TABLE OF CONTENTS
LIST OF TABLES . . . viii
LIST OF FIGURES . . . ix
LIST OF ABBREVIATIONS . . . xii
Chapter 1 Introduction . . . 1
1.1 Limitations of Existing System Design Approaches . . . 1
1.2 Objectives . . . 2
Chapter 2 Literature Review . . . 5
2.1 Errors in Human Performance and System Design . . . 5
2.2 The Human-Machine System Design Process . . . 7
2.2.1 Human Performance Modeling (HPM) in the Design Process . . . 11
2.2.2 Tools to Aid the Systems Design Process . . . 14
2.3 Summary of Design Process Research . . . 18
2.4 Existing Tools for Modeling User Behavior Based on HIP Architectures . 19 2.5 Comparison of Specific Third-Generation Modeling Tools . . . 22
2.5.1 Cognitive Modeling with QN-MHP and CogTool . . . 22
2.5.2 Comparison of Steps in Use of QN-MHP, CogTool and E-GOMSL 28 2.5.3 Classification of Modeling Methods . . . 31
2.5.4 Parallel Processing Capability . . . 32
2.5.5 Operator Times . . . 33
2.5.6 Summary of Existing Tools . . . 34
Chapter 3 The E-GOMSL Language . . . 36
3.1 Why GOMS? . . . 36
3.2 Limitations of GOMS Modeling Methods . . . 40
3.3 E-GOMSL (Enhanced GOMS Language) . . . 42
3.3.1 E-GOMSL Development . . . 43
3.3.2 E-GOMSL Cognitive Architecture . . . 50
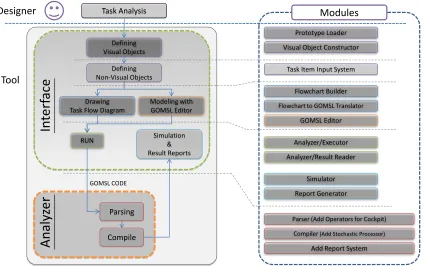
Chapter 4 E-GOMSL Tool Development . . . 53
4.1 Approach to Tool Development . . . 56
4.2 E-GOMSL Module Descriptions . . . 58
4.2.1 Prototyping Module . . . 59
4.2.2 Flowchart Builder . . . 62
4.2.4 Parser and Compiler . . . 65
4.2.5 Visualization Modules . . . 66
4.2.6 Report Generator . . . 71
Chapter 5 Experiment . . . 72
5.1 Objectives . . . 72
5.2 Flight Simulator Setup . . . 73
5.2.1 Hardware . . . 73
5.2.2 X-Plane Software . . . 73
5.3 Soft CDU/FMS Development . . . 75
5.4 Continuous Descent Approach (CDA) Tool Development . . . 77
5.5 Simulation of Modes of Cockpit Automation (MOA) . . . 78
5.5.1 Detail on CDU MOA . . . 79
5.5.2 Detail on CDU+ MOA . . . 81
5.5.3 Detail on CDA MOA . . . 82
5.6 Flight Scenario . . . 84
5.6.1 Participants . . . 86
5.6.2 Independent Variables . . . 86
5.6.3 Design of Experiment . . . 87
5.6.4 Dependent Variables . . . 87
5.7 Experiment Procedure . . . 89
5.8 Cognitive Task Analysis (CTA) . . . 90
5.9 Example of E-GOMSL Model and Outcomes . . . 93
5.10 Methodology for Comparison of Experiment and E-GOMSL Model Results 95 Chapter 6 E-GOMSL Tool Prototypes . . . 99
6.1 E-GOMSL Language . . . 99
6.2 Stochastic Variables . . . 100
6.3 Visual Objects . . . 105
6.4 Non-Visual Objects . . . 106
6.5 Flowcharting . . . 107
6.6 Simulation . . . 113
6.7 Visualization . . . 114
6.8 Outputs . . . 118
6.8.1 Time estimates . . . 118
6.8.2 Complexity indices . . . 118
6.8.3 Gantt chart . . . 119
Chapter 7 Use Case . . . 121
7.1 Scenario Development in E-GOMSL Tool . . . 121
7.1.2 Mission statements . . . 123
7.1.3 Event triggers . . . 124
7.1.4 Audio objects . . . 124
7.1.5 Clearances . . . 125
7.1.6 Plans . . . 125
7.1.7 Event list . . . 126
7.1.8 Event information . . . 128
7.2 Activity Flow Diagram (AFD) . . . 128
Chapter 8 Results . . . 132
8.1 Experiment . . . 132
8.1.1 Time-to-Task Completion (TTC) . . . 132
8.1.2 Heart Rate (HR) . . . 133
8.2 GOMSL Model Results . . . 135
8.3 E-GOMSL Results . . . 139
8.4 Validation of Modeling Results . . . 143
8.4.1 PERT-3 Analysis . . . 143
8.4.2 TTC Validation . . . 143
8.4.3 HR Validation . . . 144
Chapter 9 Discussion on Experiment and Modeling Results. . . 150
9.1 Human behavior prediction . . . 150
9.2 TTC Prediction . . . 152
9.3 HR Prediction . . . 152
Chapter 10 Conclusion . . . 154
10.1 Supporting Designer . . . 155
10.2 The E-GOMSL tool in the Design Process . . . 157
10.3 Caveats . . . 158
10.4 Future Research . . . 159
References . . . 165
Appendices . . . 171
Appendix A Flight Scenario Document prepared for Simulator Experiment . 172 Appendix B Modified Cooper-Harper Rating Chart . . . 186
LIST OF TABLES
Table 2.1 Comparison of contemporary cognitive modeling tools. . . 23
Table 3.1 Candidate operators (based on Wickens’ HIP model) for use in E-GOMSL tool. . . 48
Table 5.1 Features of modes of automation (MOAs) to be simulated using the flight simulator. . . 80
Table 5.2 Workload conditions. . . 85
Table 5.3 Design of Experiment. . . 88
Table 6.1 Summary of parameters for Log-Normal distribution. . . 102
Table 6.2 E-GOMS Language operators, time estimates and distribution pa-rameters. . . 103
Table 6.3 Complexity indices. . . 119
Table 8.1 Time estimates. . . 138
Table 8.2 Stochastic simulation results. . . 140
Table 8.3 The summary of time estimates using E-GOMSL model. . . 142
Table A.1 Event 1 Information. . . 176
Table A.2 Event 2 Information. . . 178
Table A.3 Event 3 Information. . . 181
Table A.4 Event 4 Information. . . 183
Table A.5 Event 5 Information. . . 184
LIST OF FIGURES
Figure 2.1 Comparison of design processes. . . 9
Figure 2.2 Design process involving HITL simulation and HPM. . . 13
Figure 2.3 Comparison of design process integrating HPM with an ideal sys-tems approach to design. . . 17
Figure 2.4 Cognitive modeling flow using QN-MHP (adapted from Liu et al. (2007)). . . 25
Figure 2.5 Cognitive modeling flow using CogTool. . . 27
Figure 2.6 Comparison of steps among tools. . . 30
Figure 3.1 MHP and Wickens’ model. . . 50
Figure 4.1 Design process flow and modules of E-GOMSL tool. . . 55
Figure 4.2 Loading an interface prototype image and defining visual objects. 60 Figure 4.3 Defining non-visual objects. . . 61
Figure 4.4 Flowchart builder prototype interface. . . 63
Figure 4.5 Flowchart to E-GOMSL translator. . . 65
Figure 4.6 E-GOMSL editor interface. . . 66
Figure 4.7 Visualization tool interface. . . 68
Figure 4.8 Wickens’ model of HIP (adapted from Wickens & Hollands, 1999) and E-GOMSL Gantt chart. . . 70
Figure 5.1 Flight simulator setup. . . 74
Figure 5.2 CDU and CDA tool development. . . 76
Figure 5.3 CDA tool interface design. . . 78
Figure 5.4 CDA and CDU/FMS interfaces under the CDU MOA. . . 81
Figure 5.5 CDA and CDU/FMS interfaces under the CDU+ MOA. . . 82
Figure 5.6 CDA and CDU/FMS interfaces under the CDA MOA. . . 83
Figure 5.7 CTA flow diagram (IDEF0: Integration Definition for Function Modeling). . . 91
Figure 5.8 Example of E-GOMSL model. . . 94
Figure 5.9 E-GOMSL model outcomes. . . 95
Figure 6.1 Using E-GOMS language during E-GOMSL model development. . 101
Figure 6.2 E-GOMSL tool interface for loading prototype images. . . 106
Figure 6.3 Defining visual objects. . . 107
Figure 6.4 Input of non-visual objects using the E-GOMSL tool. . . 108
Figure 6.5 The E-GOMSL task flowcharting tool interface. . . 109
Figure 6.7 E-GOSML model for parallel processing. . . 111
Figure 6.8 Visualization of parallel processing in E-GOMSL model. . . 112
Figure 6.9 Simulation preparation dialog. . . 114
Figure 6.10 Simulation replication results. . . 115
Figure 6.11 Simulation dialog for visualization. . . 116
Figure 6.12 Visualization icons. . . 117
Figure 6.13 Highlighting of the visual component in a model simulation. . . . 117
Figure 6.14 Gantt chart. . . 120
Figure 7.1 Phases of flight (adapted from Boeing 2008). . . 122
Figure 7.2 Translating scenario information to a task item. . . 123
Figure 7.3 Translating mission statements to a task item for E-GOMSL mod-eling. . . 123
Figure 7.4 Translating event triggers to a task item. . . 124
Figure 7.5 Translating a voice message to an audio object. . . 125
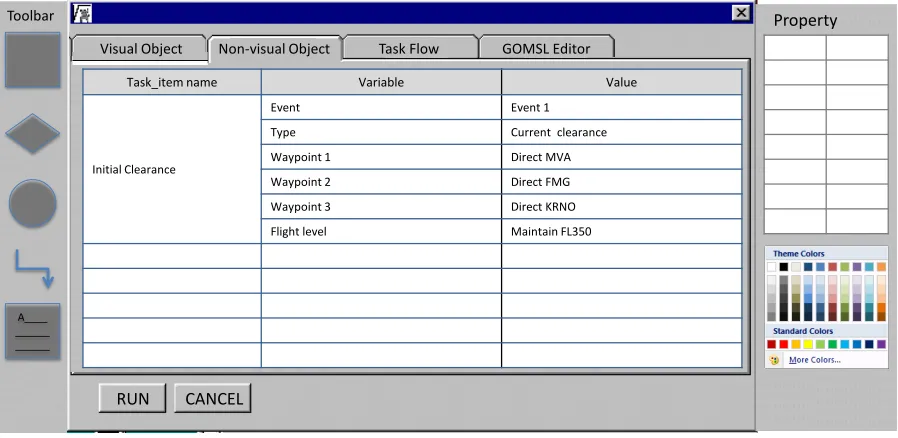
Figure 7.6 Translating an initial clearance to a task item. . . 126
Figure 7.7 Translating a plan to a task item. . . 127
Figure 7.8 Translating event information to an event list as a task item in E-GOMSL. . . 127
Figure 7.9 Translating event information to a task item. . . 129
Figure 7.10 Two phases of flight scenario. . . 129
Figure 7.11 A check clearance AFD. . . 131
Figure 8.1 Average total TTC by MOA and SET. . . 134
Figure 8.2 Total %HR by MOA and SET. . . 136
Figure 8.3 Total %HR by MOA and SET. . . 137
Figure 8.4 Scatter-plot matrix for TTC correlation analysis. . . 145
Figure 8.5 Summary of flight segments and the number of chunks of informa-tion in WM for each segment. . . 146
Figure 8.6 Total % increase in HR from minimum for various flight segments. 148 Figure 8.7 Total % increase in HR by WM chunk count. . . 149
Figure A.1 KRNO TA Chart. . . 174
Figure B.1 Modified Cooper-Harper Rating Chart. . . 187
Figure C.1 Overall Procedure (AAA). . . 189
Figure C.2 Monitoring (AAB). . . 190
Figure C.3 Check Clearance (AAC). . . 191
Figure C.4 Replanning (AAD). . . 192
Figure C.5 Route Requesting (AAE). . . 193
LIST OF ABBREVIATIONS
ACT-R Adaptive Control of Thought-Rational
AFD Activity Flow Diagram
ALT Altitude
APA Airline Pilots Association
API Application Programming Interface
ATC Air Traffic Control
ATM Automated Teller Machine
BC Back Course
CDA Continuous Descent Approach
CDU Control Display Unit
CDU+ Enhanced CDU
CMN-GOMS Card, Moran and Newell-GOMS
COGNET COGnition as a NETwork of tasks
COTS Commercial Off The Shelf
CPM-GOMS Cognitive Perceptual Motor (and Critical Path Method)-GOMS
CTA Cognitive Task Analysis
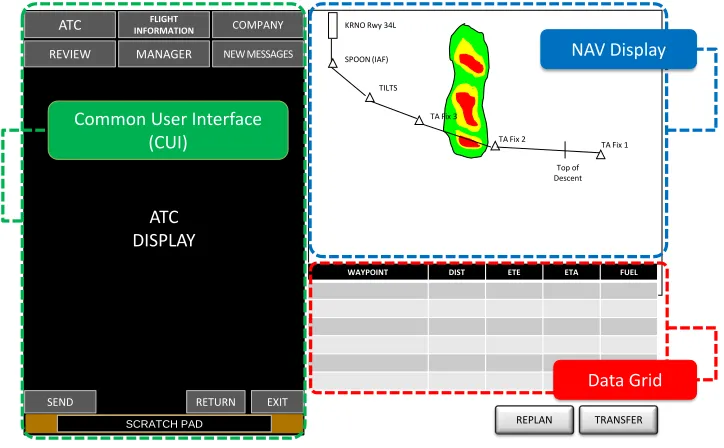
CUI Common User Interface
DIST DISTance to go
DL DataLink
DG Data-Grid
DME Distance Measuring Equipment
E-GOMSL Enhanced GOMS (Goals, Operators, Methods, and Selection rules)
Language
EPA Experimental Pilots Association
EPIC Executive-Process/Interactive Control
ETA Estimated Time of Arrival
ETE Estimated Time En route
EXEC EXECute
FL Flight Level
FMS Flight Management System
FREQ FREQuency
GDTA Goal Directed Task Analysis
GLEAN GOMS Language Evaluation and ANalysis
GOMS Goals, Operators, Methods, and Selection Rules
GOMSL GOMS Language
GPS Global Positioning System
GUI Graphical User Interface
HCI Human-Computer Interaction
HDG HeaDinG
HIP Human Information Processing
HITL Human-In-The-Loop
HOS Human Operator Simulator
HPM Human Performance Modeling
HR Heart-Rate
HRI Human-Robot Interaction
HTA Hierarchical Task Analysis
IAF Initial Approach Fix
IAS Indicated Air Speed
IDE Integrated Development Environments
IDEF0 Integration Definition for Function Modeling
ILC WILson Creek
I/O Input/Output
KIAS Knots Indicated Air Speed
KLM-GOMS Keystroke-Level Model GOMS
KRDU Raleigh-Durham International Airport
KRNO ReNO-Tahoe International Airport
LSK Line Select Key
LTM Long-Term Memory
MCH-UVD Modified Cooper-Harper for Unmanned Vehicles Displays
MIDAS Man-Machine Integration Design and Analysis System
MOA Mode Of cockpit Automation
MRT Multiple Resource Theory
MS MicroSoft
NAV NAVigation
ND Navigation Display on CDA tool
NGOMSL Natural GOMS Language
NM Nautical Mile
OMAR Operator-Model ARchitecture
PDA Personal Digital Assistant
PERT Project Evaluation and Review Technique
PF Pilot Flying
PFD Primary Flight Display
PNF Pilot Not Flying
QN-MHP Queuing Network-Model Human Processor
RTE Route
SAINT Systems Analysis of Integrated Networks of Tasks
SDK Software Development Kit
SPD Speed
STM Short-Term Memory
STSS Short Term Sensory Store
TA Tailored Arrival
TOF Types Of information processing Functions
TTC Time to Task Completion
UI User Interface
VBA Visual Basic for Application
VOR VHF (Very High Frequency) Omni-directional Radio-beacon
WL WorkLoad
WM Working Memory
Chapter 1
Introduction
1.1
Limitations of Existing System Design
Approaches
One of the main limitations of existing approaches to complex system design is the
requirement for empirical data as a basis for alternative design selections. Experimental
studies can be time consuming and costly. In addition, design decisions are often based
on collections of design guidelines with limited theoretical explanations for why such
guidelines may be effective. The lack of a cognitive explanation of why design principles
may be useful limits understanding of when and how guidelines can be applied.
In order to better support early stages of the human-machine systems design process
(conceptual design), various cognitive modeling techniques and tools have been developed
based on human information processing (HIP) architectures. However, these techniques
and tools also have several limitations from a design perspective. First, existing tools
per-formance, designers or developers may need extensive training and practice in tool use.
Furthermore, there is currently no fundamental set of tool capabilities, such as providing
a task workload analysis or identifying patterns of HIP (e.g., memory use), simulating
user visual attention (e.g., eye movements), and providing interface design support, etc.
The GOMS (Goals, Operators, Methods, and Selection Rules) cognitive modeling
technique developed by Card et al. (1993) has been used to predict user behavior and
evaluate system design. That said, the modeling approach has several limitations. First,
the language is limited to representing expert behavior in tasks that can be decomposed
to sets of procedure. In addition, GOMS models do not support representation of
lower-level behaviors, such as specific forms of visual processing (e.g., foveal vs. peripheral) as
well as parallel processing of visual and motor operations. The second major limitation
of GOMS modeling is that the time estimates associated with operators coded in models
for calculating task completion times are deterministic. Therefore, model output may
not accurately represent individual differences in performance or the stochastic nature of
human behavior in complex tasks.
1.2
Objectives
This research developed a computational cognitive modeling tool to aid complex system
designers in assessing the potential for automation-induced human performance errors.
The tool was developed in Microsoft (MS) Excel with Visual Basic for Application (VBA)
Macros to prototype, run and simulate user behaviors in interaction with automated
systems. An enhanced GOMS Language (E-GOMSL) served as the basis for the cognitive
modeling tool development. The target domain was commercial aircraft piloting and the
focused on pilot use of automation on the commercial aircraft flight-deck. Output of the
tool was compared with experiment data for validation purposes.
It was expected that this approach would allow for accurate explanation and
predic-tion of user behaviors during the design of complex aircraft systems and/or interfaces.
Al-though various cognitive modeling techniques and tools have been developed, the GOMS
approach was used in this study because it is considered to be usable by novices.
Further-more, GOMS, especially natural GOMS Language (NGOMSL: Kieras, 1997a), provides
a flexible format for modeling task methods and allows for extension of its capabilities.
E-GOMSL supported the use of low-level operations in models, stochastic time variables
and flexibility in coding of different kinds of operators/operations.
The modeling tool development included: a prototyping module to define visual and
non-visual objects as part of a target system interface; a user activity flow diagram
(AFD) development module; an AFD to E-GOMS language translator; an E-GOMSL
editor; a model parser and compiler; and a model simulation tool and report generator.
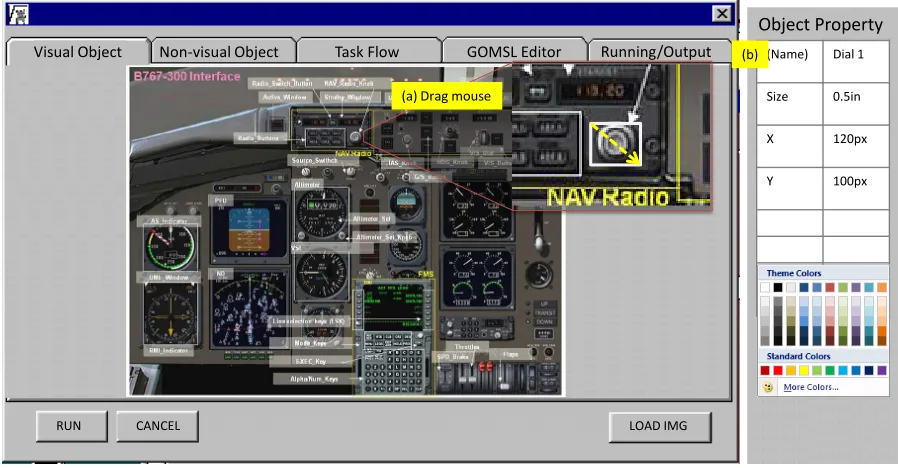
With respect to the prototyping module, a designer is able to load an image file as a
prototype and define visual objects and non-visual objects based on the prototype. The
designer is able to develop an AFD based on the results of a cognitive task analysis
(CTA) with expert operators. The AFD is directly translated to E-GOMSL by the
translator module. The designer is able to code an E-GOMSL model using the E-GOMSL
editor, if they so choose, or the edit an E-GOMSL model automatically generated by
the AFD translator. After coding the model, the parser and compiler can be executed
to obtain a quantitative analysis including task execution times based on stochastic
estimates of individual operation times and a workload analysis. With these results and
the E-GOMSL models, the simulator can be used to visualize the flow of HIP, represent
can be used to produce a summary of the quantitative analysis and simulation.
In order to validate the results of the modeling tool, a flight simulator experiment was
conducted with a futuristic form of cockpit automation (a Continuous Descent Approach
(CDA) tool for flight route replanning). A CTA was conducted to identify user behaviors
in interacting with such automation and to generate a data set for validation of the
cognitive model output. An E-GOMSL model of pilot behavior with the CDA tool was
compared against the experiment data. The results of the research are presented in later
section and are applicable to a variety of domains that may use cognitive modeling for
Chapter 2
Literature Review
2.1
Errors in Human Performance and System
Design
In a recent report on causes of fatal aviation accidents, “More than 88% of accidents
were caused by pilot errors (Boeing, 2009).” In this report, pilot errors were identified
as loss of control (35%), runway excursion (12%), and system failure (6%), etc. In
addition to these conditions, errors were attributed to failure of automatic equipment,
automation-induced error compounded by crew error, crew error in equipment set-up,
crew response to false alarms, failure to heed automatic alarms, failure to monitor systems
and loss of skill proficiency (c.f., Wiener & Curry, 1982). In general, errors were of two
types including person (active) and system (latent) errors (Foyle & Hooey, 2008; Reason,
2000). Two subtypes of operator errors are active and latent. “Active errors” are related
to the actions of operators in the complex system. For example, in direct control of
or ignore a warning tone. On the other hand, “latent errors” are due to actions that
are separated in space and time from those actions of an operator directly interfacing
with the system (Foyle & Hooey, 2008). Underlying causes of latent errors include poor
design, faulty maintenance, incorrect installation and bad management decisions (Foyle
& Hooey, 2008).
With respect to mitigating active errors, operator performance can be improved
through training. However, latent errors cannot be improved through training. Since
the causes of latent errors are poor design or interface interaction defects, such errors
must be solved during the design process. Therefore, endeavors must be made to ensure
design quality prior to releasing a system to a user. One approach to preventing poor
design is to use human factors research methods in the design process, including
de-scriptive studies, experimental research and evaluation research (Sanders & McCormick,
1993). Through these methods, alternative designs can be evaluated before releasing the
system to the user. Another way to eliminate interface interaction defects is to adopt
a human-centered design approach combined with a human factors evaluation approach
(Hooey et al., 2002; Kaber & Draper, 2001; Reuzeau & Nibbelke, 2004). Previous
stud-ies have defined human-centered design methodologstud-ies, including user CTA and iterative
evaluation of alternatives. Wickens and Hollands (1999) emphasized the importance of
repeated cycles of design since design of a product is followed by use. The next section
will address how this research will support the design process and reductions of system
2.2
The Human-Machine System Design Process
There are four general approaches to the design process, including a technology-centered
approach, user-centered approach, control-centered approach and ecological (or
use-centered) approach (Flach et al., 1998). The technology-centered approach focuses on
the importance of the capabilities of the machine (e.g., automated systems). In this
approach, an interface design is dictated by technological capabilities. The user-centered
approach focuses on the limitations of human-information processing capabilities (e.g.,
working memory (WM) capacity). The control-centered approach focuses on the
cou-pling between humans and technologies to emphasize system stability constraints (e.g.,
observability and controllability). The ecological (or use-centered) approach focuses on
the human and work, versus the human and interface, by considering the design of the
system relative to the designated functions to be performed in a larger work or problem
space.
All of the above approaches may be involved in a design process to ensure the
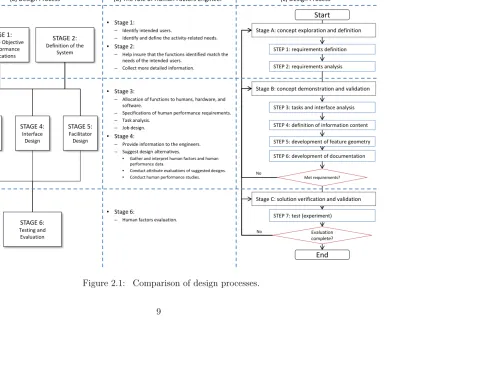
qual-ity of system interface design. Figure 2.1 presents a comparison of design processes,
including Sanders and McCormick’s (1993) six-stage design process model and Reuzeau
and Nibbelke’s (2004) modified V-design cycle. Sanders and McCormick (1993) adapted
the system design process from Bailey (1982) for developing military and space systems.
They defined six stages including: (1) determine objectives and performance
specifica-tions; (2) definition of the system; (3) basic design; (4) interface design; (5) facilitator
design; and (6) testing and evaluation (see Figure 2.1 at (a)). Each stage includes human
factors design functions that were described by Bailey (1982) (see Figure 2.1 at (b)).
Reuzeau and Nibbelke (2004) identified the V-design cycle as a human-centered design
empha-sized the role of rapid prototyping, which facilitates the integration of users in the design
activities (Reuzeau & Nibbelke, 2004). The process includes three stages: (1) concept
exploration and definition; (2) concept demonstration and validation; and (3) solution
verification and validation (see Figure 2.1 at (c)). In the first stage, designers identify
user needs and research concept of design solutions. Sub-processes of this stage include
requirements definition and analysis. The second stage focuses on the definition of the
system and interface. In this stage, task analysis should be conducted. The last stage
is the verification and validation of the new design. This modified V-design process was
considered suitable for the purpose of integrating the E-GOMSL tool to support complex
systems design. It essentially describes an iterative design process with a human-centered
approach and focuses on rapid prototyping and task analysis. These are all critical steps
STEP 1: requirements definition STEP 2: requirements analysis
STEP 3: tasks and interface analysis STEP 4: definition of information content STEP 5: development of feature geometry STEP 6: development of documentation
STEP 7: test (experiment)
End Start
Stage A: concept exploration and definition
Stage B: concept demonstration and validation
Stage C: solution verification and validation
No Evaluation complete? Met requirements? No STAGE 1: Determine Objective and Performance Specifications STAGE 2:
Definition of the System STAGE 3: Basic Design STAGE 4: Interface Design STAGE 5: Facilitator Design STAGE 6: Testing and Evaluation
• Stage 1:
– Identify intended users.
– Identify and define the activity-related needs.
• Stage 2:
– Help insure that the functions identified match the
needs of the intended users.
– Collect more detailed information.
• Stage 3:
– Allocation of functions to humans, hardware, and
software.
– Specifications of human performance requirements. – Task analysis.
– Job design.
• Stage 4:
– Provide information to the engineers. – Suggest design alternatives.
• Gather and interpret human factors and human
performance data.
• Conduct attribute evaluations of suggested designs.
• Conduct human performance studies.
• Stage 6:
– Human factors evaluation.
Sanders and McCormick (1993)
(a) Design Process (b) The role of Human Factors Engineer
Reuzeau and Nibbelke (2004)
(c) Design Process
Since human factors functions may help designers to understand user intentions to
achieving goals and factors related to alternative designs, any design process integrating
human factors functions can enhance previous technology-centered design approaches
and reduce gaps between users and designers. Therefore, during the design process,
consideration of the role of the user is very important. For example, pilots may be
familiar with abnormal and potentially dangerous flight situations. They can evaluate
new designs and concepts for supporting performance under off-nominal conditions and
provide a designer with feedback. In order to ensure design quality and safety, alternate
design concepts should be compared and evaluated.
Human factors methods to evaluate design concepts can be generally categorized
as two types, including human-in-the-loop (HITL) simulation and testing and HPM.
HITL simulation uses real operators to collect empirical data that can be used to predict
performance. HITL simulation and testing is considered a useful method in the design
validation stage. The design process, including HITL simulation, is based on iterative
testing and design revision with users to help identify usability problems (Kieras, 1997a).
Although empirical user testing is widely accepted for supporting conceptual design, this
method has several weak points including slow progress of experiments, compensation for
test users, cost of designing prototype hardware, and difficulty in recruiting experts (Card
et al., 1983). For these reasons, Card, Moran and Newell (1983) suggested the concept of
engineering HIP models for interface usability assessment (i.e. HPM). HPM also allows
for quantification of performance capacities and limitations without the use of human
subjects. Therefore, using HPM methods for this study may reduce the cycle time and
increase the possibility of selecting a better design concept. HPM can be integrated in
the analysis and simulation of engineered systems by using network models and cognitive
This research will focus on cognitive models, which are simulation models realized as
computer programs that mimic performance of human cognitive skills (Ritter & Young,
2001). In order to use both network and cognitive models in the design process, Reuzeau
and Nibbelkes (2004) design process will be used. Although Sanders and McCormicks
(1993) model has been most widely used in human factors area, the model has a
limita-tion of no feedback routines from each stage. Since the design process requires several
replications of alternative design selections when using HPM concepts during the design
process, the feedback information is very important. Thus, HPM will be integrated in
Reuzeau and Nibbelkes design process.
2.2.1
Human Performance Modeling (HPM) in the Design
Process
HPM is a process used to predict human performance as a function of aspects of
infor-mation processing (Proctor & Vu, 2002). HPMs may be represented mathematically or
programmed in a computer to produce predictions of human behavior used to identify
practical problems in design (Pew, 2008). The integrated HPM approach can be coupled
with the HITL approach (Foyle & Hooey, 2008) towards ensuring design effectiveness.
This can be a powerful approach, but is time consuming and costly. Thus, HPM may
be used solely during the design process to reduce costs. Limitations of this approach
may include lack of extensibility of the modeling methods to particular domains (e.g.,
different operating conditions and interfaces) model coding methods may also be very
complex and difficult to learn and use (Pew, 2008).
In the three major stages of the design process according to Reuzeau and Nibbelke
validation) and third stages (solution verification and validation). In the second stage,
task analysis should be conducted in order to define the system and interface. Kieras
(1997a) suggested that HPM starts with a CTA. In the third stage of the design process,
empirical user testing or engineering model testing is conducted to evaluate new designs.
A HPM may serve as a substitute for experimentation testing in this stage.
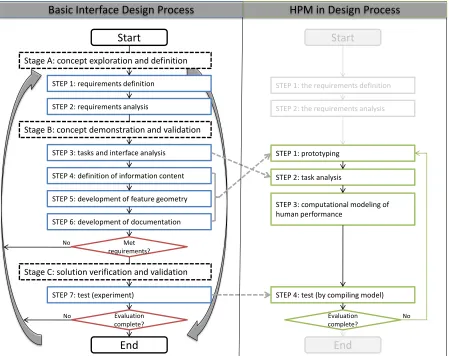
Figure 2.2 presents a comparison of the basic interface design process and the process
augmented with HPM. The basic process integrating HITL includes seven iterative steps
in three stages: (1) requirements definition; (2) interface requirements analysis; (3) task
and interface analysis; (4) definition of information content; (5) development of interface
feature geometry; (6) development of documentation; and (7) testing or experimentation
(Reuzeau & Nibbelke, 2004). The HPM process can be effectively integrated with these
steps. On the right side of Figure 2.2, the first step is prototyping and task analysis
fol-lowed by computational modeling of human performance, and finally testing by analysis
of compiled model output. Although both processes are iterative, the number of
replica-tions of the process involving HITL (left side of Figure 2.2) is limited by the number of
available subjects for testing.
After conducting experiments with human users, designers can evaluate the results on
a new design concept. In this step, HITL testing is very limited in that only one concept
of a design can be evaluated at a time. With complete evaluation results, designers can
decide which designs are good or bad. If human subject testing with hardware prototypes
is the only method of evaluation in this process, it will be extremely time consuming and
costly. However, if HPM is used, multiple software prototypes can be integrated with
Basic Interface Design Process HPM in Design Process
STEP 1: requirements definition
STEP 2: requirements analysis
STEP 3: tasks and interface analysis
STEP 4: definition of information content
STEP 5: development of feature geometry
STEP 6: development of documentation
STEP 7: test (experiment)
End Start
Stage A: concept exploration and definition
Stage B: concept demonstration and validation
Stage C: solution verification and validation
No
Evaluation complete?
Met requirements?
No
Start
End
STEP 2: task analysis
STEP 3: computational modeling of human performance
STEP 4: test (by compiling model) Evaluation complete?
STEP 1: the requirements definition
STEP 2: the requirements analysis
STEP 1: prototyping
No
accelerate good design alternative selection.
2.2.2
Tools to Aid the Systems Design Process
Human factors research has focused on aviation systems, ground transportation systems,
display and control design, human-robot interaction (HRI), HCI, etc. Human factors
studies in aviation include systems safety research, pilot performance research,
investiga-tions of pilot error (e.g., workload analysis, situation awareness (SA) analysis, cognitive
demand assessment, etc.), automation design, etc. (Jorna & Hoogeboom, 2004). The
present research focuses on advanced commercial aircraft cockpit design, which addresses
the interaction between a pilot, a computer and the machinery of an aircraft. Jorna and
Hoogeboom (2004) said that “the flight deck or cockpit is a safety critical working area
where the brains of the flight crew, or the individual pilot, are connected with the sensors,
controls and (when applicable) the automated brains of the aircraft.” All the equipment
in the cockpit is designed to support a pilots mission and duty set. Due to interactions
between a pilot and equipment in the cockpit, human factors considerations are
impor-tant to ensure design adequately supports information processing. In order to improve
system effectiveness and reduce cost, Feyen et al. (1999) said human factors knowledge
should be integrated into the system design as early as possible.
The HPM approach can be applied to address these issues to improve the system
effectiveness and to reduce cost. HPM tools can be used to aid the cockpit designer
early in the design process and to promote usability of cockpit automation. To date,
there have been four generations of HPM tools. The first generation was paper and
pen-cil modeling (e.g., CMN (Card, Moran and Newell)-GOMS and KLM (Keystroke-Level
Model)-GOMS; Card et al., 1983). When Card, Moran and Newell (1983) proposed the
hu-man behavior. After KLM, Kieras (1997a) developed NGOMSL, which also used paper
and pencil for modeling purposes. Subsequently, advanced computational
(computer-based) tools were developed to predict how humans would interact with new system
interface designs. One of the first advanced tools was GLEAN (GOMS Language
Eval-uation and Analysis: Kieras et al., 1995; Kieras, 2006). GLEAN represents the second
generation of HPM tools. Although GLEAN can compile models in computer code, it is
generally not accessible for use by a designer in the conceptual design process because
of its complexity. A complex structured language is used for model development and
a command-line interface is used for model compilation. The tool does not provide a
visual representation of the task or interface or the model-based behavior predictions.
Therefore, GLEAN requires an existing interface for analysis. GLEAN is not a tool to
aid complex system design but a tool to aid in developing human performance models
during the design process.
Consequently, a third generation of modeling tools was developed with the
capabil-ity to aid and support designers in predicting user performance in interacting with new
systems. Before discussing this generation, it is necessary to define the fourth
genera-tion of modeling tools. The fourth generagenera-tion essentially represents an ideal system for
supporting the design process. A fourth generation tool must support multiple
function-alities, including task analysis, prototyping, modeling, compiling, simulating and result
reporting. The task analysis function must allow for breakdown of primary and sub-goals
as part of a task, as well as identification of the technology to be implemented in the
system. The prototyping function must support designers to create visual prototypes
using graphical tools. The modeling function must provide designers with flowcharting
capability with which they can create human performance models. The compiler function
(or actual human performance model code). The simulation function should provide the
capability to visualize human performance model outputs in real-time, as well as task
workload variability, and internal (human) information processing transactions. The
reporting function must provide designers with a summary of the results of the
simula-tion. All of these modules need to be usable during an iterative systems design process.
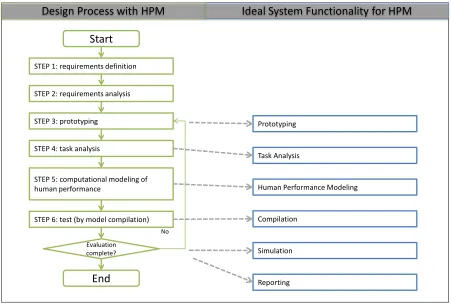
Figure 2.3 compares the basic system design process with this ideal (fourth generation)
system for supporting design. Any fourth generation tool must fully support designers
during the design process.
Third generation tools are conceptually located between the second and fourth
gen-eration tools. Third gengen-eration tools provide more capability than second gengen-eration
tools while they have less capability than fourth generation tools. Most contemporary
HPM tools fall in the third generation of tools. They must support basic
functionali-ties, including behavior modeling, model compilation, simulation and result reporting.
However, task analysis and prototyping functions may not be requirements for this
gener-ation. These functions can be executed by hand or by using other specific tools that only
support the task analysis or prototyping functions. Although third generation tools do
not support all design functions, the gap between the early stages of the design process
(i.e., task analysis and prototyping) and the modeling stage (modeling, compiling,
simu-lating and result reporting) can be reduced through alternative functions. For example,
a flow charting tool can reduce the effort of translating the results of task analysis to
HPM tools. Furthermore, an image loader/viewer can import a prototype image and
reduce the effort of defining visual objects that must be used in HPM tools. Thus, third
Ideal System Functionality for HPM Design Process with HPM
Task Analysis Prototyping
Human Performance Modeling
Compilation
Simulation
Reporting Start
End STEP 4: task analysis
STEP 5: computational modeling of human performance
STEP 6: test (by model compilation)
Evaluation complete? STEP 1: requirements definition
STEP 2: requirements analysis
STEP 3: prototyping
No
Figure 2.3: Comparison of design process integrating HPM with an ideal systems
2.3
Summary of Design Process Research
In summary, human errors in system control may be the cause of fatal aviation accidents.
Latent types of errors may be a result of pilot actions that are removed in space and time
from those actually occurring by the pilot directly interfacing with the system when a
failure results (Foyle & Hooey, 2008). The reasons for errors include poor system design,
faulty maintenance, incorrect installation of systems and bad management decisions.
Er-rors due to poor design or interface interaction defects may be resolved through the system
design process. During design processes, HITL simulation and HPM approaches may be
used to improve effectiveness of design alternative selection for effective system
perfor-mance. The design process can follow one of several approaches (technology-centered
ap-proach, user-centered apap-proach, control-centered approach or ecological approach: Flach
et al., 1998) and generally involves three major stages including: concept exploration and
definition; concept demonstration and validation; and solution verification and validation
(Reuzeau & Nibbelke, 2004). Although, the role of HITL testing can be very important
in the design process, this method has several weak points including: (1) high costs in
developing prototype hardware; (2) difficulty in recruiting experts; (3) slow progress of
experimentation; and (4) expensive user testing (Card et al., 1983). Thus, Card, Moran
and Newell (1983) suggested the concept of engineering models for systems usability
eval-uation (i.e., HPM). In the three stages of the design process, human factors is a focus
in the second (concept demonstration and validation) and third stages (solution
verifi-cation and validation). During the design process, both HITL and HPM methods can
be used to evaluate alternate designs. However, HPM processes involve less time and
cost to complete because HPM uses software prototypes and cognitive models to
The HPM approach can be applied early in the overall design process (compared with
HITL) to address human factors issues including display clutter, pilot workload, human
errors, stress, SA, cognitive demands, complacency, automation issues, teamwork, team
resource management, etc. (Jorna & Hoogeboom, 2004). The HPM tool can be one
of several generations including paper and pencil (e.g., CMN-GOMS and KLM-GOMS:
Card et al., 1983), a computational model for compilation (e.g., GLEAN: Kieras et al.,
1995), an integration tool (e.g., QN-MHP (Queuing Network-Model Human Processor:
Liu et al., 2006)) or an ideal integrated system. The ideal system includes task
analy-sis, prototyping, modeling, compilation, simulation, and reporting modules. This study
developed a tool spanning the third and fourth generations of modeling tools.
2.4
Existing Tools for Modeling User Behavior Based
on HIP Architectures
There are many HIP architectures and cognitive modeling techniques that have been
previously developed. Among these are GOMS (Card et al., 1983), GOMSL (GOMS
Language: Kieras, 2006), ACT-R (Adaptive Control of Thought-Rational: Anderson &
Lebiere, 1998), EPIC (Executive-Process/Interactive Control: Kieras & Meyer, 1997),
OMAR (Operator-Model Architecture: Deutsch & Adams, 1995), SAINT (Systems
Anal-ysis of Integrated Networks of Tasks: Wortman et al., 1975), QN-MHP (Liu et al., 2006;
Wu & Liu, 2007), HOS (Human Operator Simulator: Pew, 2008), etc. These tools are
based on different modeling methods, including: (1) network/reliability models (e.g.,
HOS, SAINT and QN-MHP); and (2) cognitive process models (e.g., GOMS, GOMSL,
ACT-R and OMAR) (Pew, 2008). The network/reliability models use network diagrams
system development. Reliability type models are used to predict the probability of human
error. Cognitive process models use cognitive architectures (theoretical representations
of HIP) as a basis for developing human behavior models in context. The main difference
between cognitive process models and other modeling methods is that the model is
de-signed to simulate how the model developer expects HIP to work in a particular domain
(Pew, 2008).
This research focused on cognitive process models. Most of these techniques provide
users with second generation tools, including a model parser and compiler (like GLEAN:
Kieras et al., 1995; Kieras, 2006). However, all of them do not provide third or fourth
generation tools to be used during a design process by system designers. Current third
generation tools include iGENTM (Emmerson, 2000), Micro SAINT Sharp (Bloechle &
Schunk, 2003; Schunk, 2000), MIDAS (Man-machine Integration Design and Analysis
System: Gore et al., 2008), QN-MHP (Liu et al., 2006; Wu & Liu, 2007) and CogTool
(John et al., 2004; Teo & John, 2008). iGENTM is a modeling tool based on task
anal-ysis which uses COGNET (COGnition as a Network of Tasks: Emmerson, 2000; Wu
& Liu, 2007) as a basis for a cognitive framework. iGENTM takes an artificial
intel-ligence/cognitive modeling approach to CTA; that is, behavior modeling is used as a
basis for task analysis. It also uses agents (pseudo-operators), which are autonomous
software components, with the capability to identify problems of a specific type, solve
them in a human-like manner, and implement solutions (Emmerson, 2000). The tool
focuses on several application areas such as analyzing operational effectiveness in a
dig-ital battle-space and decision aiding in human-machine interfaces for commanders and
aircraft pilots (Emmerson, 2000). The tool includes task analysis, modeling, compilation
and simulation modules.
simulation software package developed based on the task network modeling method and
is used to predict human performance (Schunk, 2000). The design of the tool targets
individuals with little exposure to simulation or computer science. The tool uses a task
network model and provides a task flow diagram capability (Barnes & Laughery Jr, 1998).
The application areas of this tool include manufacturing, health care, human factors and
ergonomics. It focuses on improving the operation of complex systems. Specifically,
Micro SAINT is used to decide on the number of human operators necessary for effective
complex system control. The tool provides prototyping (i.e., process layout), modeling,
compilation, simulation, and reporting modules.
The third tool is the MIDAS. This is a 3D rapid-prototyping HPM and simulation
environment that can be used to facilitate the design, visualization and evaluation of
complex human-machine system concepts (Gore et al., 2008). MIDAS includes a
hu-man hu-manikin (physical model), “JACK”, to improve visualizations of the implications of
cockpit design alternatives (Pew, 2008). JACK is actually an anthropometric modeling
and analysis tool that was developed at the University of Pennsylvania and integrated in
the MIDAS tool. MIDAS is a specialized tool for the cockpit. The modules of this tool
include 3D prototyping, modeling, compilation, simulation and report generation.
The fourth tool identified above is the QN-MHP. This is a modeling and simulation
tool for representing human cognition based on queuing network theory (Wu & Liu,
2007). The tool is focused on single and dual tasks in driving situations. It provides
modeling, simulation and report generation modules. (The QN-MHP modeling approach
will be reviewed in detail later in this section.)
The last tool is CogTool, which is a UI (user interface) prototyping tool that can
produce quantitative predictions of how users will behave when a prototype system is
Dream-Weaver before a stand-alone version was created (John et al., 2004). The tool is
specifically designed for web page prototyping. Some efforts have been made to extend it
to other domains (e.g., PDA (personal digital assistant): John & Salvucci, 2005; mobile
phone: John & Suzuki, 2009). It also provides prototyping, modeling, compilation,
simu-lation and report generation modules in the latest version (Teo & John, 2008). Table 2.1
summarizes the capabilities of the five (third generation) modeling tools reviewed above.
Along with the QN-MHP, CogTool will be discussed in greater detail later in this section
as basis for the present E-GOMSL tool development.
2.5
Comparison of Specific Third-Generation
Modeling Tools
In this section, a detailed comparison of the QN-MHP and CogTool techniques is
pre-sented as they include modules relevant to the present E-GOMSL development effort.
Four features will be discussed including: (1) steps to using the tools; (2) modeling
meth-ods in terms of UI design; (3) model workload representation; (4) visualization methmeth-ods;
(5) parallel processing capability; and (6) operator times. Moreover, the proposed tool
(E-GOMSL) concept is compared with the QN-MHP and CogTool approaches in this
section. The advantages and disadvantages of these tools with respect to the E-GOMSL
tool are identified. Like any modeling method, the QN-MHP and CogTool have certain
weakness for supporting human performance model development.
2.5.1
Cognitive Modeling with QN-MHP and CogTool
QN-MHP is based on a queuing network theory of human performance and “behavior
Table 2.1: Comparison of contemporary cognitive modeling tools. Modeling Tool iGENTM [Emmerson, 2000] Micro SAINT Sharp [Bloechle and Schunk, 2003] MIDAS
[Gore et al., 2008]
QN-MHP 2.1
[Wu andLiu, 2007]
CogTool
[Teo and John, 2008]
Features
A modeling tool based on CTA. A discrete-event simulation software package based on task network modeling methods to predict human performance.
A 3-D rapid prototyping HPM and simulation environment. Modeling and simulation tool for representing cognitive systems based on the queuing network theory of human performance.
A UI prototyping tool that can produce quantitative predictions of how users will behave when a prototype is ultimately implemented. Current
Version - 3.0 5.0 2.1 1.0.4
Theoretical
Framework COGNET SAINT MIDAS
Queuing
Network ACT-R
Modeling Method Reliability model Network model Cognitive process model Network model Cognitive process model Task
Analysis
○
×
×
×
×
Prototyping
×
Δ (work env.)○
×
○
Modeling
○
○
○
○
○
Compiler
○
○
○
(APEX)×
○
Simulation
○
○
○
○
○
Report
generator
×
○
○
○
○
Target Application Navy and aviation operations Improve military processes Aviation
operations Driving
Website development
Resources http://www.chisystems.com/ http://www.maad.com/index.pl
representing processors in the cognitive system for information processing; (2) routes for
representing the connections between these servers; and (3) entities for representing the
information that travels through and is processed by the network. The queuing network
theory uses mathematical functions to quantify human response time and multitask
per-formance. Response time is modeled in terms of entity (stimulus) wait time and server
processing time. The QN-MHP has been used to simulate human behavior in visual
search, visual-manual tracking and driving (Wu & Liu, 2007). The modeling approach
can output behaviors in real-time and quantify operator workload levels.
When modeling dual-task performance in driving, for example, a designer may start
by selecting a combination of tasks to analyze (see Figure 2.4). The primary task may
be steering in which case the simulated driver steers a car on a freeway. The secondary
task may be operation of a Global Positioning System (GPS) device while driving. After
selecting the dual-task combination (see Figure 2.4 (a)), the designer simply describes
the task scenario to be modeled using a storyboard methodology (see Figure 2.4 (b). For
example, in order to model button selection on the GPS interface, the designer may choose
one of the action lists (e.g., “look at,” “store to STM (short-term memory),” “retrieve
from STM,” “decide,” “reach to (by hand),” etc.) in the combo-box. This description
of task steps is repeated until all UIs are addressed. After defining the tasks and the UI
mockups, the designers can begin the behavior simulation work (see Figure 2.4 (c)). A
designer can also compare and revise task interface prototypes based on the simulation
results (see Figure 2.4 (d)). The designers may conclude that one design concept (see
(d) Comparison of the simulation results (c) Simulation
(a) Select task (b) Demonstration
Single Task
Task 1 Task 2 Dual Task
Next Step
Steering A New Task
A New Task
Steering Tracking Typing
Step User interface change in this step?
Step User interface changein this step?
New Address
Recent Address
Food, Hotel, and More
Object Channel Action 1 Action 1 Action 1 More actions Start time of current step
DONE (Whole Task) Define Task Again
Previous Step UI Image Window
Listento Store to STM Retrieve from STM Update STM Clear STM Store to LTM
Look at
1 UI_5
Visual
Watchfortext Address Button
Step User interface changein this step? 3 UI_3
DONE (Both T1, T2) Previous Step Next Step
Number of repetition Does the current step wait until
the previous step finishes?
Object Channel Action 1 Action 2 Action 6 More actions Reachto (foot) Turn(steering wheel) with hand Move joystick Speak Store to STM Retrieve from STM
Readto(hand) Visual
lookat 2117 Stone Rd
Step User interface changein this step? 1 UI_6 Object Channel Action 1 Action 5 Action 6 More actions lookat Visual Menu button
DONE (Both T1, T2) Previous Step Next Step
Number of repetition Does the current step wait until
the previous step finishes?
Listento Store to STM Retrieve from STM Update STM Clear STM Store to LTM
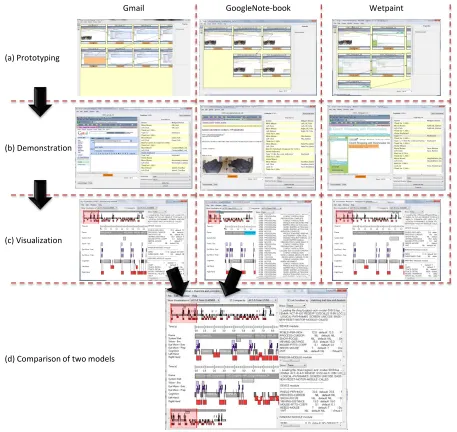
When modeling user behaviors with CogTool, a designer must start by mocking-up a
system interface prototype. Take, for example, a user sharing a link and comment while
shopping for a couch on “craiglist.com.” The CogTool starts with mocking up the
inter-face prototype (source downloaded from http://cogtool.hcii.cs.cmu.edu). This example
(see Figure 2.5) involves three different websites to describe the process of sharing a link
and commenting on it, including: (1) Gmail (http://mail.google.com); (2) Google
Note-book (http://www.google.com/ noteNote-book); and (3) Wetpaint (http://www.wetpaint.com).
Figure 2.5 (a) presents the screen mockups. The CogTool allows for creation of
proto-types by importing captured images. Protoproto-types (or frames) can be connected by lines
(using the CogTool interface) according to the flow of a task scenario. The next step
simply demonstrates each frame a user would see by clicking a mouse (see Figure 2.5
(b)). When demonstrating the prototypes, operators or user actions will be recorded in
the right table (e.g., “Home Mouse,” “Move Mouse,” “Type,” “Think for,” etc.). They
are referred to as scripts, as in ACT-R code. With these scripts, model visualization can
be conducted to illustrate how the CogTool produces predictions on task performance
(see Figure 2.5 (c)). The output includes a time line representing the different
activi-ties/scripts ACT-R executes to make the predictions as well as a text-based trace of the
models run. Furthermore, the model visualization module has a capability to compare
the use of multiple different websites (see Figure 2.5 (d)) for the task. One of the results
of this example is time estimates for task performance with each website: (1) Gmail took
33.495 seconds; (2) GoogleNotebook took 17.763 seconds; and (3) Wetpaint took 33.015
seconds. The designer may conclude that the GoogleNotebook design may be superior
(a) Prototyping
(b) Demonstration
(c) Visualization
Gmail GoogleNote-book Wetpaint
(d) Comparison of two models
2.5.2
Comparison of Steps in Use of QN-MHP, CogTool and
E-GOMSL
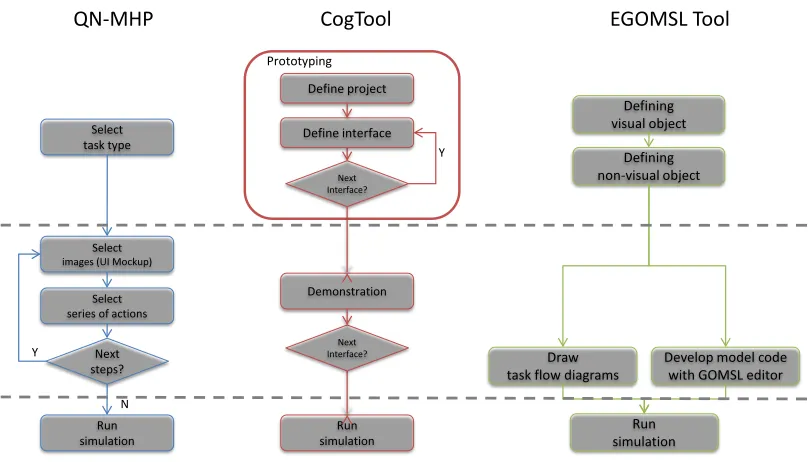
The identified modeling approaches have similar steps. With respect to the QN-MHP,
there are three stages to use. In the first stage, designers need to select a task type
including single or dual task. Designers should then pick one of the predefined tasks or a
new task. The second stage includes a processing loop for defining task actions. The loop
repeats based on the number of task steps. The last stage involves running a simulation
of the task. Similarly, the CogTool also has three stages to use. The first stage involves
prototyping an interface. Functions are iterated based on the number of web pages to be
modeled. The second stage is a functional demonstration using the prototype to define
task actions and steps. The number of demonstration steps is the same as the number of
prototype features. The last stage involves running the prototype simulation. CogTool
involves more steps than the QN-MHP because it has a prototyping stage. While the
QN-MHP uses a pre-created prototype image for visualizing task performance, CogTool
provides a prototyping utility for designers to draw a new prototype interface. The
QN-MHP and CogTool do not generate results based on CTA.
The new E-GOMSL tool also has three stages to use. The first stage involves defining
visual and non-visual objects. This stage can be considered as a prototyping step. The
concept of this stage is to load an image of interface, which has been created prior to
using the E-GOMSL tool. The designer then defines the visual and non-visual objects
using the prototype image. The second stage in HPM with E-GOMSL is to develop
model code. This stage has two options including using a task flowcharting tool or the
E-GOMSL code editor. The E-GOMSL tool unlike the QN-MHP and CogTool relies on
model simulation.
Figure 2.6 summarizes the steps to use of the QN-MHP, CogTool and the E-GOMSL
tool. By comparison with the modeling method of the QN-MHP, E-GOMSL employs a
task flowcharting tool as a modeling method. There are two steps to develop task
flow-charts with E-GOMGL using a graphical user interface (GUI). First, a designer draws a
high level flow-chart identifying a primary goal and methods. Second, the designer draws
a low level flow-chart including sub-goals and sub-methods. In general, a task analysis
is required as a basis for the designer to use the tool for drawing flow-charts.
By comparison with the modeling method of CogTool, E-GOMSL uses the flowchart
sub-tool as a basis for developing cognitive models. The objective of this function is to
translate task analysis results to E-GOMSL model code for representing human behavior.
With predefined visual/non-visual objects (from the prototyping stage), users are able to
create task flowcharts by dragging-and-dropping objects and selecting actions for objects
from lists associated with each component in a flowchart. The flow chart components are
then directly translated into elements of E-GOMSL model code (i.e., goals, operators,
methods and selection rules).
The new E-GOMSL tool uses the same concept as the QN-MHP modeling approach
to represent variations in user workload when the simulation function is used. In the
QN-MHP tool, a user workload analysis is presented as a time series graph. Thus, designers
can easily understand how cognitive workload changes throughout a task. This approach
is based on Card et al. (1983) research on tracking WM stack counts during GOMS model
analysis. It is also based on Kieras’ (1997a) research on the development of NGOMSL.
With respect to workload analysis, if more than five (5) chunks of information must
be maintained in WM at any given time, the tool predicts cognitive overload and the
of chunks of information in WM, as defined by an operator model, are counted by the
E-GOMSL tool in real-time.
Define project Demonstration Run simulation Select task type Select images (UI Mockup)
Select series of actions
Next steps? Run simulation Y N Defining visual object Defining non-visual object Draw
task flow diagrams Develop model code with GOMSL editor
Run simulation
QN-MHP CogTool EGOMSL Tool
Define interface Next Interface? Y Prototyping Next Interface?
Figure 2.6: Comparison of steps among tools.
In the QN-MHP, when the simulation function is activated, visual objects are
recog-nized by an eye icon on a computer display screen. The eye icon indicates where in the
interface and for how long a user (driver) looks within the simulation model. The eye
icon concept used in the QN-MHP tool was also adapted for the E-GOMSL tool
develop-ment, as pilots rely on visual attention in selecting various buttons, dials, and switches
to perform tasks. Selective attention is directed among these objects for performance.
When the simulation function is used in E-GOMSL, an eye icon appears in the GUI and
moves to object icons and remains sometime to indicate visual behavior (fixations).
shows how long operators work on a task and the duration of use of visual/non-visual
objects. This approach is also useful for representing the frequency of use of operators
such as a button press, key stroke, mouse click, etc. Designers can also identify
relation-ships between visual/non-visual objects and operators. This means designers can gain
insight into information flows during task performance. Moreover, CogTool highlights
the appropriate ACT-R code that is used to represent user behaviors, when one of the
boxes in the Gantt-Chart is selected. The E-GOMSL tool also visualizes the flow of
HIP in task performance. The E-GOMSL visualization tool includes a Gantt-chart of
processing activities (similar to the CogTool output). According to the GOMSL code,
the tool presents a time line of processing in Gantt-chart form, and indicates which
visual/non-visual objects were used.
2.5.3
Classification of Modeling Methods
The QN-MHP uses an iterative model development approach which is straightforward
for designers. After selecting a task type, the designer selects a UI mockup to work with,
object types and action types. Designers work through the UI until the last step, yielding
a PERT chart of the cognitive process. This is a bottoms-up approach to representing
the steps in a complete task. Thus, the designer can obtain a high-level hierarchy of the
task after defining all steps to performance with the system; however, it is not possible
to define an overall task hierarchy in advance.
When developing a cognitive model with CogTool, a user follows a simple method to
identify interface actions to be represented in an ACT-R model. A designer clicks a mouse
on an interface component (e.g., button, textbox, combo-box, etc.), and then chooses an
action for that feature (e.g., “look-at,” “perform,” “type,” etc.). CogTool automatically
etc. This makes it very easy to develop cognitive models by using prototypes. This also
represents a “bottom-up” approach to modeling user behavior in a