Copyright to IJIRSET www.ijirset.com 11621
Computational Study of Fundamental
Frequency of Standard Yorùbá
monosyllabic Utterances
Michael Adébísí Fáy
ẹ̀
míwò
1*and
Ọ
d
ẹ́
túnjí Àjàdí
Ọ
d
ẹ́
j
ọ
bí
11Department of Computer Science and Engineering, Faculty of Technology, Obafemi Awolowo University,
Ile-Ife, Osun State, Nigeria;
*Corresponding Author: [email protected]
Abstract: This paper presents the development and evaluation of a computational model for the fundamental frequency (F0) of Standard Yorùbá (SY) monosyllabic utterances. This was done with a view to approximating the F0 curves on SY syllables in the context of speech applications and other speech technologies.
A list of 39 SY syllables which are the most frequently occurring syllables in Yorùbá newspapers and textbooks was compiled and the speech sound corresponding to the selected SY syllables were recorded for 5 adult native male speakers of SY. The F0 of the speech data were extracted using Praat speech processing package. Thereafter, Least Square Method (using polynomial degree of 1 to 7) was used to design the computational model for the F0 patterns extracted. The computational model was evaluated using the quantitative and the qualitative techniques.
The results showed that the 7th degree polynomial had the lowest RMSE value for monosyllabic speech data. The results of the model showed that polynomials with degree 3 gave a good approximation for monosyllabic.
The study thereafter established the computational and perceptual correlations between the F0 curves and the three Yorùbá tones (High, Mid and Low) for SY monosyllabic utterances. The modeling of F0 contour for Yorùbá tones for bisyllabic utterances and continuous speech are the areas of further research works, in which the principle of this work could be extended.
Keywords: Fundamental Frequency; Standard Yorùbá; Yorùbá tones; F0 curves; Synthesizing F0 pattern.
I. INTRODUCTION
For a tonal language like Yorùbá, tone is an important component of sound because words with the same phoneme sequences may have different meanings if they have different tones, for example, owó (Money) and òwò (Trade). Therefore, tone is one of the most important factors in the SY speech research field in order to make a system which has high intelligibility and naturalness. The tone is indicated by contrasting variations in contour of F0 at the syllabic level.
Yorùbá has 3 lexical tones named: mid (M), low (L), and high (H) and this tone is correlated to F0 pattern on syllables. A Yorùbá syllable with a different tone has a different lexical meaning, thus, to completely recognize a spoken Yorùbá syllable, a speech recognition system needs to recognize a base syllable but also correctly identify the tone. Hence, tone classification of Yorùbá speech is an essential part of a Yorùbá speech recognition system.
Copyright to IJIRSET www.ijirset.com 11622 The result of this research provided a better understanding of the characteristics of F0 curve of SY utterances and the model developed will serve as resource for further research in Yorùbá speech recognition and text-to-speech applications.
II. THE STANDARD YORÙBÁ LANGUAGE (SY)
Yorùbá language (natively èdè Yorùbá) is a tonal language and is a Niger-Congo language spoken in West Africa. Literary Yorùbá, also known as Standard Yorùbá, Yorùbá koiné, and common Yorùbá, is a separate member of the dialect cluster. Standard Yorùbá is the written form of the language, the standard variety learned at school and spoken by newsreaders on the radio. It has three basic but significant tones [5]: high, low, and mid (the default tone).
The Yorùbá alphabet consists of 25 letters and uses the familiar Latin characters. The letters are made up of 18 consonants (b, d, f, g, gb, h, j, k, l, m, n, p, r, s, ṣ, t, w, y) and seven oral vowels (a, e, ẹ, i, o, ọ, u). The consonant ‘gb’ is a diagraph, i.e. a consonant represented with two letters. There are five nasalized vowels in the language (an, en, in, ọn, un) and two pure syllabic nasals (m, n). SY has three phonologically contrastive tones; a high tone represented with an acute accent mark ( ´ ), a mid-tone that is usually left unmarked but in certain circumstances marked with macron (-) and a low tone represented with a grave accent mark ( ` ).
III. LITERATURE REVIEW
Studies in the literature on tone languages e.g. Thai [1] and [2], Mandarin [8] and [7], and Cantonese [4] have shown that tone is an essential feature for a speech unit of syllable. The need for flexible speech modification methods is increasing in both commercial and scientific fields [6] and the method also consists of a fundamental frequency (F0) extraction. Reference [9] proposed a preliminary framework for accounting for certain surface F0 variations in speech and the framework consists of definitions for pitch targets and rules of their implementation. The F0 of voice speech is the most important feature among all of the features known to carry prosodic information. Therefore, F0 is an inherently supra-segmental feature of human speech. The F0 contours of an utterance convey the stress, intonation and rhythmic structures, which determine the naturalness and intelligibility of synthetic speech [1]. As a result, the appropriate modeling of F0 contour plays a significant role in the Thai speech synthesis, the statistical modeling of F0 contour has been conducted by [1] in the implementation of both speaker-dependent and speaker independent systems. Lately, the Fujisaki’s model has been applied within a speaker-independent system as extended modules.
Reference [3] investigated tone realization in continuous utterances in Yorùbá, in which features influencing syllable pitch targets in continuous utterances in Yorùbá were investigated in a small speech corpus of 4 speakers. It was found that the previous syllable pitch level is strongly correlated with pitch changes between syllables and a number of approaches and features were evaluated in this context. The resulting models was used to predict utterance pitch targets for speech synthesizers.
Reference [7] directly compared the mean, standard deviation, and range of the F0 of 4 English and 4 Mandarin speakers (2 males and 2 females each, i.e., a very small sample). The Mandarin speakers, especially the women, had wider F0 ranges and larger standard deviations; the Mandarin women’s mean values were lower, while the men’s were the same as the English. Most notably, the physiological F0 ranges of the speakers, determined from tone sweeps, hardly differed between the two languages, indicating that the English and Mandarin speakers’ voices are comparable. Their use of F0 in single-word utterances was, however, quite different, with the Mandarin speakers having higher maximums and means, and larger ranges, even when only the Mandarin high falling tone was compared with English. In contrast, for a prose passage, the two languages were more similar, differing only in the mean F0, Mandarin again being higher. The study thus contributes to the growing literature showing that languages can differ in their F0 profile, but highlights the fact that the choice of speech materials to compare can be critical. It has also been noted that tone is an essential feature for a speech unit of syllable in Thai. The different tone of a syllable gives the different meanings and this is the same in Yorùbá
language as two words with the same phonemes may have different meanings, e.g., ‘owó’ (Money) and ‘òwò’ (Trade), and this makes modeling of tone in Yorùbá tonal language very crucial in the application of speech processing.
IV. DESCRIPTION OF DATA
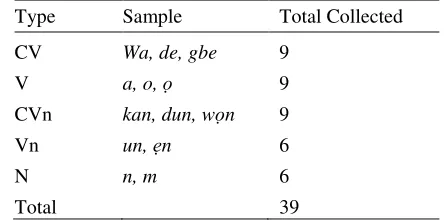
Copyright to IJIRSET www.ijirset.com 11623 3 = 39 monosyllabic words. The 39 words are the most frequently occurring words in selected texts from Yorùbá newspapers and textbooks. To this end, five syllables of monosyllabic types CV, V, CVn, Vn and N were selected. Table
1 shows the syllable types and examples of collected data for monosyllabic data that were used in this study. Each monosyllabic produced three different sounds using the three different tones.
TABLE 1
MONOSYLLABIC TYPES AND SOUND SAMPLES COLLECTED Type Sample Total Collected
CV Wa, de, gbe 9 V a, o, ọ 9 CVn kan, dun, wọn 9
Vn un, ẹn 6
N n, m 6
Total 39
V. MODEL DEVELOPMENT
The program for the least square approximation was written as an M-File in Matlab environment. By using this model, we approximated the F0 extracted for the speech samples using polynomial of degree 1 to 7. The values of the coefficient for polynomials, and RMSE were also calculated. The respective coefficient values for the approximated F0for ‘de’ is shown in Table 2. The RMSE for the approximated F0 are shown in Table 3.
Table 2
Coefficients of The Approximating Polynomial for ‘de’ from Degree 1 to 7
Degree a7 a7 a7 a7 a7 a7 a7 a7
1 1.76E+02 6.94E+01
2 5.94E+02 8.02E+02 8.50E+01
3 3.52E+03 4.97E+03 2.01E+03 3.71E+02
4 4.03E+04 8.86E+03 7.04E+04 2.37E+04 2.98E+03
5 1.36E+05 3.99E+05 4.59E+05 2.57E+05 6.96E+04 7.39E+03
6 1.04E+06 3.14E+06 3.84E+06 2.41E+06 8.18E+05 1.41E+05 9.38E+03 7 8.98E+06 3.42E+07 5.48E+07 4.78E+07 2.46E+07 7.39E+06 1.21E+06 8.23E+03
Table 3 SSE and RMSE for ‘de’
RMSE 1st
261.450 2nd
171.260 3rd
128.240 4th
52.614 5th
41.246 6th
32.639 7th
Copyright to IJIRSET www.ijirset.com 11624
VI. SYNTHESIZING F0 PATTERN
There is a need for the original values of F0 to be replaced by the approximated values of F0 in the speech data. A measure of correctness of the model is necessary in the estimation procedure as well as in testing models. And to achieve this correctness, we replaced the approximated values of F0 into the original speech data. The original speech data was initially manipulated and we extracted the pitch tier from it.
VII. RESULT
The RMSE values of the least square model (1st- 7th degree polynomial) were compared. After a careful study of the curves produced by using the least square approximation model, it was observed that a monosyllabic speech data with a high tone has a high slope, mid tone has a low slope when compared to the high tone while low tone has a negative slope using 1st degree polynomial.
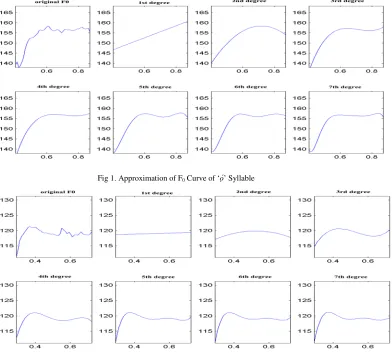
The approximated F0 curves of syllable ọ́, ọ and ọ̀ are shown in Fig 1, 2 and 3 respectively. The coefficients for the resulting linear function are shown in Table 4. A similar pattern is also observed for other monosyllabic syllable as shown in Table 5 for ‘wa’ syllable.
In the experiments, the F0 data were extracted from the recorded speech and functions of the form of the Equations 1, 2, 3, 4, 5, 6 and 7 for degree 1, 2, 3, 4, 5, 6 and 7 respectively, were all fitted into it.
y1= a1x + a0 (1)
y2=a2x2+ a1x + a0 (2)
y3=a3x3+ a2x2+ a1x + a0 (3)
y4=a4x4+ a3x3+ a2x2+ a1x + a0 (4)
y5=a5x5+ a4x4+ a3x3+ a2x2+ a1x + a0 (5)
y6=a6x6+ a5x5+ a4x4+ a3x3+ a2x2+ a1x + a0 (6)
y7=a7x7+ a6x6+ a5x5+ a4x4+ a3x3+ a2x2+ a1x + a0 (7)
The coefficients for ‘wa’ syllable from degree 1 to 7 are shown in Table 7. The parameter a0 is approximately equal to the mean of the raw F0 value and it corresponds to the intercept on the frequency axis (in Hertz). The parameter a1 determines the slope of the F0 line. The F0 curves of syllable ‘o’ is shown in Fig 1, 2 and 3 for high, low and mid tone respectively, representing the line produced for linear, Quadratic, 3rd degree, 4th degree, 5th degree, 6th degree and 7th degree functions. The parameters for the resulting linear function alone are shown in Table 5.
VIII. DISCUSSION
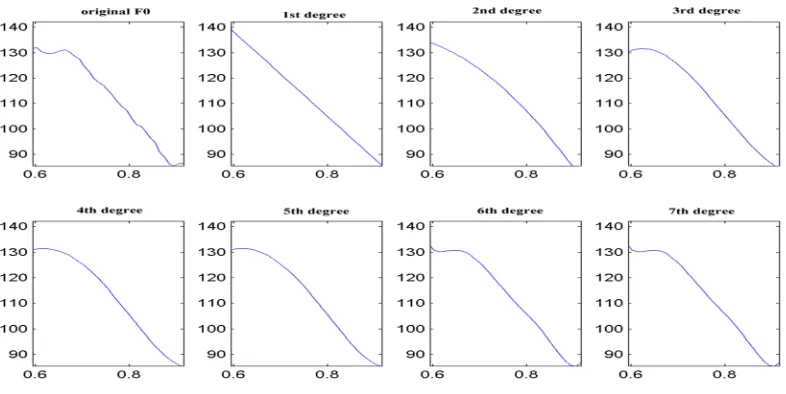
Generally, the high tone has a high positive slope while mid tone has a low positive slope and low tone has a negative slope. Therefore, using first degree polynomial for monosyllabic words, it was observed that a high tone will always have a high slope, mid tone will have a low slope compared to the high tone while low tone will always have a negative slope. For the 3rd order polynomial, the curve fits well into the F
Copyright to IJIRSET www.ijirset.com 11625 Fig 1. Approximation of F0 Curve of ‘ọ́’ Syllable
Copyright to IJIRSET www.ijirset.com 11626 Fig 3: Approximation of F0 Curve of ‘ọ̀’ Syllable
IX. SYSTEM EVALUATION
A measure of correctness of the model is necessary in the estimation procedure as well as in testing models. To achieve this, two evaluation methods were used namely: (i) quantitative and (ii) qualitative evaluations. The quantitative evaluation method was done by finding the Root Mean Square Error (RMSE). The RMSE was calculated as the square root of the standard deviation of the original and approximated F0 values. The RMSE has the advantage of more accurately reflecting the performance of the stylization function with respect to the actual value in the acoustic signal.
A. Quantitative Evaluation
The results in Table 3 showed that the approximated values were getting close to the original extracted F0 as the degree of approximation function increases. The RMSE from degree 1 to 7 were calculated and the result is shown in Table 6 for ‘wá’ sound. It was clearly observed from Table 6 that 7th degree polynomial has the lowest RMSE. This trend was also observed in the approximation of the other speech samples. This result therefore quantitatively shows that 7th degree polynomial is best suitable to approximate monosyllabic of SY utterances since RMSE values continue to fall as the degree of the polynomial increases. This clearly shows that the higher the degree of the polynomial used for approximation, the better the accuracy.
Copyright to IJIRSET www.ijirset.com 11627 COEFFICIENT FOR LINEAR FUNCTION OF F0 CURVE FOR ‘Ọ’ SYLLABLE
a1 a0
H 29.8730 134.6700 M 1.6928 118.1500 L -167.7200 238.9800
TABLE 5
COEFFICIENT FOR LINEAR FUNCTION OF F0 CURVE FOR ‘WA’ SYLLABLE
a1 a0
H 115.7700 71.7010 M 30.9180 115.4000
L -46.1140 156.4600
TABLE 6
RMSE FOR ‘WÁ’ (HIGH TONE) RMSE 1st
76.5270 2nd
51.3140 3rd
41.5290 4th
16.5730 5th
5.9826 6th
4.2978 7th
4.0220
TABLE 7
COEFFICIENTS FOR ‘WÁ’ FROM DEGREE 1 TO 7
degree a7 a6 a5 a4 a3 a2 a1 a0
1 1.15E+02 7.17E+01
2 4.23E+02 7.80E+02 1.83E+02
3 2.63E+03 5.77E+03 4.01E+03 1.03E+03
4 4.23E+04 1.36E+05 1.61E+05 8.34E+04 1.61E+04
5 2.80E+05 1.14E+06 1.84E+06 1.48E+06 5.90E+05 9.32E+04
6 1.14E+06 5.63E+06 1.16E+07 1.26E+07 7.70E+06 2.50E+06 3.35E+05 7 4.71E+06 2.70E+07 6.62E+07 8.99E+07 7.32E+07 3.56E+07 9.61E+06 1.11E+06
Copyright to IJIRSET www.ijirset.com 11628 Quantitative evaluation was performed on stylization functions corresponding to the 1st, 2nd, 3rd, 4th, 5th, 6th and 7th degree polynomials. Nine adult native speakers of SY in Obafemi Awolowo. University Ile-Ife (students with age ranging between 19 and 35 years) were invited. To ascertain their understanding of SY, some recorded natural speech sounds were played to them and they were asked to write down what they heard. Those who were unable to produce 100% accuracy in this test were excluded from the evaluation process. In the end, five of the speakers participated in the qualitative evaluation. For the intelligibility test, 28 monosyllabic words with the approximated F0 curves were played to the listeners. The syllables were selected to reflect phonetic balance in the tests data and the volunteers had no prior knowledge of the syllables that were played. After a speech sound was played, the listeners were asked to write down what he or she heard. The results for 1st, 2nd, 3rd, 4th, 5th, 6th and 7th degree polynomials are as recorded in Table 8.
TABLE 8
MEAN % INTELLIGIBILITY OF SY SYLLABLES WITH STYLIZED F0 CURVE
degree1 Degree2 Degree3 Degree4 Degree5 Degree6 Degree7
Monosyllabic 80 85 90 100 100 100 100
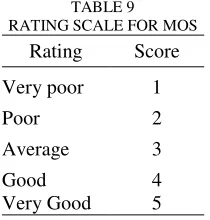
To conduct the naturalness test, the monosyllabic and bisyllabic words with the original F0 curve and the corresponding ones with modified F0 curve were played at random. In this test, the listeners were asked to rank the quality of what they heard on a scale of 1 (very poor) to 5 (very good). The scale is as shown in Table 9.
The result from the naturalness test for monosyllabic are shown in Table 10 For monosyllabic words, polynomial of degree 1 has mean of 40% which is rated as poor, this implies that polynomial of degree 1 is poor for approximating the F0 values. However, polynomial of degree 2 gave a mean value of 64% which is also rated as average according to the ranking scale. Average is not good enough in speech synthesis if there is still a room for better performance. Polynomial of degree 3 gave us mean value of 76% which is ranked as good in the ranking scale. This shows that polynomial of degree 3 can give a good approximation according to human hearing ability. Degree 4, 5, 6 and 7 gave 92%, 92%, 96% and 100% respectively in which they are all ranked as very good using the ranking scale.
TABLE 9 RATING SCALE FOR MOS
Rating Score
Very poor 1
Poor 2
Average 3
Good 4
Copyright to IJIRSET www.ijirset.com 11629 TABLE 10
RESULT OF NATURALNESS TEST FOR ‘WÁ’
Degree Listener Mean % Rating
L1 L2 L3 L4 L5
1 1 3 1 3 2 40 2
2 2 4 3 3 4 64 3
3 4 4 3 3 5 76 4
4 5 4 4 5 5 92 5
5 4 5 5 4 5 92 5
6 5 5 5 4 5 96 5
7 5 5 5 5 5 100 5
X. CONCLUSION
The modeling of F0 contour for Yorùbá tones has been presented in this paper. The results have shown that a 3rd degree polynomial is adequate for modeling the F0 curves on Yorùbá monosyllabic speech data. We are therefore able to establish the computational and perceptual correlations between the F0 curves and the three Yorùbá tones for SY monosyllabic utterances. The result of this research will provide a better understanding of the characteristic of F0 of SY utterances and the models developed can serve as resources for Yorùbá speech recognition systems, text-to-speech systems and other speech related applications. However, modeling of F0 contour for Yorùbá tones for bisyllabic, words and continuous speech are the area of further research work, in which the principle of this work could be extended.
ACKNOWLEDGEMENTS
We would like to thank the people of Computing and Intelligent Systems Research Group (CISRG), in the Department of Computer Science and Engineering, Obafemi Awolowo University, Ile-Ife, Nigeria, for the invaluable support towards the successful completion of this research.
REFERENCES
[1]Chomphan, S., “Modeling of Fundamental Frequency Contour of Thai Expressive Speech using Fujisaki’s Model and Structural Model”. Journal of Computer Science, 7 (8):1310–1317, 2011.
[2] Chomphan, S.,. “A Control of Fundamental Frequency Contour for Hidden Markov Model-Based Thai Speech Synthesis”. American Journal of Applied Sciences, 9 (2):259–264, 2012.
[3] Daniel R., Niekerka, V., Barnard, E.“Predicting utterance pitch targets in Yorùbá for tone realisation in speech synthesis”. Speech Communication (Elsevier). Volume 56, Pages 229–242. 2014.
[4] Gu, W., Fujisaki, H., Hirose, K..“Analysis of Fundamental Frequency Contours of Cantonese Based on a Command-Response Model”. SSW5. The University of Tokyo, Shanghai Jiaotong University, pp. 1069–1072, 2011.
[5] Hombert, J.M..“Consonant Types, Vowel Height and Tone in Yoruba”. Studies in African Linguistics, 8(2):173–190, 1977.
[6] Kawahara, H., Katsuse, I.M., Cheveign, A.“Restructuring speech representations using a pitch-adaptive time-frequency smoothing and an instantaneous-frequency based F0 extraction: Possible role of a repetitive structure in sounds”. Speech Communication (Elsevier). 27, pp 187-207, 1999.
[7] Keating, P., Kuo, G.“Comparison of Speaking Fundamental Frequency in English and Mandarin”. The Journal of the Acoustical Society of America, 132 (2), 1050, 2012. [8] Liu, S., Doyle, S., Morris, A., Ehsani, F. “The Effect of Fundamental Frequency on Mandarin Speech Recognition”.In Proc. of ICSLP, volume 6, pages 2647–2650,
Sydney, Australia, 1998.