STUDY ON ULTIMATE STRENGTH OF THIN-WALL PIPING
COMPONENTS FOR FAST BREEDER REACRORS UNDER SEISMIC
LOADING
Tomoyoshi Watakabe1, Seiji Kitamura2, Kazuyuki Tsukimori3, and Masaki Morishita3
1 Researcher, Structural Reliability Group, JAEA, Ibaraki, Japan ([email protected]) 2 Principal Researcher, Facility Maintenance Engineering Section, JAEA, Fukui, Japan
3 Principal Researcher, Advanced Nuclear System Research and Development Directorate, JAEA, Ibaraki,
Japan
ABSTRACT
It is important to confirm failure modes and safety margin until ultimate strength of piping components from the point of view of seismic safety. Though, many dynamic failure tests of the thick-wall piping components for Light Water Reactors (LWRs) have been performed, there are little dynamic failure test data of the thin-wall pipe for Fast Breeder Reactors (FBRs). This paper presents a series of dynamic failure tests of thin-wall elbows with the diameter/thickness ratio close to that of the main piping of FBRs and discusses about vibration characteristics in elastic-plastic region, failure modes under dynamic load and the results of piping design evaluation for the test model. Moreover, the test results were compared to the Finite Element Analysis (FEA) results.
INTRODUCTION
In Japan, large earthquakes exceed design earthquake occurred sometimes, such as Pacific Coast of Tohoku earthquake in 2011. It is important to confirm failure modes and safety margin until ultimate strength of piping components from the point of view of seismic safety. Many dynamic failure tests of the thick-wall piping components for Light Water Reactors (LWRs) have been performed [1-5]. According to these studies, it was shown that almost of the thick-wall piping failure mode under seismic loading were low cycle fatigue. However, there are little dynamic failure test data of the thin-wall pipe for Fast Breeder Reactors (FBRs).
This paper presents a series of dynamic failure tests of thin-wall elbows with the diameter/thickness ratio near the main piping of FBRs and discusses about vibration characteristics in elastic-plastic region, failure mode under dynamic load and the results of piping design evaluation for the test model. Moreover, validation of dynamic elastic-plastic analyses was performed by compared with test results.
SHAKING TABLE TEST
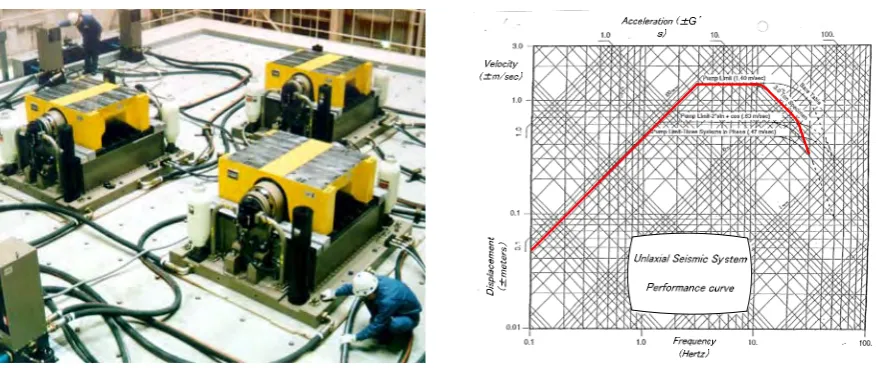
Shaking Table
Figure 1. Shaking table. Figure 2. Performance curve of the shaking table.
Table 1: Basic performance of the shaking table.
Table number Triple table
Table size 1.1 x 1.3 m
Shaking direction Horizontal unidirectional
Maximum payload 3 ton
Maximum Acceleration 10 G (At maximum payload) Maximum velocity 2 m/s (At maximum payload)
Maximum displacement 75 mm
Test Model
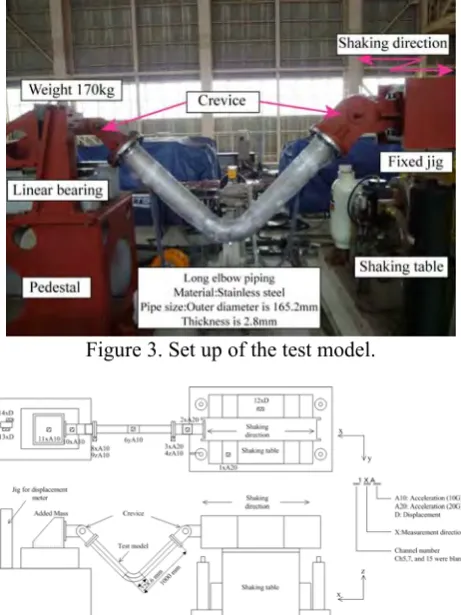
Figure 3 and 4 show the test model setup on the shaking table and a schematic drawing of the test model, respectively. The test model was a long elbow piping model consisting of 2 straight pipes, 1 long elbow, and 1 weight of 170 kg. Material of the piping was made of an austenitic type 304 (stainless steel), and the outer diameter and the thickness were 165.2 mm and 2.8 mm, respectively. One end of the test model was fixed to the shaking table using the crevice (Deformation except rotation of y direction was constrained), and the weight (170kg) was fixed at another end of the test model by the crevice. Linear bearing was fixed under the weight to allow the displacement to only excitation direction (x). Therefore, when the test model is excited, the in-plane bending moment is imposed by an inertia load of the weight. Since the pressure of FBRs was very low compared to LWRs, the pressure wasn’t added to test model. Although the test model wasn’t scale model of actual piping, the diameter/thickness ratio of the test model 59 was chosen as to be closer to that of the main piping of FBRs (73.2). The frequency and damping ratio of the test model in elastic region were approximately 5.7 Hz and 3.0 %, respectively. It was considered that main factor of damping was friction of linear bearing.
Input Condition
Division IX (include assigned division number from I to X)
the table in the test number LE1-9, and the acceleration response spectrum with 0.5% damping ratio of the actual data and that of the target wave.
Figure 5 showed that the vibration characteristic of the table was comparable to the target wave. A difference was observed in the high frequency range more than 10 Hz. It was considered as reason that the friction at sliding part of shaking table in the test affected. However, there wasn’t significant effect on the response of the test model, since the test model frequency is lower (1st. mode: 5.7 Hz).
Measurement
As shown in Figure 4, accelerations of the shaking table, the test model and the weight, strains at the outer surface on elbows, and displacements of the shaking table and the weight were all recorded. Accelerations and displacements in the shaking direction (x) were mainly measured. Test data were recorded with a sampling frequency of 500 Hz. Processing the test result, data were filtered by a low pass at 50 Hz, and were reduced to a sampling frequency of 250 Hz.
Test Conditions
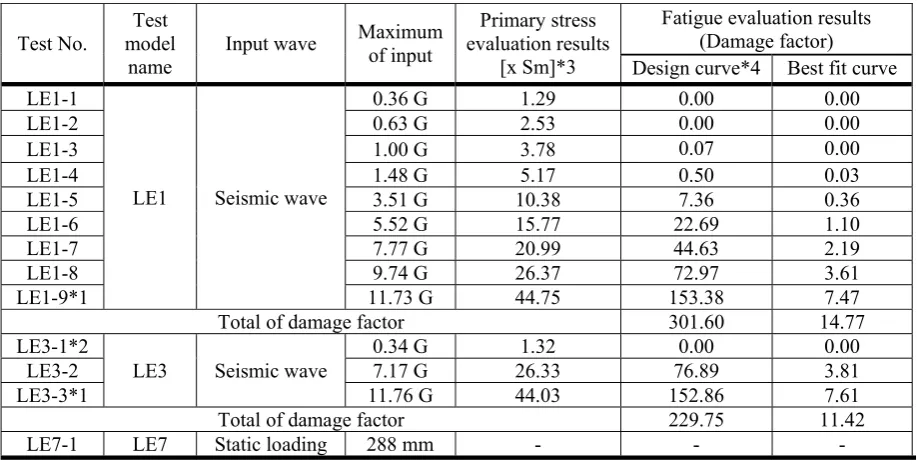
A Series of tests summarized in Table 2 was performed. In these tests, the test model was excited by the seismic waves which were adjusted several sets of magnifications: LE1 was excited as to enlarge magnification of input at each shaking condition, and LE3 was excited by maximum input within the performance of one shaking table. Both tests were continued until crack was observed on the outer surface at the crown part of the elbow. Static loading test was also performed to obtain the relation between displacement and load at static. The maximum displacement between both ends of the test model at elbow close was 288 mm.
Figure 3. Set up of the test model.
-12 -6 0 6 12
0 10 20 30 40 50 60 70 80 90 100
Ac
ce
le
ra
tio
n [G]
TIME [s]
LE1-9 Test
0 20 40 60 80
0 5 10 15 20
R
es
pons
e a
cc
.
[G
]
Frequency [Hz]
LE1-9 Test LE1-9 Target
ζ = 3 %
Figure 5. Comparison between the test data and the target wave.
Table 2: Test conditions and design evaluation results.
Test No. model Test name
Input wave Maximum of input evaluation results Primary stress [x Sm]*3
Fatigue evaluation results (Damage factor) Design curve*4 Best fit curve LE1-1
LE1 Seismic wave
0.36 G 1.29 0.00 0.00
LE1-2 0.63 G 2.53 0.00 0.00
LE1-3 1.00 G 3.78 0.07 0.00
LE1-4 1.48 G 5.17 0.50 0.03
LE1-5 3.51 G 10.38 7.36 0.36
LE1-6 5.52 G 15.77 22.69 1.10
LE1-7 7.77 G 20.99 44.63 2.19
LE1-8 9.74 G 26.37 72.97 3.61
LE1-9*1 11.73 G 44.75 153.38 7.47
Total of damage factor 301.60 14.77
LE3-1*2
LE3 Seismic wave
0.34 G 1.32 0.00 0.00
LE3-2 7.17 G 26.33 76.89 3.81
LE3-3*1 11.76 G 44.03 152.86 7.61
Total of damage factor 229.75 11.42
LE7-1 LE7 Static loading 288 mm - - -
*1 Crack was observed on the outer surface at the crown part of the elbow
*2 This excitation was performed to investigate frequency and damping ratio of test model LE3 in elastic region.
*3 Primary stress was normalized by design stress intensity, Sm. Sm of the material was 137 MPa, according to the design code [7].
*4 Damage factor were calculated by multiplying it of the best fit curve to 20 in case peak stress exceed the design curve.
Test Results
Division IX (include assigned division number from I to X)
maximum response displacement of test model LE1 at each excitation. In Figure 7, the responses which were calculated by the floor response spectrum analysis (FRS analysis) were also shown. Beam model was used as analysis model, and floor response spectrum 3% (the damping ratio of test model in elastic region) of acceleration on table was used as input. Since acceleration of table in high level excitation was higher than it of the target wave, the responses of test increase in region beyond input acceleration 8G, and the responses of FRS analysis didn’t proportional to input acceleration in Figure 7. As shown in Figure 6, natural frequency increased and damping ratio decreased with the increase of excitation level. This was resulted from degradation of test model stiffness and increase of hysteresis damping dissipation due to expanse of plastic region in the test model. As shown in Figure 7, the response acceleration and response displacement were small compared to FRS analysis result assuming linear indicated by solid and dotted lines due to same reason. Though the damping ratio of the test model was about 3 % in elastic region, the damping ratio was approximately 17 % when the test model actually fractured. Since the energy is dissipated due to hysteresis damping in high level excitation, the piping response supposed to decrease. Therefore, considering the effect of plasticity, it will be possible to reduce the response.
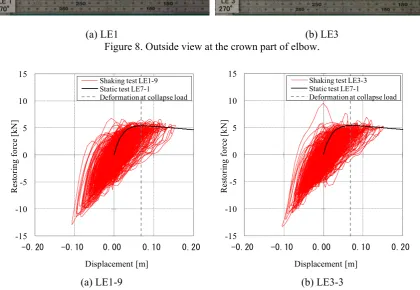
Figure 8 shows the picture of elbow after the completion of the test of LE1 and LE3. Figure 9 shows restoring characteristic relationship by the displacement of the weight and the load obtained by multiplying the acceleration of the weight to the weight (170 kg) in LE1-9 and LE3-3, and the restoring characteristic relationship which is obtained by the static loading test LE7-1. As shown in Figure 8, the cracks are observed in the axial direction caused by local bending at both crown parts of elbow. Though local ratchet and local dent near the crack was observed, the rapid collapse like loss of the structural strength didn’t occur. Failure mode seemed to be low cycle fatigue. Crack at welding line wasn’t observed by visual check. As shown in Figure 9, maximum restoring force of shaking test was comparable to maximum restoring force of static test, and the change of maximum restoring force by the difference of dynamic inertia load and static load wasn’t confirmed. Although the deformation by shaking test exceeded that 0.068 m at collapse load, the behavior of restoring force was stable and the excessive increase of deformation wasn’t also confirmed.
Figure 10 shows the change of the section shape near the center of elbow. The distance between 90 and 270 degree in post-failure increased about 10 % comparing to the initial diameter, and the distance between 0 and 180 degree in post-failure decreased about 2 % comparing to the initial diameter. From this result, drastic decrease of the section area wasn’t found.
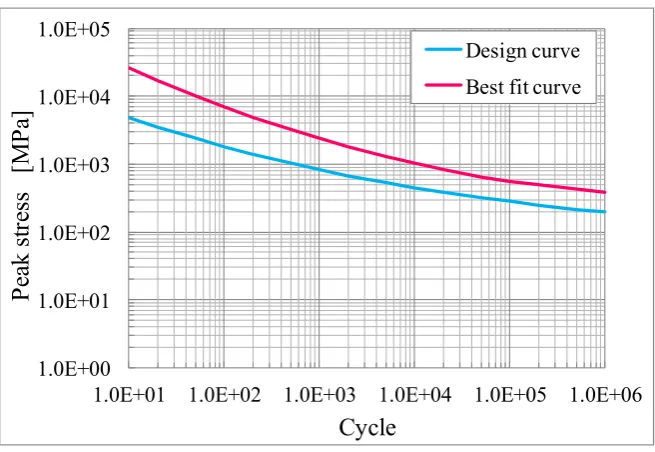
Primary stress evaluation to prevent unstable failure and fatigue evaluation to prevent fatigue failure of the test model were performed to confirm the margin of design [6]. The primary stress was calculated by Equation 1. FRS analysis with beam model was performed to calculate the moment of Equation 1, and the floor response acceleration in damping ratio 3% on table was used as input. The damage factor was calculated based on Miner’s rule using the peak stress time history, which was obtained by Equation 2 and modal time history analysis (the beam model and acceleration data of table as input was used), and the fatigue curve in Figure 11. The results of design evaluation were shown in Table 2. The primary stress in excitation level of the tests corresponding to failure was 44xSm, and it was approximately 14 times higher than allowable stress 3xSm. However, unstable failure didn’t occur. In addition, the total of the damage factor based on design curve was 295 in LE1 and 190 in LE3, and that was so larger than fatigue limit 1. The damage factor based on the best fit curve was also larger than the fatigue limit. From these results, it was confirmed that primary stress evaluation and fatigue evaluation of thin-wall piping had large margin. As the reason, it was considered that the plastic effect of model wasn’t considered in seismic design. Also, the fatigue curve and the design equations may have the large margin.
i is
n B M Z
S 2 (1)
2 )
( 2 2 is i
e
l K K C M Z
S (2)
n
0 4 8 12 16 20 24 0.0 1.0 2.0 3.0 4.0 5.0 6.0
0 2 4 6 8 10 12
D am pi ng r at io [% ] F re que nc y [ Hz ]
Maximum input acc. [G]
Frequency Damping ratio
Failure 0 40 80 120 160 200 0 2 4 6 8 10
0 2 4 6 8 10 12
M ax imu m r es po ns e di sp . [mm] M ax imu m r es po ns e acc. [ G ]
Maximum input acc. [G]
Res. acc.
Res. acc. in FRS analysis Res. disp.
Res. disp. in FRS analysis Failure
Figure 6. Change of frequency and damping ratio Figure 7. Change of maximum response acceleration of the test model LE1. and maximum response displacement of the
test model LE1.
(a) LE1 (b) LE3 Figure 8. Outside view at the crown part of elbow.
-15 -10 -5 0 5 10 15
-0.20 -0.10 0.00 0.10 0.20
R es tor in g f or ce [ kN] Displacement [m]
Shaking test LE1-9 Static test LE7-1
Deformation at collapse load
-15 -10 -5 0 5 10 15
-0.20 -0.10 0.00 0.10 0.20
R es tori ng for ce [kN ] Displacement [m]
Shaking test LE3-3 Static test LE7-1
Deformation at collapse load
(a) LE1-9 (b) LE3-3 Figure 9. Restoring characteristic relationship.
Crack and local ratchet
Division IX (include assigned division number from I to X)
-100 -80 -60 -40 -20 0 20 40 60 80 100
-100 -80 -60 -40 -20 0 20 40 60 80 100 Initial (before LE1-1 shaking) Post-failure (after LE 1-9 shaking)
0° Intrados
90° Crown
180° Extrados
270° Crown
-100 -80 -60 -40 -20 0 20 40 60 80 100
-100 -80 -60 -40 -20 0 20 40 60 80 100 Initial (before LE 3-1 shaking) Post-failure (after LE 3-3 shaking)
0°
90°
180°
270°
(a) LE1 (b) LE3 Figure 10. Cross section shape near the center section of the elbow.
1.0E+00 1.0E+01 1.0E+02 1.0E+03 1.0E+04 1.0E+05
1.0E+01 1.0E+02 1.0E+03 1.0E+04 1.0E+05 1.0E+06
P
ea
k st
re
ss
[M
P
a]
Cycle
Design curve Best fit curve
Figure 11. Fatigue curve of austenitic type 304 stainless steel [8].
VALIDATION OF ANALYSIS BY TEST RESULTS
The validation of the analysis was carried out by comparing the dynamic response obtained by analysis with the excitation test. FEA model was shown in Figure 12 and analysis conditions were shown in Table 3. Dynamic large displacement elastic-plastic analysis was performed for LE1-9 test condition by using bi-linear material characteristic. The material parameters were decided from the stress-strain relationship which was obtained by the monotonic tensile test of the same material as that of test model, as shown in Figure 13: yield stress and strain-hardening coefficient were determined so as to be
0° Intrados
180° Extrados
270° Crown 90°
Crown
0° Intrados
180° Extrados
270° Crown 90°
equivalent energy of stress-strain relationship of test and energy of bi-linear model below strain 6 % (maximum strain in the data which was obtained by test).
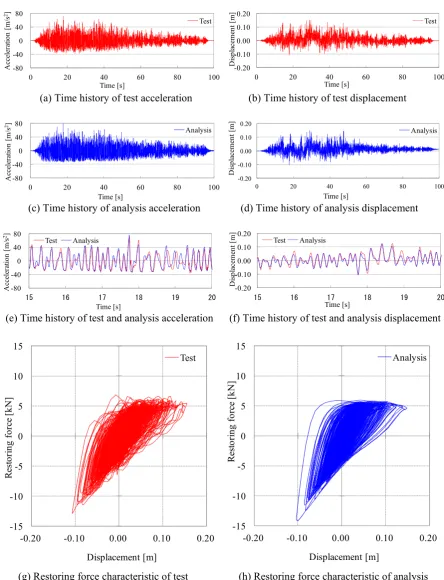
Figure 14 shows the time history of acceleration and time history of displacement at mass, and restoring characteristic. Acceleration and weight were multiplied to obtain load of restoring characteristic of the test. It was confirmed that the test results agreed with the analytical results between close side and open side. Therefore, it was demonstrated that the dynamic behavior of the thin-wall pipe could be simulated by the elastic-plastic FEA. In future, analyses of another test conditions should be performed and further validation of the analysis is required.
0 100 200 300 400 500
0 1 2 3 4 5 6
St
re
ss
[N
/m
2]
x10
6
Strain [%]
Monotonic tensile test Bi-Linear model
Figure 12. FEA model. Figure 13. Stress-strain relation of tensile test and bi-linear.
Table 3: Analytical condition.
FEA code FINAS Ver. 21.0 RC [8]
Kind of analysis Dynamic large displacement elastic-plastic analysis
Element Piping: Shell (QFLA4S) Flange, crevice and end of pipe: Beam (Beam2) Weight: Added mass 170 kg
Input condition Acceleration data on table
Analytical condition Solving: Newmark
βmethod Time step: 0.002 s
Damping : Stiffness proportional damping (3 % at 1st mode)
Boundary condition
Node excited: Rotation of z direction wasn’t only constrained Node added mass: Rotation of z direction and translation of x direction wasn’t constrained
Geometry Piping: Design drawing size
Material property
Piping (Stainless steel) : Kinematic hardening rule, Bi-linear Young modulus E: 1.9211E11 N/m2
Poisson’s ratio ν: 0.26 Density ρ: 8.03E3 kg/m3 Yield stress σy: 2.75E8 N/m2
Strain-hardening coefficient: 1.69E9 N/m2
Flange, crevice and end of pipe: These are assumed to be rigid body Piping:
Shell element
Added mass 170 kg Shaking
Rigid beam was installed to be bound the deformation at end of pipe
Division IX (include assigned division number from I to X) -80 -40 0 40 80
0 20 40 60 80 100
A ccel er at io n [ m /s 2] Time [s] Test -0.20 -0.10 0.00 0.10 0.20
0 20 40 60 80 100
D is placem en t [ m ] Time [s] Test
(a) Time history of test acceleration (b) Time history of test displacement
-80 -40 0 40 80
0 20 40 60 80 100
A cceler ati on [ m /s 2] Time [s] Analysis -0.20 -0.10 0.00 0.10 0.20
0 20 40 60 80 100
D is placem en t [ m ] Time [s] Analysis
(c) Time history of analysis acceleration (d) Time history of analysis displacement
-80 -40 0 40 80
15 16 17 18 19 20
Ac ce le ra tion [m /s 2] Time [s] Test Analysis -0.20 -0.10 0.00 0.10 0.20
15 16 17 18 19 20
Di sp la ce m en t [ m ] Time [s] Test Analysis
(e) Time history of test and analysis acceleration (f) Time history of test and analysis displacement
-15 -10 -5 0 5 10 15
-0.20 -0.10 0.00 0.10 0.20
R es tori ng f orc e [kN ] Displacement [m] Test -15 -10 -5 0 5 10 15
-0.20 -0.10 0.00 0.10 0.20
R es to ri ng fo rc e [k N] Displacement [m] Analysis
(g) Restoring force characteristic of test (h) Restoring force characteristic of analysis
CONCLUSION
A series of dynamic failure tests and FEA were performed. The followings were obtained throughout the tests and the analyses.
(1) The response of the test model in high level excitation decreased due to the effect of plasticity compared to the response of FRS analysis.
(2) Although local ratchet and local dent near the cracks were confirmed, the rapid collapse like loss of the structural strength didn’t occur, and the failure mode seemed to be low cycle fatigue.
(3) Although the deformation by shaking test exceeded the deformation at collapse load, the behavior of restoring force was stable, and the excessive increase of deformation wasn’t confirmed.
(4) The primary stress evaluation results and the fatigue evaluation results in the test calculated based on design of piping showed that the design of thin-wall piping had large margin.
(5) It was confirmed that the test results agree with analytical results. Therefore, it was demonstrated that the dynamic behavior of the thin-wall pipe could be simulated by the dynamic large displacement elastic-plastic FEA.
ACKNOWLEDGMENTS
The authors would like to gratefully acknowledge Mr. Sumio Kobayashi and Mr. Shinichi Hasebe of Japan Atomic Energy Agency, Mr. Akihiko Uehara and Mr. Kenji Abe of Tohkou Machine Industry Corporation supported the test. Also, the authors greatly appreciate Mr. Hideki Takahashi of IX Knowledge Inc. contributed to simulation analysis.
REFERENCES
[1] Suzuki, K., Namita, Y., Abe, H., Ichihashi, I., Suzuki, K., Ishiwata, M., Fujiwaka, T. and Yokota, H., “Seismic Proving Test of Ultimate Piping Strength (Current Status of Preliminary Tests -II)”,
ICONE-10, 2002.
[2] Suzuki, K., Namita, Y., Abe, H., Ichihashi, I., Suzuki, K., Ishiwata, M., Fujiwaka, T., and Tai, K., “Seismic Proving Test of Ultimate Piping Strength (Test Results on Piping Component and Simplified Piping System)”, ASME-PVP, 2002.
[3] Suzuki, K., Abe, H., and Suzuki, K., “Seismic Proving Test of Ultimate Piping Strength (Ultimate Strength Test)”, ASME-PVP, 2004.
[4] Nakamura, I., Otani, A., Sato, Y., Takada, H., Takahashi, K., and Shibutani, T., “Investigation of Seismic Safety Capacity of Aged Piping System Shaking Table Test on Piping Systems With Wall Thinning by E-Defense”, ASME-PVP, 2011.
[5] Otani, A., Nakamura, I., Takada, H., and Shiratori, M., “Consideration on Seismic Design Margin of Elbow in Piping”, ASME-PVP, 2011.
[6] Seismic Design Standard in Nuclear Facilities for Sodium Cooling Type Fast Breeder Reactor Plants, Science and Technology Agency Nuclear Safety Bureau in Japanese, 1984.