ISSN: 2319-8753
I
nternational
J
ournal of
I
nnovative
R
esearch in
S
cience,
E
ngineering and
T
echnology
(An ISO 3297: 2007 Certified Organization)
Vol. 3, Issue 2, February 2014
SMART MAPS BASED ON GPS PATH
LOGS
M. Monica Bhavani
1, K. Uma Maheswari
2P.G. Student, Pervasive Computing Technology,University College of Engineering (BIT CAMPUS), Trichy,
Tamilnadu, India1
Assistant Professor, Department of CSE, University College of Engineering (BIT CAMPUS), Trichy,
Tamilnadu, India2
Abstract - Geographic information from the global positioning system (GPS) logs of taxi cabs are useful in the novel applications like Smart Maps needed for a city traffic. The historical path logs of the GPS trajectories are mined to provide the landmark graph. Based on the landmark graph and the routing algorithm that uses the variance-entropy based clustering techniques to build and evaluate the system to find the routes in urban areas. Using this system, the road is segmented based on the real world GPS trajectories and a route is evaluated based on the developed landmark graph. This model is used to predict the traffic conditions of the future time. The proposed system is to provide the travelling time, distance and the available number of trajectories between every source and destination in order of predicting an optimised route. On average, 50% of our routes are at least 20% faster than the competing approaches.
Keywords – logs, mapping, route,landmark, GPS trajectory, routing database. I. INTRODUCTION
Determining the efficient driving directions has known become a daily activity and been implemented as a key feature in many mapping services in maps like Google and Bing. A fastest driving route save not only the time of a driver but also the energy consumption (as most gas is been wasted in traffic jams). Thereafter, this service is more important for both end users & government aiming to ease the traffic problems to protect environment. Essentially, the time that a driver traverse a route depend on the following aspects:The physical features of the routes, such as distance, capacity (lanes), and the number of traffic light as well as direction turn.A time-dependent traffic flows on the route A user’s driving direction behaviour.
ISSN:2319-8753
I
nternational
J
ournal of
I
nnovative
R
esearch in
S
cience,
E
ngineering and
T
echnology
(An ISO 3297: 2007 Certified Organization)
Vol. 3, Issue 2, February 2014
A cloud based cyber physical systems for computing is needed for a practically fastest route for particular user, using large number of GPS equipped taxi cabs and the users GPS enabled phone. Firstly, GPS enabled taxi cabs are used as mobile sensors probing the traffic of a city in the physical world. Secondly, a cloud in the cyber world is built to aggregate & mine the information from taxi cabs as well as other sources from web, like web maps and weather forecast. The mined knowledge include the intelligent of taxi cabs drivers in choosing the driving directions and traffic patterns on road surfaces. Thirdly, the knowledge in cloud is used in turn to serve the web users and ordinary drivers in the physical world. Finally, mobile clients, typically running in an user’s GPS-phone, accepts user’s query, communicate with the cloud, and present the result to the user. The mobile clients gradually learns the user’s driving behaviour from the user’s driving routes (recorded as GPS logs), and supports cloud to customize practically fastest route for the user. The proposed notion of a time-dependent landmark graph, which well models the intelligent of taxi cabs drivers based on the taxi cab trajectory.
We devise a Variance-Entropy Based Clustering (VE-Clustering) method to learn the density and the time variance distribution of the travel time between any two landmarks. In this extension work, the further improved routing service self adaptively learns the driving behaviours of both the taxi cabs drivers and the end users so as to provide personalized routes to users. The presented smoothing algorithms for removing the roundabout part of the original rough route c. The built improved system using a real world trajectory data set generated by 33,000 taxi cabs in a period of three months, and evaluates the system by conducting both synthetic experiments and in field evaluations (performed by real drivers).The result shows that proposed method can effectively and efficiently find out practically better routes than the competing methods directly using the inferred real-time traffic condition in routing algorithm could not find the practically fastest path effectively due to following reasons:
i). The inferred real time traffic information could be inaccurate given the insufficient samples from a short time interval. For example, the inferred speed of many service roads & streets (without enough sensors) are not very precise. However, our method using the traffic patterns learned from the long-term historic data is more robust to the sparse data.
ii). The essentially needed information for means of computing the practically fastest route is the traffic conditions on a road segment at a future time when the road is actually driven. Using the snapshot of the traffic conditions (on road segments), which maintains the same states of the time when a route is computed, could not be feasible.
II. RELATED WORK
From [3] the datasets are collected from the GPS equipped taxi cabs with the routing information. The trajectory involves arc skipping process in the case of the real datasets. The real datasets can be simulated in order to provide a synthetic datasets.
A novel pattern termed IVMM [4] employs a voting based approach to reflect the mutual influence of the sampling points. Both for low sampling rate data and high sampling rate data, the correct matching percentage of
IVMM pattern is higher than ST Matching pattern
.
Most existing systems compute fastest paths based on roadEuclidean distance and a small set of predefined road speeds. They presented an adaptive fastest path [12] pattern capable of efficiently accounting for important driving and speed patterns mined from a large set of traffic data.
The transportation mode, such as walking, driving, etc., implied in a users GPS data [10] can provide us valuable knowledge to understand the user. The change point based segmentation method was compared with two baselines including uniform duration based and uniform length based methods.
This is to identify the human behaviour and understanding type of mobility of user based on the GPS logs that have been upgraded and it is obtained [11] only from the historical GPS logs. The work leads to sophisticated features based on the conditions of city traffic and post processing pattern on graphical basis in order to improve the performance of the inference model.
ISSN:2319-8753
I
nternational
J
ournal of
I
nnovative
R
esearch in
S
cience,
E
ngineering and
T
echnology
(An ISO 3297: 2007 Certified Organization)
Vol. 3, Issue 2, February 2014
Driving system [1] that it relies on the historical GPS dataset generated by over 33,000 taxis in a period of
three months, to present the algorithm to compute the fastest path for a given destination and departure time. Patterns
for finding the shortest path and the minimum delay under some various waiting constraints are presented and the properties of the derived path are investigated. It is shown that if the departure time from the source node is unrestricted.
III. PROBLEM STATEMENT
A fast driving route saves not only the time of driver but also the energy consumption (as most gas has been wasted in traffic jams). The problem statement gives the challenges that are faced in this work. Some of them are given below.
i). That is it can’t answer any user query by directly mining trajectory pattern from data. Thereafter, how to model taxi drivers intelligence can answer a variety of queries is a challenge.
ii). It can’t guarantee there are sufficient no. of taxis traversing on every road segments even if it has large number of taxis.
iii). That is it can’t estimate accurately the speed pattern of every road segment. A. Intelligent modelling
As users can select a place as source or destination, there would be no taxi cabs trajectory exactly passing the query points. That is, we cannot answer any user query by directly mining trajectory pattern from the data. Therefore, how to model the taxi cabs drivers intelligent is used to answer a variety of queries is a challenge.
B. Data sparseness and coverage
It can’t guarantee that there are sufficient taxi cabs traverse on each road segment even if we have large number of taxi cabs. That is, we cannot estimate accurately the speed pattern of road segments.
C. Low sampling rate problem
To save energy and the communication loads, the taxi cabs usually report on the locations with very low frequencies like two to five minutes per point of each and every taxi trajectories.
IV. FRAMEWORK
The knowledge of experienced drivers and voting based taxi trajectories are rarely integrated in the path-finding. Driver experience can be mined from the raw GPS trajectory data set generated by extensive floating car applications in the transportation. The proposed novel optimal path-finding approach using a dynamic road hierarchy based on taxi driver experience and also the speed constraint of the roads. The path to travel is computed based on the experimental roads network. The figure shows that the framework is to determine the identification of the experimental optimal paths based on floating car trajectories.
Definition 4.1 (GPS Traces) The original floating car data are tracking points recorded by a GPS receiver mounted in a taxi.
ISSN:2319-8753
I
nternational
J
ournal of
I
nnovative
R
esearch in
S
cience,
E
ngineering and
T
echnology
(An ISO 3297: 2007 Certified Organization)
Vol. 3, Issue 2, February 2014
Definition 4.3 (Landmark Graph) A landmark graph Gl =(Vl,El) is a directed graph that consists of a set of
landmarks Vl conditioned by k and a set of landmark edges E conditioned by δ and tmax.
Fig. 1. Framework of the routing service
A. Landmark Graph
The reason of using “landmark” to model the taxi drivers’ intelligence is by considering firstly, the sparseness and low-sampling rate of the taxi trajectories do not support us to directly calculate the travel time for each road segment while we can estimate the travelling time between two landmarks (which have been frequently traversed by taxis).Secondly, the notion of landmarks follows the natural thinking pattern of people.
ISSN:2319-8753
I
nternational
J
ournal of
I
nnovative
R
esearch in
S
cience,
E
ngineering and
T
echnology
(An ISO 3297: 2007 Certified Organization)
Vol. 3, Issue 2, February 2014
build different landmark graphs for weekday and weekend, and for normal and severe weather conditions, like storm, heavy rain, and snow.This can be evaluated using the cluastering techniques.
Definition 4.4 (Clustering) Clustering is a collection of the data objects. The data object are similar to every one another within same cluster that is dissimilar to the objects in other cluster. Clustering is an unsupervised approach. It does not contain any predefined classes.
B. Travel Time Estimation
The estimation of the travel time can be done using the methods of clustering the GPS real life trajectory datasets to be grouped according to their attribute values that depends on the timing of the travel time on a single day that follows subsequent routes. The travel time from one point of source to the destination can be done based on the difference of the travel time between the source and the destination points. This can be easily done using the variance-entropy based clustering techniques based on [1].Since the GPS data is dynamic and can be recorded for the lower frequencies, we can use the datasets available from the research papers reference and also considering some of the synthetic datasets according to the routes of travel. The implementation of this work depends on the Variance-Entropy based clustering (VE-Clustering) methods of the geo-life datasets. The datasets has to be clustered in order to provide the road segmentation. The estimation of the travel time is done using the variance based clustering by calculating the average weighted average variance and the distance of the travel time is calculated using the entropy based clustering using the weighted average entropy. The landmark graph is generated based on the clustering techniques.VE-Clustering is a two phase clustering technique and the first phase includes variance clustering (V-Clustering) which is to estimate the travel time with the datasets. The reason why we conduct the following V-Clustering instead of using some k-means-like algorithm or a predefined partition is that the number of clusters and the boundaries of these clusters vary in different landmark edges.
V-Clustering. We first sort T uv according to the values of travel time (tl - ta), and then partition the sorted list L into
several sublists in a binary-recursive way. In each iteration, we first compute the variance of all the travel times in L. Later, we find the “best” split point having the minimal weighted average variance (WAV). As a result, we can find out a set of split points dividing the whole list L into several clusters C={c1; c2; . ; cm} each of which represents a category of travel times.
C. Distance of Travel Times
The distance of the travel times can be found using the Entropy based clustering (E-Clustering) which is found using the results of the V-Clustering which is used for finding the travel time estimation. The Entropy Clustering algorithm runs in a similar way to the V-Clustering to iteratively find out a set of split points. The only difference
between them is that, instead of the WAV, we use the weighted average entropy of Sxc.
E-Clustering. This step aims to split the x-axis into several time slots such that the travel times have a relatively stable distribution in each slot. After V-Clustering, we can represent each travel time yi with the category it pertains to (c(yi)),
and then sort the pair collection Sxc = {(xi, c(yi))} for i=1 to n according to xi (arriving time).
D. Route Generation
The routing algorithm, which consists of two phases.They are rough routing in the landmark graph and refined routing in the real road network.
ISSN:2319-8753
I
nternational
J
ournal of
I
nnovative
R
esearch in
S
cience,
E
ngineering and
T
echnology
(An ISO 3297: 2007 Certified Organization)
Vol. 3, Issue 2, February 2014
Definition 5.2 (Smoothing Problem) The rough route can be obtained by smoothing the paths of the original GPS data obtained from the taxis.
The proposed smoothing approaches (independently or simultaneously used) can effectively remove the roundabout part of a route and thus reduce the travel time. The route recommended to a driver is the practically fastest one customized for a particular driver, considering both time-dependent traffic conditions of the dynamic road network learned from experienced taxi drivers and the behaviour of the user. Other factors, like day of the week, and weather conditions, are also considered in our routing model.
V. IMPLEMENTATION
The implementation of this work depends on the Variance-Entropy based clustering methods of the geo-life datasets. The datasets has to be clustered in order to provide the road segmentation. The estimation of the travel time is done using the variance based clustering by calculating the average weighted average variance and the distance of the travel time is calculated using the entropy based clustering using the weighted average entropy. The landmark graph is generated based on the clustering techniques. A rough route is calculated and it will be evaluated.
A. Algorithm for route segmentation
The main aim of this algorithm is different time partitions for different landmark edges based on the taxi
trajectories. We cluster the travel times of transitions pertaining to a landmark edge into several categories based on the
variance of these transitions travel times. After V-Clustering, we can represent each travel time yi with the category it pertains to (c(yi)), and then sort the pair collection Sxc ={(xi; c(yi))}n i=1 according to xi (arriving time). The information entropy of the collection Sxc is given by
Ent(Sxc) = ∑ pi log(pi)
Where pi is the proportion of a category ci in the collection. B. Algorithm for Path Selection
The smoothing path algorithm gets a lot of paths from the previous step. Most of them have strange connections and some of them are less interesting than the others. The smoothing path process takes all generated paths and counts the average priority value per POI for each path. It is counted summarizing priorities for all POIs in path and then dividing it by number of POIs in path. In next step the algorithm selects the most interesting path (it is this one which has the highest average priority).
Also the longest path is selected to determine the maximum visited number of POIs per trip. Then all paths that have average priority less than 90% of typed maximum are eliminated (removing less interesting). After that trips that consist from less than 80% POIs than the longest path are removed (removing short paths). This brings from 5 to at best 40 paths (depends on criteria – for some can be a lot of similar paths). Only the first 10 paths are displayed (sorted by average priority). This constraint is used to prevent user from wasting time on browsing and comparing trips. In fact if the user does not find a satisfying result among the first ten paths mostly he is changing the searching criteria. There are four steps for the implementation of this algorithm as described below:
1. First the algorithm checks the first three points, for instance A, B, C. The actual path is A BC. If path
ISSN:2319-8753
I
nternational
J
ournal of
I
nnovative
R
esearch in
S
cience,
E
ngineering and
T
echnology
(An ISO 3297: 2007 Certified Organization)
Vol. 3, Issue 2, February 2014
2. For each four points in sequence path ABCD is compared to ACBD. If the second is shorter
then points B and C are shifted.
3. This step is similar to the first step but move last three points. If path ABC is longer than the path AC
B then B is shifted with C.
4. If order of points was changed algorithm goes to step i.
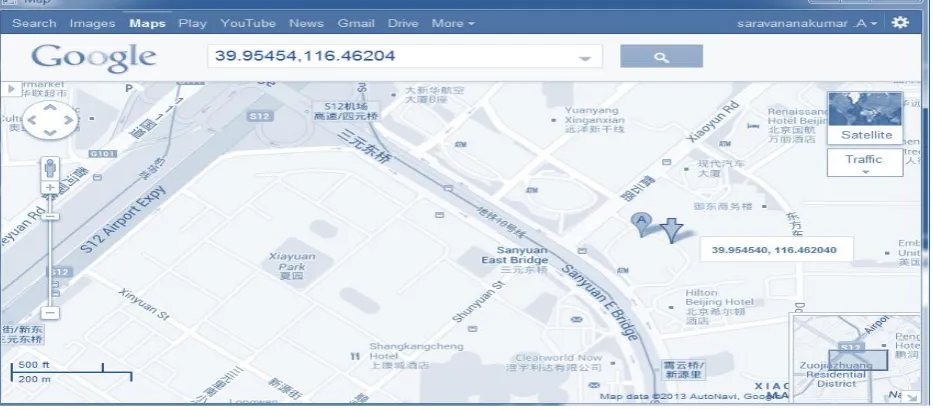
Fig. 2. Results
VI. CONCLUSION
ISSN:2319-8753
I
nternational
J
ournal of
I
nnovative
R
esearch in
S
cience,
E
ngineering and
T
echnology
(An ISO 3297: 2007 Certified Organization)
Vol. 3, Issue 2, February 2014
REFERENCES
[1] J. Yuan, Y. Zheng, C. Zhang, W. Xie, G. Sun, H. Yan, and X. Xie, “T-Drive: Driving Directions Based on Taxi Trajectories,” Proc.18th SIGSPATIAL Int’l Conf. Advances in Geographic Information Systems (GIS), 2010.
[2] T. Hunter, R. Herring, P. Abbeel, and A. Bayen, “Path and Travel Time Inference from GPS Probe Vehicle Data,” Proc. Neural Information Processing Systems (NIPS), 2009.
[3] Y. Lou, C. Zhang, Y. Zheng, X. Xie, W. Wang, and Y. Huang, “Map-Matching for Low-Sampling-Rate GPS Trajectories,” Proc.Int’l Conf. Advances in Geographic Information Systems (GIS), 2009.
[4] J. Yuan, Y. Zheng, C. Zhang, and X. Xie, “An Interactive-Voting Based Map Matching Algorithm,” Proc. Int’l Conf. Mobile Data Management (MDM), 2010.
[5] E. Kanoulas, Y. Du, T. Xia, and D. Zhang, “Finding Fastest Paths on a Road Network with Speed Patterns,” Proc. Int’l Conf. Data Eng. (ICDE), 2006.
[6] Orda and R. Rom, “Shortest-Path and Minimum-Delay Algorithms in Networks with Time-Dependent Edge-Length,”J. ACM, vol. 37, no. 3, pp. 607-625, 1990.
[7] B.C. Dean, “Continuous-Time Dynamic Shortest Path Algorithms,” master’s thesis, MIT, 1999.
[8] Y. Zheng, L. Liu, L. Wang, and X. Xie, “Learning Transportation Mode from Raw GPS Data for Geographic Applications on the Web,” Proc. 17th Int’l Conf. World Wide Web (WWW), 2008.
[9] C. Schensted, “Longest Increasing and Decreasing Subsequences,” Canadian J. Math., vol. 13, pp. 179-191, 1961.
[10] Y. Zheng, Y. Chen, Q. Li, X. Xie, and W. Ma. “Understanding transportation modes based on GPS data for Web applications,” ACM Transactions on the Web, 4(1):1–36, 2010.