ABSTRACT
SUH, MINYOUNG. Static Generation and Dissipation on Textiles. (Under the direction of Dr. Abdel-Fattah M. Seyam and Dr. William Oxenham.)
Static charge has been a major source of problem in textile industry as well as
consumers. During textile manufacturing process, there is a potential of static charge
generation when fibers are extruded, and yarns are woven or knitted, and finished. This gives
spinners and weavers much trouble in terms of productivity, and can lead malfunction of
electronic equipments. Static problems in textile industry have become more serious as
synthetic fibers and higher processing speeds are met. More or less, natural fibers are not as
susceptible to static problems as synthetics. Synthetics such as nylon or polyester are so
hydrophobic that they are easy to accumulate electrostatic charges.
This research was undertaken to gain better understanding of static generation and
dissipation on continuous yarn surface in terms of environmental conditions (temperature and
relative humidity), yarn tension, yarn speed, and fiber type. Four experiments were
conducted: (1) effect of environmental conditions, yarn tension, and yarn speed on static
generation/dissipation of continuous filament polyester yarn, (2) effect of charging pin
material (stainless steel, nylon, polyester, polypropylene, and Teflon) on static
generation/dissipation of continuous filament polyester yarn, (3) effect of fiber type
(polyester, nylon, and polypropylene) on static generation/dissipation of finish free
continuous filament yarns, and (4)effect of humidity, yarn tension, and yarn speed on yarns
of different fiber types with different filament count. The assessment of static
generation/dissipation was done by using a device equipped with winder, two potential
probes, charge pin, tension and speed controllers, and data acquisition system. The device
precisely controlled. Potentials collected by the two probes at two different positions on a
running yarn in real time were used to calculate initial potential (at the point of separation of
yarn and charge pin) and characteristic decay time. The independent parameters of the
experimental designs were broad to include the conditions practiced by the textile industry.
The results of the first experiment indicated that temperature, humidity, yarn tension
and speed had significant effects on static generation, while only temperature and yarn speed
showed statistically significant effects on static dissipation. More charge was created with
lower temperature and humidity, and higher yarn tension and speed. At a temperature of 35°
the charge on the polyester yarn increased as the yarn moved from first probe to the second
probe while at lower temperatures the charge was dissipated. It was also found that high
yarn speed promoted the charge dissipation (shorter decay time).
The results of the second experiment showed that different charging materials
affected static generation, but not static dissipation. The charge materials showed the
following polarity categorized into three groups; stainless steel (gave negative charge on the
polyester yarn), nylon (gave positive charge on the polyester yarn), and polyester (gave
positive charge on the polyester yarn). The polypropylene and Teflon charge materials
exhibited almost no polarity (charge on the yarn is almost zero). Charge polarity generated
on the polyester sample yarn did not coincide with tribo-electric series due to the presence of
spin finish.
The results of the third experiments, however, showed that finish-free yarn materials
followed tribo-electric series. The stainless steel charge pin caused the polyester and
polypropylene to be charged negatively, whereas nylon was positively charged. Finish-free
static charges than polyester and nylon yarns, and nylon yarns were characterized by the
slowest charge decay.
The results of the last experiment exhibited that humidity, yarn tension and speed
showed significant effect on static generation of multifilament yarns, while none of them
were significant in case of monofilament yarns. For the multifilament yarns, more charge
was generated with lower humidity, and higher yarn tension and speed. Static dissipation
was influenced only by yarn speed for both multifilament and monofilament yarns. The
effect of yarn speed on decay time for multifilament and monofilament yarns was the same
in terms of trend, where high yarn speed promoted the charge dissipation (shorter decay
STATIC GENERATION AND DISSIPATION ON TEXTILES
by Minyoung Suh
A thesis submitted to the Graduate Faculty of North Carolina State University
In partial fulfillment of the Requirements for the Degree of
Master of Science
TEXTILES
RALEIGH
2008
Approved by:
Dr. Abdel-Fattah M. Seyam Chair of Advisory Committee
Dr. William Oxenham Co-chair of Advisory Committee
Dr. Jeff Thompson Minor Representative of Advisory Committee
ii
DEDICATION
Dedicated to
My beloved great grand mother
iii BIOGRAPHY
Minyoung Suh was born on September 16th, 1980 in Seoul, South Korea. She received two Bachelor of Science degrees in Clothing & Textiles and Human Environment &
Design on February, 2003 from Yonsei University. She worked for Inthef Company (an
apparel producer), as a textile designer. She joined North Carolina State University, NC to
start her master program in Textile Technology and Management in August, 2006. She
iv
ACKNOWLEDGEMENTS
The author wishes to thank her advisors, Dr. Abdel-Fattah M. Seyam and Dr. William
Oxenham, for the opportunity to work with them and the guidance throughout the research.
Appreciation is extended to the members of advisory committee, Dr. Tom Theyson who
provides the yarns and Dr. Jeff Thompson who helped in statistical procedures. Gratitude is
due to National Textile Center for providing financial support during graduate program.
Thanks to Dr. Yiyun Cai for training on using the static generation/dissipation
equipment and mentoring. Appreciation is extended to Lu Liu and Brad James for their
valuable discussion and sharing their research findings.
The author would like to extend her thanks to the technical staff Mr. Timothy
Mumford, Mr. Dzung Nguyen, Mr. Hai Bui, and Ms. Birgit Andersen for providing help with
sample preparation, machining of parts, analytical measurements, and troubleshooting of
electrical and mechanical problems.
Thanks also to lovely friends, Kyunghye Jung and Sangwon Chung for entertaining
the life in Raleigh with fun, and to many friends in Korea, Jihyun Kim, Song Kim, Soyeon
Kim, Eunae Cho, Eunsan Shin, and Jungeun Shin, for being a big source of comfort.
Finally, the author wishes to express sincere appreciation and love to her parents,
Sangsuhp Suh and Sunock Lee, for their constant support and encouragement during the
entire study. Gratitude extends to her sister and brothers, Minhee, Junyong, and brand new
brother-in-law Hyungsoo Kim. As the emotional prop throughout the life, her great grand
v
TABLE OF CONTENTS
LIST OF TABLES... vii
LIST OF FIGURES ... ix
TERMS RELATED TO STATIC ELECTRICITY... xi
I. INTRODUCTION... 1
II. LITERATURE REVIEW... 5
2.1. Electrostatic Standard ... 5
2.1.1. Resistance/Resistivity ... 5
2.1.2. Tribo-electrification ... 12
2.1.3. Electrostatic Test Method for Textiles... 15
2.1.4. Static Decay Measurement ... 17
2.2. Electrostatic Measurement Technique... 18
2.2.1. Measurement Method ... 18
2.2.2. Tester Development ... 19
2.3. Experimental Studies ... 24
2.3.1. Development of Devices... 26
2.3.2. Previous Studies on Yarns and Fibers ... 28
2.3.3. Previous Studies on Material Surfaces ... 29
2.3.4. Fabric containing Conductive Yarns ... 32
2.4. Electrostatic Theory... 36
III. OBJECTIVES... 39
IV. EXPERIMENTAL... 41
4.1. Materials ... 41
4.1.1. Continuous Filament Yarns ... 41
4.1.2. Charge Pins ... 42
4.2. Linear Tester ... 42
4.3. Environmental Room ... 42
4.4. Experimental Designs ... 43
4.4.1. Experimental Design I ... 43
4.4.2. Experimental Design II ... 44
4.4.3. Experimental Design III... 45
4.4.4. Experimental Design IV ... 47
4.5. Testing Procedures... 49
4.6. Responses... 53
4.6.1. Potential ... 53
4.6.2. Initial Potential... 54
vi
4.6.4. Rate of Data Collection... 55
4.6.5. Calculation of Responses... 56
4.7. Statistical Analysis... 57
4.7.1. Analysis of Variance and Pair-Wise Multiple Comparison... 57
4.7.2. Spectrum Analysis ... 57
V. PRELIMINARY TEST... 61
5.1. Charge Amount Measurement ... 61
5.1.1. Charge Amount vs. Potential ... 61
5.1.2. Faraday Tube Length ... 62
5.2. Data Collection Rate ... 65
5.3. Friction Coefficient Measurement ... 68
VI. RESULTS AND DISCUSSION... 73
6.1. Experimental Design I ... 73
6.1.1. Statistical Analysis... 73
6.1.2. Effect of Temperature ... 79
6.1.3. Effect of Humidity ... 81
6.1.4. Effect of Yarn Tension... 83
6.1.5. Effect of Yarn Speed... 85
6.2. Experimental Design II ... 87
6.2.1. Statistical Analysis... 87
6.2.2. Effect of Charge Pin Material ... 89
6.3. Experimental Design III... 92
6.3.1. Statistical Analysis... 92
6.3.2. Effect of Yarn Material... 93
6.4. Experimental Design IV ... 94
6.4.1. Statistical Analysis... 94
6.4.2. Effect of Humidity ... 103
6.4.3. Effect of Yarn Tension... 103
6.4.4. Effect of Yarn Speed... 104
VII. CONCLUSION ... 106
7.1. Experimental Design I ... 106
7.2. Experimental Design II ... 107
7.3. Experimental Design III... 108
7.4. Experimental Design IV ... 108
VIII. SUGGESTIONS FOR FUTURE STUDIES ... 110
IX. REFERENCES ... 111
vii
LIST OF TABLES
Table 2.1. Equations for the volume and surface resistivity / conductivity (ASTM) [7] ... 7
Table 2.2. Electrode systems (ASTM) [7] ... 8
Table 2.3. Standard Test Method Compared ... 16
Table 2.4. Comparison between Capabilities of Electrostatic Devices ... 25
Table 2.5. Material Ranking for Each Test Method at 25% Relative Humidity [24]... 27
Table 2.6. Summarized Tribo-electric Series [18]... 31
Table 2.7. Tribo-electric Series (against Glass) [38] ... 32
Table 4.1. List of Yarns ... 41
Table 4.2. Experimental Design I ... 44
Table 4.3. Experimental Design II... 45
Table 4.4. Experimental Design III... 46
Table 4.5. Surface Area of Finish-free Yarn... 47
Table 4.6. Experimental Design IV ... 48
Table 4.7. Yarn Tension and Surface Area Specification... 48
Table 4.8. Time (in seconds) from Charge Pin to Probes... 54
Table 4.9. Rate of Data Collection... 56
Table 5.1. Static Charge Comparison between Charge Amount and Potential ... 63
Table 5.2. Charge Amount Comparison between Short and Long Tubes ... 64
Table 5.3. Charge Amount per Unit Length ... 65
Table 5.4. Rate of data collection in terms of speed... 66
Table 5.5. Constant rate of data collection ... 66
Table 5.6. Measurement Comparison ... 67
Table 5.7. Calculation Comparison ... 67
Table 5.8. Output Tension of 1000/140 PET yarn against Different Charge Pins ... 70
Table 5.9. Friction Coefficient of 1000/140 PET yarn against Different Charge Pins... 71
Table 6.1.Overall ANOVA for Initial Potential... 74
Table 6.2. Type I ANOVA for Initial Potential ... 74
Table 6.3. Type III ANOVA for Initial Potential ... 75
Table 6.4. Overall ANOVA for Decay Time... 75
Table 6.5. Type I ANOVA for Decay Time ... 76
Table 6.6. Type III ANOVA for Decay Time ... 76
Table 6.7. Scheffe’s Multiple Temperature Comparisons for Initial Potential... 77
Table 6.8. Scheffe’s Multiple Temperature Comparisons for Decay Time... 77
Table 6.9. Scheffe’s Multiple Humidity Comparisons for Initial Potential... 78
Table 6.10. Scheffe’s Multiple Humidity Comparisons for Decay Time... 78
Table 6.11. Overall ANOVA for Initial Potential... 88
viii
Table 6.13. Overall ANOVA for Decay Time... 88
Table 6.14. Type I and Type III ANOVA for Decay Time ... 88
Table 6.15. Scheffe’s Multiple Charge Pin Comparisons for Initial Potential ... 89
Table 6.16. Overall ANOVA for Initial Potential... 92
Table 6.17. Type I and Type III ANOVA for Initial Potential ... 92
Table 6.18. Overall ANOVA for Decay Time... 93
Table 6.19. Type I and Type III ANOVA for Initial Potential ... 93
Table 6.20. Scheffe’s Multiple Yarn Material Comparisons for Initial Potential ... 93
Table 6.21. Overall ANOVA for Initial Potential... 95
Table 6.22. Type I ANOVA for Initial Potential ... 96
Table 6.23. Type III ANOVA for Initial Potential ... 96
Table 6.24. Overall ANOVA for Decay Time... 97
Table 6.25. Type I ANOVA for Decay Time ... 97
Table 6.26. Type III ANOVA for Decay Time ... 98
Table 6.27. Overall ANOVA for Initial Potential of Multifilament Yarns ... 99
Table 6.28. Type I ANOVA for Initial Potential of Multifilament Yarns... 99
Table 6.29. Type III ANOVA for Initial Potential of Multifilament Yarns ... 99
Table 6.30. Overall ANOVA for Decay Time of Multifilament Yarns... 100
Table 6.31. Type I ANOVA for Decay Time of Multifilament Yarns ... 100
Table 6.32. Type III ANOVA for Decay Time of Multifilament Yarns ... 100
Table 6.33. Overall ANOVA for Initial Potential on Monofilament Yarns ... 101
Table 6.34. Type I ANOVA for Initial Potential of Monofilament Yarns ... 101
Table 6.35. Type III ANOVA for Initial Potential of Monofilament Yarns... 101
Table 6.36. Overall ANOVA for Decay Time on Monofilament Yarns ... 102
Table 6.37. Type I ANOVA for Decay Time of Monofilament Yarns ... 102
ix
LIST OF FIGURES
Figure 2.1. ESD Electrode [19, 20]... 9
Figure 2.2. Rotating Vane (top) and Vibrating Sensor Field Meter (bottom) [8]... 14
Figure 2.3. NASA Tester [25]... 20
Figure 2.4. JCI Tester [15]... 20
Figure 2.5. Linear Tester [40] ... 23
Figure 2.6. Rubbing Tester [40]... 23
Figure 2.7. Energy Levels in Metals (top), and in Metal and Insulator (bottom) [36] ... 37
Figure 4.1. Charge Pins... 42
Figure 4.2. Charge Pin Dimension... 42
Figure 4.3. Linear Tester... 43
Figure 4.4. Dimensions between charge pin and probes ... 43
Figure 4.5. Gradient Adaptor ... 47
Figure 4.6. Environmental Room... 49
Figure 4.7. Control Pad... 49
Figure 4.8. Zero and Balance Knob of the Voltmeter... 50
Figure 4.9. Tensioner of CTT ... 51
Figure 4.10. Tensionmeter ... 51
Figure 4.11. CTT Speed Control Pad... 51
Figure 4.12. Input/output screen of LJstream software ... 52
Figure 4.13. Electrostatic Probe 1017A... 53
Figure 4.14. Electrostatic Voltmeter 244A ... 53
Figure 4.15. Spectrum analysis for nylon charge Pin ... 58
Figure 4.16. Spectrum Analysis with Other Polymer Pins at 100 m/min Speed ... 59
Figure 4.17. Supply package diameter at the time of test and traverse length ... 60
Figure 5.1. Dimensions with Shorter Tube... 62
Figure 5.2. Dimensions with Longer Tube ... 62
Figure 5.3. Friction in Yarn [36]... 68
Figure 5.4. Effect of Tension and Speed on Friction Coefficient... 69
Figure 5.5. Friction Coefficients of PET yarns running against Polymer Charge Pins ... 72
Figure 6.1. Effect of Temperature on Initial Potential... 79
Figure 6.2. Effect of Temperature on Decay Time... 79
Figure 6.3. Potential Signals from Two Probes at Repeated Experiments ... 80
Figure 6.4. Steady Yarn Observation... 81
Figure 6.5. Steady Yarn Observation... 81
Figure 6.6. Effect of Humidity on Initial Potential... 82
Figure 6.7. Effect of Humidity on Decay Time ... 82
x
Figure 6.9. Interactions between Yarn Tension and Speed ... 84
Figure 6.10. Effect of Yarn Tension on Decay Time ... 84
Figure 6.11. Effect of Yarn Speed on Initial Potential ... 85
Figure 6.12. Friction Coefficient and Potential Generation... 86
Figure 6.13. Effect of Yarn Speed on Decay Time... 87
Figure 6.14. Effect of Charge Pin Type on Initial Potential ... 90
Figure 6.15. Effect of Yarn Finishing on Initial Potential ... 91
Figure 6.16. Effect of Yarn Material on Initial Potential... 94
Figure 6.17. Effect of Humidity on Initial Potential of Multifilament Yarns... 103
Figure 6.18. Effect of Yarn Tension on Initial Potential of Multifilament Yarns ... 104
Figure 6.19. Effect of Yarn Speed on Initial Potential of Multifilament Yarns ... 104
Figure 6.20. Effect of Yarn Speed on Decay Time of Multifilament Yarns ... 105
xi
TERMS RELATED TO STATIC ELECTRICITY
This section provides definitions of parameters used in the field of static generation. When applicable, the symbol commonly used to abbreviate a parameter is given along with units.
Capacitance (Farad): the amount of electric charge stored for a given electric potential, (Symbol: C) [13]
Charge (Coulomb, C): a fundamental property of subatomic particles, determining electromagnetic interaction and producing electromagnetic fields (symbol: Q) [32]
Charge Density: the amount of electric charge in a line (C/m), surface (C/m2), or volume (C/m3)
Conductivity (Siemens/meter, S/m): the inverse of resistivity, a measure of electron mobility to flow through the object (symbol: σ)
Conductor: a material within which an electric current is produced by application of voltage between points on or within the material
Corona Discharge: a type of discharge occurring when the potential gradient exceeds a certain value, but conditions are not sufficient to cause complete electrical breakdown [32]
Current (Ampereor Coulomb/sec, A or C/s): the flow of electric charge (symbol: I) [32]
Decay Time (second): the time required to decay to a fraction of the initial quantity Half Decay Time: the time required to get half original quantity [35]
Characteristic Decay Time: the time required to get 1/e times of original quantity [13]
xii
Faraday Cage: an enclosure to block out external electric field causing electrical charges [32]
Electric Field (Volts/meter, V/m): the space established around an electric charge or in time-varying magnetic filed, exerting a force on other electrically charged objects (symbol: E) [32]
Electrification: the action or process of making a thing get charged with electricity [8]
Electrostatic Discharge (ESD): a sudden and momentary electric current that flows from or to the surroundings at different electrical potentials for neutralization
Insulator: a material in which a voltage applied between two points on or within the material produces a small or negligible current
Potential (Volts or Joule/Coulomb, V or J/C): potential difference, the change in potential energy per unit charge associated with electric field (symbol: V) [32]
Resistance: the physical property of a material which is a measure of the ability of electrons to flow through it when a voltage is applied across two points on the material, function of physical geometry and resistivity (symbol: R) [5]
Surface Resistance (Ω): the ratio of a potential difference to the current flowing on the surface of the specimen [7]
Volume Resistance (Ω): the ratio of a potential difference to the current flowing through the specimen [7]
Resistivity: material property equal to the ratio of the voltage gradient to the current density, the degree to which a material opposes the flow of current (symbol: ρ) [4]
xiii
(the current path) to the distance between electrodes [4, 7]
Volume Resistivity (Ω·m): the volume resistance multiplied by the ratio specimen cross-sectional area to distance between electrodes [4, 7]
Triboelectric Charging: the formation of electrostatic charges, with or without rubbing, by the separation of contacting materials [18]
1
I. INTRODUCTION
Static generation of textiles can be explained as tribo-electricity which is caused by
contact or rubbing operation between two surfaces. The tribo-electricity had been initially
observed by a Greek philosopher, Thales, around B.C. 600 [34]. After rubbing amber with
hemp clothes, he found the force on the amber attracting such things like bird feathers. Then,
by late 16th century, an English physicist, William Gilbert, had distinguished the electricity and magnetism from this [9]. The term ‘electricity’ was originated from a Greek word
referring amber.
Materials can be divided into two types in terms of flow of electric current,
conductors and insulators. When two surfaces come into contact, they exchange electrons
and get electrically charged. Due to their low surface resistance, conductive materials have
high probability of charge exchange, while insulative materials tend to keep electrons
because they possess high surface resistance. Metal and ceramic are good examples of
conductor and insulator, respectively. Textile materials are usually defined as
semi-conductors. They can transfer the electricity like conductors and also can hold electricity like
insulators.
Low energy surfaces such as polymeric materials are characterized by their nature to
collect electrostatic charge when rubbed against themselves, other polymeric surfaces, or
metals [38]. Static shock occurs when relatively large charge built up on a person or low
surface energy material due to charge tendency to pass over for neutralization. Static charge
generated by friction may impair the properties of textile products, for example, it may cling
2
appearance of garments. Static shock, as a result of discharge, is commonly experienced
especially in dry winter when walking on a carpet, touching a door knob, and putting on or
taking off clothes. Static can be a matter of life and death when a parachute fails to open
because of static problems or spark generation at a gas station that may cause fire [44].
Static has been a major source of problem in textile industry as well as consumers.
During textile manufacturing process, there is a potential of static charge generation when
fibers are extruded, and yarns are woven or knitted, and finished. Fibers, yarns, or fabrics are
rubbed with guides, rollers or tension devices on the machinery and this operation of contact
and separation continuously occur throughout the process. This gives many spinners and
weavers much trouble in terms of productivity, and can lead malfunction of electronic
equipments. Static problems in textile industry have become more serious as synthetic fibers
and higher processing speeds are met. More or less, natural fibers are not as susceptible to
static problems as synthetics. Synthetics such as nylon or polyester are so hydrophobic that
they are easy to accumulate electrostatic charges.
Researchers studied static electricity for useful applications as well as for the
prevention. Static charge has positive attributes in dust collectors, copiers, or laser printers.
Copiers make use of static generated on projected images to copy them by attracting carbon
powder. Additionally, static charge is used in fabric formation (flocking and fiberweb
formation [11, 41]) as well as electrets filters.
By nature, material itself has own ranking of polarity which is relative tendency to
gain or lose electrons. When materials get into contact, they exchange electrons according to
3
Montgomery [29], wool is on the top of tribo-electric series in terms of ease of releasing
electrons. The rank of textile materials in terms of releasing electrons (in descending order) is
nylon, viscose rayon, cotton, silk, acetate, polyester, acrylic, polyethylene, and Teflon (nylon
being the easiest among the list to release electrons). A study by Henniker [27] showed
different tribo-charge series than shown by Hersh and Montgomery with the following order:
nylon, wool, silk, cotton, polyethylene, and Teflon. Another study [1] indicated different
order from Hersh and Montgomery with the order: nylon, wool, silk, cotton, polyester,
acrylic, polyethylene, and Teflon. While Diaz and Felix-Navarro work revealed the order:
nylon, wool, silk, cotton, acetate, polyester, acrylic, polyethylene, and Teflon.
Despite of accumulated research in this area, there is hardly any explanation in
regards to the mechanism of static generation and dissipation agreed universally due to low
reproducibility of tribo-electrification [8, 9, 12, 18]. Contradicting results in regards to the
effect of material resistivity on static charge dissipation judged by decay time were published
[14, 15, 28, 35]. According to Chubb [14, 15], it was asserted that electrical resistivity had no
relation with charge decay property, whereas in Henry et al. [28] and Jonasssen [35] work, it was shown that there is proportionality between resistivity and charge decay time. Diaz and
Felix-Navarro [18] pointed out that the contradiction may be explained by the complexity of
measurement and the numerous parameters affecting the static generation/dissipation such as
chemical composition, surface characteristics, nature of contact, experimental conditions, etc.
Besides, charge transfer mechanism of insulators is still debatable.
This research was undertaken to gain better understanding of static generation and
4
(temperature and relative humidity), yarn tension, yarn speed, fiber type, and filament count
5
II. LITERATURE REVIEW 2.1. Electrostatic Standard
Compared to the increasing interest of scholars in researching the static charge
generation/dissipation of materials, there are few standard methods addressing the
measurement of such parameters. There are four major organizations publishing electrostatic
standards; American Society of Testing and Materials (ASTM), Electrostatic Discharge
(ESD) Association, American Association of Textile Chemists and Colorists (AATCC), and
International Standard Organization (ISO). These organizations developed test methods to
assess resistivity, and static charge generation and accumulation. In addition to the four
organizations mentioned above, the Federal Test Method (FTM) developed a standard test
concerning charge dissipation. Devices to charge and procedure to generate static charge
using such devices are provided as standard to increase measurement accuracy and
reproducibility.
2.1.1. Resistance/Resistivity
Test methods were developed to measure resistance and resistivity of yarns and
films/fabrics. Electrical resistance can be calculated from measurement of current and
voltage under known electrode dimensions. Resistance is determined by the properties of
material and the dimensions of a specimen. Surface resistance is the ratio of a potential
difference to the current flowing on the surface of the specimen, and volume resistance is the
ratio of a potential difference to the current flowing through the specimen. Volume resistance
6
Resistivity for yarns (better known as volume resistivity) is defined as the resistance per unit
yarn length (Equation 2.1). For films or fabrics, resistivity (better known as surface
resistivity) is defined as the resistance per unit fabric area (Equation 2.2).
S D
Rv =ρv× …. (2.1)
W D
Rs =ρs× …. (2.2)
where,
Rv= Volume Resistance (Ω)
Rs= Surface Resistance (Ω)
ρv= Volume Resistivity (Ω·m)
ρs= Surface Resistivity (Ω)
S = Cross-sectional Area of Specimen (m2) D = Distance between Electrodes (m)
W = Width of Specimen (m)
ASTM first set the standard for measuring resistance in 1999 (ASTM D257-99) [7].
The method is used to assess the resistivity of high resistance insulating and polymeric
materials. The method describes an apparatus that consists of electrode system, power supply,
guard circuit, and current-measuring devices used for measuring resistance. The method
requires direct voltage application to the sample. The voltage level is 500 ± 5 volts and the
electrification time is 60 seconds. For the electrodes, ASTM suggested 11 different systems
according to types of materials, which are (1) Binding-Post and Taper-Pin Electrodes, (2)
Metal bars, (3) Silver Paint, (4)Sprayed Metal, (5) Evaporated Metal, (6) Metal Foil, (7)
7
Conducting Rubber, and (11) Water. The equations for the volume and surface
resistivity/conductivity calculation and applications of the electrode systems for selected
relevant materials are depicted in Table 2.1 and Table 2.2.
Table 2.1. Equations for the volume and surface resistivity / conductivity (ASTM) [7]
Resistivity Conductivity Electrode or
Specimen types
Volume Surface Volume Surface
Circular
Electrodes v Rv
t
A×
=
ρ s Rs
g
P×
=
ρ v Gv
A t ×
=
σ s Gs
P g× = σ Square Electrodes 1 2 ln 2 D D LRv v π ρ = s s R g P × = ρ v v LR D D π σ 2 ln 1 2
= s Gs
P g×
=
σ
where, ρv = volume resistivity (Ω·cm)
σv = volume conductivity (Siemens/cm)
ρs= surface resistivity (Ω/cm2)
σs= surface conductivity (Siemens/cm2)
A = the effective area of the measuring electrode (cm2) P = the effective perimeter of the guarded electrode (cm) Rv= measured volume resistance (Ω)
Gv = measured volume conductance (Siemens)
Rs = measured surface resistance (Ω)
Gs=measured surface conductance (Siemens) t = average thickness of the specimen (cm) D1, D2, = electrode diameter (cm)
g = distance between electrode1 and electrode2 (cm)
8 Table 2.2. Electrode systems (ASTM) [7]
Electrode system Applications
Binding-Post and Taper-Pin Electrodes Rigid insulating materials
Metal Bars Flexible, thin and solid materials
Sprayed Metal When adhesion to the materials is needed
Evaporated Metal When adhesion to materials is needed
Metal Foil When the electrodes are needed on surface
Colloidal Graphite Nonporous, sheet insulating materials
Liquid Metal Electrodes Flat and solid specimens
Flat Metal Plate Flexible and compressible materials
Conducting Rubber When quick and easy application is needed
ESD Association suggested an apparatus for measuring surface resistance
(ANSI/ESD STM 11.11) [19] and volume resistance (ANSI/ESD STM 11.12) [20] dedicated
for planar materials that could be applied films and fabrics. ESD apparatus consists of
electrode assembly, specimen support surface, instrumentation for charge measurement, and
fixture for verification.
Electrode assembly has two concentric rings to establish contact with the material
under test (Figure 2.1). The inner electrode is a solid disk whose diameter is 30.48 ± 0.64
9
mm ring thickness. Additionally, for the volume resistance measurement, a bottom electrode
is needed, which is a flat conductive metal plate. Two concentric rings are used as a top
electrode, and a metal plate is used as a bottom electrode. The contact surface material of
electrode assembly is a conductive material with hardness between 50 and 70 on the Shore-A
Durometer scale and volume resistivity less than 10 ohm·cm. The expected total weight of
electrode assembly is given to be 2.27 kg ± 56.79 g. Instrumentation includes an ammeter
and power supply (10 ~ 100 volts). Verification fixture attaches to the electrode assembly in
order to check whether the system works as it should. Different kinds of resistor are
suggested for materials with low resistance and high resistance. With the verification fixture,
the apparatus indicates about 5.0×10⁵ ohms for low resistant fixture and 1.0×10¹² ohms for high resistant fixture.
Figure 2.1. ESD Electrode [19, 20]
For both surface resistance [19] and volume resistance [20], 6 samples of test
10
minimum 48 hours but no greater than 72 hours in 23 ± 3°C and 12 ± 3% R.H. Resistance
can be obtained after 10 volt power is supplied for the resistance below 1.0×10⁶ ohms, and 100 volt power for measurement of higher resistance. An average, minimum and maximum
values of resistance from 6 samples needed to be reported as a result with the conditioning
period, relative humidity and temperature. For the volume resistance, the thickness of the
samples is required additionally.
AATCC describes a test method for resistivity of fabrics (AATCC Test Method 76)
[4], and yarns (AATCC Test Method 84) [5]. The methods assess surface resistivity for
fabric materials and volume resistivity for yarn materials. The standards for fabrics [4]
require using an electrical resistance meter between two parallel plate electrodes or
concentric ring electrodes for measuring electrical resistivity of fabrics. For the parallel plate
electrode, two sets of test are needed for resistivity in length direction and width direction.
For concentric ring electrode, one set is enough because both length and width directions can
be achieved simultaneously. The test specimen is placed in contact with the electrodes after
conditioning in a chamber. Electrodes are located 25 mm away from each other. Current
passed through the specimen is measured after supplying 80~100 volts of power to the
electrode.
Resistivity of specimens is calculated from Equation 2.3 for parallel plate electrode
and Equation 2.4 for concentric ring electrode. The result should be reported in forms of the
logarithm of the resistance (log R) with the number of specimens tested, environment
11 D
W R× =
ρ …. (2.3)
i o r r
R
log 73 . 2 × =
ρ
…. (2.4)where, ρ = surface resistivity (Ω)
R = measured resistance (Ω)
W = width of specimen (m)
D = distance between electrodes (m)
ro = outer electrodes radius (mm)
ri = inner electrodes radius (mm)
AATCC developed a similar standard for electrical resistance of yarn (AATCC Test
Method 84) [5]. The main principle is same to the fabrics [4]. The test yarn is placed between
the parallel plate electrodes whose distance is not specified indication of user is allowed
lengths as desired. Concentric ring electrode system is not applicable for testing yarns. The
length of the yarn depends on the distance between electrodes. The specimen can be made of
single strand or multiple strands. Every strand should be under same tension, and evenly
spaced without overlap. Electrodes are located 10 mm away from each other. 30~40 volts of
power is applied to the yarn and the current passed through the yarn is measured.
Equation 2.5 describes the yarn resistance calculation. Because resistance can be
affected by the length of test yarns, 10 mm length was set for calculating resistance. The
result should be reported in forms of the logarithm of the resistance (log R) with
12
10 3
2
1+ + + + ×
× =
n
r r
r r D S
R L n …. (2.5)
where, R = resistance per mm per strand of yarn (Ω)
S = number of strands per specimen
D = distance between electrodes (mm)
r = resistance of individual specimens containing S strands per specimen (Ω)
n = total number of specimens tested
Ambient condition can vary with purposes, but 24°C temperature and 65% relative
humidity were given as a standard. In addition, AATCC recommended humidity in a testing
chamber as 20% R.H. for the materials having critical electrostatic propensity and as 40%
R.H. for the materials having less critical propensity.
2.1.2. Tribo-electrification
Standardization of electrification is a must because reliability and reproducibility of
electrostatic experiments have been great impediments obstructing the development of
universal theories. Driven by this fact, several ASTM and ESD standard methods to electrify
materials and determine static charge were developed.
ASTM standard for electrification (ASTM D4470-97) [8] contains common criteria
that should be considered in a general static electrification. It is describing the method of
generating tribo-electric charge, and measuring the charge and associated electric field
13
ASTM D4470-97 [8] introduced electrification methods for powder, liquids, web and
sheet. In order to get charged, powder or liquids can pass through the tube so that the friction
between the specimen and the wall inside of the tube create the charge on the specimen. For
webs, contact against a charging roller surface is used to generating electricity. Sheet
materials can be electrified by sliding down chutes, by vacuum platens, or by pinch rollers.
Pinch rollers and sliding down chutes are considered to generate the largest amount of charge.
The method of measuring charge and electric field was also introduced. Measuring
charges can be achieved by putting the electrified specimen in Faraday Cage connected to an
electrometer. Faraday Cage is a device excluding the effect from external electric fields. For
the measurement of electric field strength, which is the magnitude of the vector force on a
point charge, Rotating Vane Field Meter and Vibrating Plate Field Meter were developed.
The meters are shown schematically in Figure 2.2.
In addition, five test parameters that should be under control are given; (1) cleanliness
of material surfaces, (2) contact area, (3) contact time, (4) rapidity of separation, and (5)
external electric fields. Cleaning the material surfaces with solvents is not making the
surfaces clean, but it creates evenly contaminated surfaces. Real area of contact can be
controlled by keeping pressure, roughness of surfaces, and slip between surfaces constant.
Time of contact and rapidity of separation can control additional charge flow into the bulk of
the specimen or back to the origin. Elimination of electric fields in the vicinity can be
achieved by removing all insulators from the test area or by shielding the area. Reporting test
results should include average and standard deviation of charge amount/electric field strength,
14
contact, rapidity of separation, amount of rubbing, specimen identification, equipment
description, and ambient conditions.
Figure 2.2. Rotating Vane (top) and Vibrating Sensor Field Meter (bottom) [8]
ESD association has a method for testing tribo-electric charge accumulation (ESD
ADV 11.2) [21]. The methods for tribo-electrification are (1) Magazines, (2) Inclined Plane
Method for Large Cylinders, (3) Inclined Plane Method for Small Cylinders, (4) Charging
due to Transport or Handling in Packing Materials, (5) Hand Held Charging Test, (6) Card
Pull Test, (7) Rolling Friction Tester, and (8) Adhesive Tape Pull Test. Among them, Hand
Held Charging Test and Card Pull Test are for field application having manual operations,
and the others are for laboratory use. Charging due to Transport or Handling in Packing
Materials, Hand Held Charging Test and Card Pull Test are especially designed for packing
process in the industries.
15
tests. Theoretical factors of tribo-electrification are (1) surface contact effects, (2) material
work function, (3) charge backflow, and (4) gaseous breakdown. Surface contact effects are
the issues related to the changes of real contact area, pressure, and surface temperature by
repetitive contact. Work function is defined as the minimum energy required removing an
electron from a solid surface to an outside point. It is the subject of change with charge
transfer. Charge backflow is the phenomenon that charges move back to the origin during
separation. Gaseous breakdown refers to charge flow to the atmosphere after the separation.
In order to overcome these factors, ESD association recommended to conduct tests in as
many methods as possible, to have comparison values, to make as simple and consistent
rubbing movements as possible, to treat independent testing groups, to use averages and
distributions from repeated tests, and to control as many variables as possible.
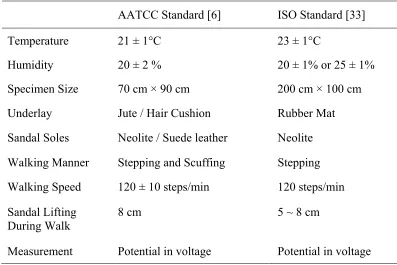
2.1.3. Electrostatic Test Method for Textiles
A new approach developed by AATCC [6] and ISO [33] is applicable for an
electrostatic experiment for textile products. They established similar standards, focused on
the simulation of the charge accumulation on carpets. The static propensity of textiles on
which a person walks is observed through laboratory simulation.
According to AATCC Test Method 134 [6], ambient condition is set as 21 ± 1°C in
temperature and 20 ± 2 % in relative humidity. Test room should be big enough so that the
operator comes no closer than 60 cm to extraneous objects such as walls or equipments. Two
pairs of standard sandal with the soles of Neolite and suede leather are prepared. Neolite is
16
carpet. Carpet specimens (70 cm × 90 cm) is put over the underlay of a cushion made of jute
and hair (120 cm × 120 cm) which is laid on the grounded metal plate (120 cm × 120 cm).
The operator wearing the sandal mounts on the specimen avoiding any friction and
contact with the test probe. Test is running with stepping and scuffing motions. Stepping is
walking on the specimen with lifting sandals as close as possible to 8 cm above the specimen
at the rate of 120 ± 10 steps per minute, while scuffing is wiping the specimen forward and
backward with lifting the sandals as close as possible to 7 cm above the specimen at the rate
of 60 ± 5 steps per minute. Analysis of test results is performed in terms of peak voltages,
and they should be reported with averages.
Table 2.3. Standard Test Method Compared
AATCC Standard [6] ISO Standard [33]
Temperature 21 ± 1°C 23 ± 1°C
Humidity 20 ± 2 % 20 ± 1% or 25 ± 1%
Specimen Size 70 cm × 90 cm 200 cm × 100 cm
Underlay Jute / Hair Cushion Rubber Mat
Sandal Soles Neolite / Suede leather Neolite
Walking Manner Stepping and Scuffing Stepping
Walking Speed 120 ± 10 steps/min 120 steps/min
Sandal Lifting During Walk
8 cm 5 ~ 8 cm
Measurement Potential in voltage Potential in voltage
A standard of International Standard Organization (ISO) [33] is substantially identical
17
principle is assessing the difference in electrical potential produced by a person walking on
the textile floor in a prescribed manner with standardized footwear. Specimen size was
specified to be 2,000 mm × 1,000 mm, and atmospheric condition was defined to be 23 ±
1°C and 20 ± 1% R.H. or 25 ± 1% R.H. Major apparatus consists of earthed metal base plate
(2,000 mm × 1,000 mm), rubber mat (2,200 mm × 1,200 mm, thickness 4.5 ± 0.5 mm),
sandals, and body voltage measuring system. Sandals should be cleaned using designated
cotton fabric, ethanol, and sandpaper. Two standard reference carpets are given for setting
the measuring system.
Prescribed walking manner is defined to walk on the specimen at the rate of 2 steps
per second forward and backwards, but avoiding scuffing or pivoting. Stepping action
continues for about 60 seconds with sandal lifting between 50 and 80 mm. After three sets of
walks for each specimen, the individual body voltages for each walk, average of those
voltages, and deviations are required to be reported.
2.1.4. Static Decay Measurement
Federal Test Standard (FTS) 101C Method 4046 [23] measures static decay property
of materials in forms of film or sheet. The material must be homogeneous and free from
defects such as holes, cracks, and tears. This method assesses the ability of material to
dissipate a charge induced on the surface when grounded.
Test environment is defined as 73 ± 3.5 °F and 15% R.H. The test is performed on a
sample specimen (5 inch × 3 inch) mounted between electrodes connected to a fieldmeter.
18
and brass. Detailed description of the electrode system is not given. A voltage of 5000V is
applied to the electrodes from a high voltage source until the fieldmeter observes no more
increase in voltage, which means the specimen has received its maximum charge. After
stopping supplying voltage, the specimen is earthed so that static charge can decay. The time
from the point where the specimen is grounded to the point of complete dissipation of charge
is recorded as a decay time. Three times of repetition is suggested.
2.2. Electrostatic Measurement Technique 2.2.1. Measurement Method
There have been three classes of method measuring electrostatic propensity of textile
materials; (1) direct measurement, (2) indirect measurement, and (3) use of simulation [32].
The first class is measuring electrical property such as electrical field (E), potential (V),
charge amount (Q), or electrostatic discharge rate after developing charges on the material by
standard treatments. These properties can be replaced by other indicators like electrical
resistance (R) or conductance for indirect measurement. Simulation method is observing the
behavior of textiles in a situation simulating the end-use for which they are intended.
Electrostatic field meter and electrostatic voltmeter can be used for the measurement
of electric field and potential on the surface of textile material, respectively. They can be
converted to charge density, charges per unit area, which represents the probability of an
electrical discharge. A field meter should be the only earthed object near the specimen, while
a voltmeter requires the contact of specimen as a dominant earth. Due to additional charge
19
Resistance is the property of a substance indicating how it resists the flow of an
electric current through it. Conductance is the reciprocal of resistance, and it refers the
property how the material allows current to flow through it when a potential difference is
applied. There has been a debate in previous research regarding the correct use of these
indirect indicators for textile application [14, 15, 28, 35]. They were still generally believed
to represent electrostatic properties [32].
Simulation tests have an approach focusing more on the end-use problems than
electrostatic properties. The most common forms are cling test and walking test. The former
observes cling behavior of textiles as an indicator of static property, and the latter is
observing static charges caused by walking action mainly on carpets.
2.2.2. Tester Development
As research on electrostatic properties in textiles made steady progress, developing
devices for electrostatic experiments became the focus of investigation. The limitations of
resistivity stimulated researchers to develop their own devices for charging and assessing
electrostatic. Resistivity, which had been accepted as an index of electric properties, was
claimed not to be appropriate for textiles because: (1) resistivity does not have any
information about the capacitance of the material, (2) textile material does not obey Ohm’s
Law, affected by residual voltages, (3) textile material is not homogeneous, especially for
composite materials, and (4) charge transfer is affected by adjacent earthed surfaces [13, 15].
Several electrostatic devices dedicated for charging and assessing static on textiles
20
Administration (NASA) Tribo-electric Tester [25], Shirley Method [48], John Chubb
Instrumentation (JCI) Tribo-charging Tester [15], Linear Tester [40], and Rubbing Tester
[40]. With different means of generating and dissipating charges on test specimens, the
devices are measuring electric properties under controlled parameters which have influence
on static characteristics of textiles.
Figure 2.3. NASA Tester [25] Figure 2.4. JCI Tester [15]
Gompf [25] described the tribo-electric method used at Kennedy Space Center by
NASA, which was developed by Dr. Webster of Pan American World Airways in 1960s. The
device, shown in Figure 2.3, basically consists of a grounded aluminum frame with two
cutouts. Test specimens are arranged on the grounded aluminum sample holder. Through the
upper left cutout, test specimens get charged by rubbing against soft wool, hard Teflon or
Teflon felt, mounted on the rubbing wheels operated by electric drive motor. In the lower
right cutout is the static detector head. Static detector head is expected to measure the
electrostatic field and it is transferred to dc voltage in the electrometer.
21
electrostatic properties of textiles in British Textile Technology Group (BTTG). While
NASA Tribo-electric Tester is designed only for measuring charge generated on the sample
by rubbing, Shirley Method observes charge and discharge characteristics. Additionally,
Shirley Method is concentrated upon the subject of spark and ignition caused by static
electricity.
In Shirley Method [48], test samples are mounted on the ring-shaped Perspex holders.
Sample holders are rested on Perspex table covered with the same materials that generate
charge on the samples. Rubbing material is either woven nylon or woven Teflon because of
their extreme positions in the tribo-electric series of textiles. Nylon and Teflon can generate
positive and negative potential, respectively, on any kind of textile materials. Wilson,
however, did not give enough explanation about how the charge generating process would be
achieved in the system. Illustration of external figures of the system was neglected, as well.
Figures presented are hardly recognizable and not helpful to understand the system.
Shirley Method [48] adopted a parameter of initial charge potential on the sample
surface as a charge property, measured after inserting the charged sample into the Faraday
cage. Discharging behavior is examined from the charge in a single spark and critical values
of the charge released in sparks for the ignition. Discharging from the charged samples is
inducted by bringing samples close to the electrode. The electrode system consists of various
sizes of sphere electrode with various sizes of core and stainless steel rod.
Chubb’s instrumentation [15], which is called as John Chubb Instrumentation (JCI) of
Figure 2.4, was made up of a base plate for holding a test specimen, a field meter for
22
cluster between the base plate and field meter. Below the base plate, there are either
open-backing or earthed-open-backing. JCI Tribo-charging Tester was greatly innovative from extant
testers above in terms of charge generation system. It raised charges on specimens by means
of corona discharge, not a rubbing process. He used the corona discharge between two
electrodes with high voltage for generating charge on test specimens and observed the initial
peak voltage and decay behavior during self-dissipation of charged samples.
While a test specimen starts getting charged from the corona discharge cluster,
moveable plate slides aside so that the charged specimen can be exposed to the field meter,
which converts field meter signal into the surface voltage of the specimen. The moveable
plate is withdrawn within 20 ms enough to prevent the charge redistribution on the specimen
surface. Initial peak voltage is caught when the moveable plate is fully removed and then the
specimen starts to discharge. Charge decay curve versus time can be obtained through
microcomputer.
Two new devices, which termed “linear Tester” and “Rubbing Tester”, to measure
static generation/dissipation on yarn and polymeric surfaces were developed at the College of
Textiles, NC State University [40]. Linear Tester is especially designed for measuring
potentials on linear type materials (yarn), and Rubbing Tester is for planar type materials
such as fabrics and films.
A schematic illustration of Linear Tester is shown in Figure 2.5. A yarn flows in a
path between the supply package and the winder (shown in the Figure 2.5) under controlled
speed and tension. As the yarn moves, it gets tribo-charged by means of the charge pin. Static
23
two spots on the yarn using two noncontact probes to prevent creating additional static
charge by contact. Each probe is connected to a voltmeter, which in turn is interfaced to a
standard data acquisition system.
Figure 2.5. Linear Tester [40]
Figure 2.6. Rubbing Tester [40]
Figure 2.6 is depicting the Rubbing Tester. The device is equipped with a sample
holder to mount the test sample. Rubbing material and noncontact probe are attached to a
24
were controlled by a computer program. Tribo-electricity between sample and rubbing
material is generated with the movement of servo table. The pressure between the rubbing
surface and the test sample was controlled by vertical motion of the rubbing surface and the
pressure is measured by a pressure transducer. The static generation/dissipation data were
automatically collected by a standard data acquisition system that is connected to a voltmeter
which is connected to the probe.
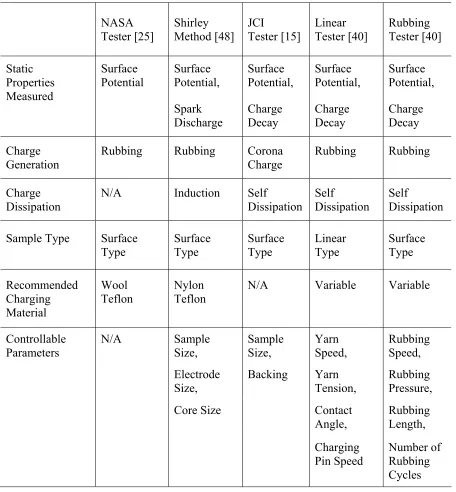
Electrostatic devices for textiles are compared in Table 2.4. NASA tester [25] is
pretty simple in design compared to other testers because it is the earliest one. Following
testers observe both charge and discharge characteristics, focused on unique parameters that
can affect the electrostatic properties of textile materials. Shirley Method [48] and JCI Tester
[15] are concentrating on the parameters related to the matter of sample size, while Linear
Tester [40] and Rubbing Tester [40] are studying the variation of rubbing motion. Shirley
Method is distinct from others in terms that it applies inducted charge dissipation, and so is
JCI Tester in terms that it applies corona charge generation.
2.3. Experimental Studies
The previous research can be classified to methodological, experimental, and
theoretical research. Methodological research is focused on comparing different apparatus or
suggesting an appropriate index for assessing electrostatic properties of textiles. The
experimental studies dealt with examination of how static properties of textiles are affected
by some parameters (parametric studies). Experimental studies also dealt with the use of
25
Theoretical research conducted to establish a universal tribo-electric theory by making
plausible explanations on empirical observations of static charge transfer.
Table 2.4. Comparison between Capabilities of Electrostatic Devices
NASA
Tester [25] Shirley Method [48] JCI Tester [15] Linear Tester [40] Rubbing Tester [40]
Surface
Potential Surface Potential, Surface Potential, Surface Potential, Surface Potential, Static Properties Measured Spark Discharge Charge Decay Charge Decay Charge Decay Charge Generation
Rubbing Rubbing Corona Charge
Rubbing Rubbing
Charge Dissipation
N/A Induction Self Dissipation
Self
Dissipation
Self Dissipation
Sample Type Surface Type Surface Type Surface Type Linear Type Surface Type Recommended Charging Material Wool Teflon Nylon Teflon
N/A Variable Variable
Controllable Parameters
N/A Sample Size, Sample Size, Yarn Speed, Rubbing Speed, Electrode Size,
Backing Yarn Tension,
Rubbing Pressure,
26 2.3.1. Development of Devices
Gompf et al. [24] analyzed the correlation of static properties measured using
different electrostatic testers/methods. They compared NASA tribo-electric tester, the
modified Shirley method, and the JCI tribo-charging tester. The testers use wool and Teflon
as a charging material, except JCI tester which apply corona charging technique. The data
generated from the three testers/methods of different materials were used to rank the
materials from the highest generator to the lowest. Material ranking is shown in Table 2.5.
Spearman ranking correlation coefficients between NASA tester and Shirley method were
good (93%) with Teflon, but unacceptable (43%) with wool. The correlation coefficient
between NASA tester and JCI tester was reasonable (73%) when Teflon was used as a
charging material for NASA tester.
The lower correlation between the tests using wool might be owing to unexpected
variability of natural fibers. For a given test material, Teflon was found to raise more
electricity than wool. Additionally, test results reproducibility was higher in case of using
Teflon than wool. From the data, Gompf et al. [24] believed that it was possible to reliably
rank textile materials in their static properties. However, the fact that experimental results
from different devices are not exactly matched (Table 2.5) still represents the dependence of
static generation on instrument used.
Chubb [13] also compared eight kinds of charge decay measurement methods in use
for charge decay measurement. They were Corona Charge Decay, Federal Test Standard
(FTS) 101C, ITV-TEV method, NASA tester, Shirley Method 20, Scuff-charging method,
27
Method 20, STFI, and CPM) were judged not to be appropriate for assessing charge decay
property. NASA tester, Scuff-charging, and ITV-TEV method, which are based on
tribo-electrification, were hard to control the charge generation and not available for commercial
use. Only corona charging decay gave results matched with tribo-charging and had
commercial availability.
Table 2.5. Material Ranking for Each Test Method at 25% Relative Humidity [24]
NASA Tester Shirley Method Material
Wool Teflon Wool Teflon JCI Tester
PPC8* 6 4 7 4 2
PPC11* 7 6 4 6 3
PPC12* 5 5 3 5 5
PPC17* 8 8 5 8 8
PPC20* 9 9 9 9 7
PPC24* 4 7 8 7 3
PPC27* 1 1 6 3 1
XP1* 2 2 2 2 No Data
XP2* 3 3 1 1 6
*PPC8 *PPC11 *PPC12 *PPC17 *PPC20 *PPC24 *PPC27 *XP1 *XP2
Polyester clean-room fabric with 20mm conductive stripe Polyester/cotton fabric with 10mm conductive grid Polyester/cotton fabric with blend of conductive fibers 100% cotton with flame retardant finish
100% aramid
Aramid with ore conductive fiber
Polyurethane coated fabric with antistatic finish Black plastic storage bag
28 2.3.2. Previous Studies on Yarns and Fibers
Nidonova et al. [37] studied the effect of yarn speed and preload on frictional and
electrostatic properties of Capron® yarns. Yarn speed was varied in the range of 0~30 m/min,
and preload range was 0~30 gf. The experiments ran under a standard condition of 20 ±
0.5 °C and 62 ± 1% R.H. was used. Frictional coefficient and static charge increased with the
speed of the yarn, while the influence of preloads was negligibly small.
Ukraintseva et al. [47] dealt with polyamide yarns coated with electrically conducting
component of carbon black. Sample yarns were different in terms of linear density (10 tex
and 25 tex), and carbon black content (15%, 35%, 60%). Electrical potential and current was
monitored. It was reported that the thinner was the yarn and the more conductive particles
were on the yarn surface, the lower was the potential which meant possibility of the static
risk became less.
Berberi [10] investigated the dependency of electrical resistivity on the form of textile
structure and manufacturing process. Electrical resistivity of fabric, yarn, and cut yarn were
compared and found to be about the sa3me value regardless of the form. Measurement of
electrical resistivity of fibers and yarns was assessed after each process for fibers and yarns
from Greek cotton, USA cotton, and un-dyed and black-dyed wool. USA cotton which was
affected by sugar disease appeared to have a lower resistivity than Greek cotton. Cotton got
higher resistivity as the processing went on. Especially, the resistivity appeared to have a
rapid increase during opening and carding. The reason of increasing resistivity of cotton is
the layer of wax on the surface, which was damaged during processing. Wool was getting
29
washing and cleaning. For both dyed and un-dyed wool, spin finishing, which have antistatic
effect, was applied after dyeing and for un-dyed wool the spin finish was applied before
blending. Un-dyed wool lost the effectiveness of spin finish during blending (which was
done after application of spin finish), while dyed wool lost the effect of spin finish gradually
as it moved from process to another. Therefore, it was proved that spin finish was not
necessary for un-dyed wool. However, Berberi did not explain whether blending would be
difficult as a result of skipping spin finish.
2.3.3. Previous Studies on Material Surfaces
Chubb [14] introduced ‘charge decay time’ and ‘capacitance loading’ as a new index
replacing resistivity for assessing electrostatic properties of textile material. Charge decay
time is how quickly charge can migrate away, whereas capacitance loading indicates how the
surface potential is limited by the nature and structure of materials. Electrostatic-safe
materials are supposed to have short decay time and high capacitance loading. Charge decay
time and capacitance loading were calculated from tribo-charging test and corona charging
test (JCI tester). Tribo-charging test is operated by scuffing the center of a round sample (200
mm in diameter) with a charge neutral Teflon rod. Tribo-charging can be used to validate
charge decay time and capacitance loading based on corona charging. Charge decay time was
measured by the time from the initial peak voltage (Vpk) to Vpk/e. Capacitance loading was obtained from the ratio of the field meter observation without test material to the observation
with the test material for tribo-charging test, and by comparing voltage measurements of the
30
In tribo-charging test, capacitance loading was independent from the quantity of
charge generation. Also, in corona charging test, capacitance loading values and decay times
did not vary much with the quantity of charge. As relative humidity increased, capacitance
loading showed an increase, but charge decay times decreased with different degrees
according to sample types. When comparing tribo-charging tests to corona charging tests,
ranking orders for capacitance loading and charge decay time were very similar, although
capacitance loading often showed higher values in corona charging.
Diaz et al. [18] combined four tribo-electric series from literatures [1, 16, 27, 29].
Common materials in each series were lined up for comparison, and results of charge were
incorporated to support the rank. In tribo-electric series, materials at higher positions get
positive charges after the contact with a material at a lower position. Diaz et al tribo-electric
series and charge data of textile materials are given in Table 2.6. Natural fibers got charged
in the range 0.6 - 1.1 pC, whereas synthetic fibers were charged with wider ranges. How
functional groups in polymer structures might have affected electrostatic properties was
speculated. The nitrogen containing polymers developed the most positive charges, and
halogenated polymers established the most negative charges. Polymers with oxygen
functional groups were charged positive, but lower than those with nitrogen groups.
Hydrocarbons generated almost no charge.
Ohara et al. [38] constructed a tribo-electric series of atomic groups with the view
that atomic groups in the molecules can affect the polymers’ electrification properties.
Polymer films such as nylon 6 (Ny), polycarbonate (PC), polypropylene (PP), polystyrene
31
polyvinylchloride (PVC) were studied. The Langmuir-Blodgett method enabled a specific
polar group to be bonded to the same kind of hydrocarbon chain. Three Langmuir-Blodgett
films such as stearic acid (ST) with COOH group, stearylamine (SAN) with CH2NH2 group, and stearamide (SAD) with CONH2 group were constructed. Triboelectric series is shown in Table 2.7. Langmuir-Blodgett films were observed to have higher charge than the polymer
films with corresponding polar groups because of higher molecular density. For example, ST
having same atomic group (−COO) to PMMA showed larger electrification voltage than
PMMA. Due to the influence of oxygen in SAD, opposite polarity was observed on SAD and
SAN, although they share amino groups (NH2) which electrifies a material positively. It was possible to make a tribo-elecric series of atomic groups for –CONH2, –COOH, and –CH2NH2, but this issue needed to be studied more in terms of interactions between inside atomic
groups.
Table 2.6. Summarized Tribo-electric Series [18]
Fiber Type Charge (pC)
against Gold Functional Group
Polyamide (Nylon) +1.2 Nitrogen
Wool, Silk +0.6 ~ +1.1 Nitrogen, Oxygen
Cotton +0.15 ~ +0.19 Oxygen
Acetate, Rayon +0.14 Oxygen
Polyester (Dacron) +0.1 Oxygen
Polyethylene, Polypropylene ~ 0 Hydrocarbons
32
Table 2.7. Tribo-electric Series (against Glass) [38]
(+) Positive Negative (−)
For Polymer Films Ny, PMMA, PC, PP, PS, PET, PVC
For Langmuir-Blodgett Films SAN, ST, SAD
For Atomic Groups − COOH, − CH2NH2, − CONH2
Akande and Adedoyin [3] tried to explain contact charge transfer between polymers
and metals using metal work function. Work function is the minimum energy needed to
remove an electron from a solid surface to an outside point. Charge density and the metal
work function were observed between metals and three polymer films (UV-radiated
polystyrene, polymethyl-methacrylate, and poly(2-vinylpyridine)). Experimental results
indicated that charge transfer was influenced by the metal work function, but there was no
simple universal relationship between charge transfer and work function. This was coincided
with Elsdon and Mitchell’s research [22] claiming that metal work function has no
systematic effect on charge transfer. This was confirmed once more by a later study by
Akande [2].
2.3.4. Fabric containing Conductive Yarns
Paasi et al. [39] studied an appropriate test method for evaluating electrostatic
discharge protective garments. Evaluation was achieved by measuring peak current and
transferred charge during the dissipation because damage caused by electrostatic is usually
![Table 2.1. Equations for the volume and surface resistivity / conductivity (ASTM) [7]](https://thumb-us.123doks.com/thumbv2/123dok_us/1718765.1218884/23.612.100.530.183.394/table-equations-volume-surface-resistivity-conductivity-astm.webp)
![Figure 2.1. ESD Electrode [19, 20]](https://thumb-us.123doks.com/thumbv2/123dok_us/1718765.1218884/25.612.163.468.374.592/figure-esd-electrode.webp)
![Figure 2.2. Rotating Vane (top) and Vibrating Sensor Field Meter (bottom) [8]](https://thumb-us.123doks.com/thumbv2/123dok_us/1718765.1218884/30.612.113.521.124.352/figure-rotating-vane-vibrating-sensor-field-meter-bottom.webp)
![Figure 2.3. NASA Tester [25]](https://thumb-us.123doks.com/thumbv2/123dok_us/1718765.1218884/36.612.96.540.208.414/figure-nasa-tester.webp)
![Table 2.5. Material Ranking for Each Test Method at 25% Relative Humidity [24]](https://thumb-us.123doks.com/thumbv2/123dok_us/1718765.1218884/43.612.102.523.242.614/table-material-ranking-test-method-relative-humidity.webp)
![Table 2.6. Summarized Tribo-electric Series [18]](https://thumb-us.123doks.com/thumbv2/123dok_us/1718765.1218884/47.612.108.523.436.666/table-summarized-tribo-electric-series.webp)
![Figure 2.7. Energy Levels in Metals (top), and in Metal and Insulator (bottom) [36]](https://thumb-us.123doks.com/thumbv2/123dok_us/1718765.1218884/53.612.101.531.317.578/figure-energy-levels-metals-top-metal-insulator-bottom.webp)
