Copyright2000 by the Genetics Society of America
A Simple Sequence Repeat-Based Linkage Map of Barley
L. Ramsay,* M. Macaulay,* S. degli Ivanissevich,
†K. MacLean,* L. Cardle,* J. Fuller,*
K. J. Edwards,
‡S. Tuvesson,
§M. Morgante,
†A. Massari,** E. Maestri,** N. Marmiroli,**
T. Sjakste,
††M. Ganal,
‡‡W. Powell* and R. Waugh*
*Unit of Genomics, Scottish Crop Research Institute, Invergowrie, Dundee DD2 5DA, Scotland,†University of Udine, Udine I-33100, Italy, ‡IACR, Bristol BS41 9AF, United Kingdom,§Svalo¨f Weibull, Svalo¨v S-268 81, Sweden,**Department of Environmental Sciences,
University of Parma, Parma I-43100, Italy,††Plant Genetics Laboratory, University of Latvia, Salaspils LV-2169,
Latvia and‡‡IPK, Gatersleben D-06466, Germany
Manuscript received January 20, 2000 Accepted for publication August 24, 2000
ABSTRACT
A total of 568 new simple sequence repeat (SSR)-based markers for barley have been developed from a combination of database sequences and small insert genomic libraries enriched for a range of short simple sequence repeats. Analysis of the SSRs on 16 barley cultivars revealed variable levels of informativeness but no obvious correlation was found with SSR repeat length, motif type, or map position. Of the 568 SSRs developed, 242 were genetically mapped, 216 with 37 previously published SSRs in a single doubled-haploid population derived from the F1of an interspecific cross between the cultivar Lina andHordeum
spontaneumCanada Park and 26 SSRs in two other mapping populations. A total of 27 SSRs amplified multiple loci. Centromeric clustering of markers was observed in the main mapping population; however, the clustering severity was reduced in intraspecific crosses, supporting the notion that the observed marker distribution was largely a genetical effect. The mapped SSRs provide a framework for rapidly assigning chromosomal designations and polarity in future mapping programs in barley and a convenient alternative to RFLP for aligning information derived from different populations. A list of the 242 primer pairs that amplify mapped SSRs from total barley genomic DNA is presented.
B
ARLEY (Hordeum vulgare L.) is one of the most The development of SSR markers for barley has fol-lowed a common pattern with the first few derived from important crop species in the world and has beensubject to considerable genetic study. It is a diploid sequences held in public databases (Saghai Maroofet al.1994;Becker and Heun 1995). This has been fol-(2n ⫽ 2x ⫽ 14), largely self-fertilizing species with a
large genome of 5.3⫻109bp/1 C (BennettandSmith lowed by the screening of small insert genomic libraries
for SSR motifs (Liu et al. 1996; Struss and Plieske
1976). Detailed restriction fragment length
polymor-phism (RFLP) linkage maps have been developed 1998). Sixty-four barley SSRs are in the public domain at present. This limited progress indicates that SSR isola-(Graneret al.1991;Kleinhofs et al.1993) and these
have allowed the close syntenic relationship between tion and characterization from plants is not trivial and that effective strategies that increase the efficiency of barley and the three genomes of wheat to be elucidated
(Namuthet al.1994;Dubcovskyet al.1996). The ge- the SSR discovery and development phase need to be devised. While a number of approaches have been de-netic advantages of working with a self-compatible true
diploid, together with the availability of a large number scribed (Ostranderet al.1992;Edwardset al.1996), one strategy that has not featured heavily in plant SSR of genetic stocks and its considerable economic
impor-tance, have resulted in barley being proposed as a model discovery programs in the scientific literature is the use of libraries enriched for particular SSR motifs.
for the entire Triticeae (Linde-Laursen et al. 1997).
Although first-generation maps have proved extremely Here we report the discovery, characteristics, develop-ment, and linkage mapping of 568 new barley SSRs from informative, particularly in comparative mapping within
the Triticeae and with other Graminae (Moore et al. enriched small insert libraries and from new sequences in the public databases. Using these markers, we have 1995; Sherman et al. 1995), the hybridization-based
markers deployed in these studies have genetical and derived a second-generation linkage map of barley using only single-locus/low-copy PCR-based markers. practical disadvantages, particularly in the context of
applied agricultural research. This has led to consider-able interest in PCR-based markers, in particular those
MATERIALS AND METHODS
based on simple sequence repeats (SSR).
Plant material:The variety Blenheim was used as the DNA source for the construction of all the libraries with the excep-tion of two later libraries enriched for (AG)n, which were
Corresponding author:Robbie Waugh, Unit of Genomics, Scottish
constructed using DNA from the varieties Blenheim, Livet, Crop Research Institute, Invergowrie, Dundee DD2 5DA, Scotland.
E-mail: [email protected] Igri, and Franka. For most SSRs, a panel of 16 barley lines
was used for screening for polymorphism. These lines formed Polymerase chain reaction and fragment analysis:PCR reac-tions were performed in a total volume of 10l and consisted the parents of 10 mapping populations and included 8 spring
barleys, Golf, Alexis, Vada, Lina, Blenheim, E224/3, Aura, of 20 ng genomic DNA, 1⫻PCR buffer, 0.3 unitsTaq polymer-ase (both from Boehringer-Mannheim, Indianapolis), 0.3m and Regatta; 6 winter barleys, Puffin, NSL91-6319, Plaisant,
Dicktoo, Igri, and Franka; and twoHordeum spontaneumacces- of forward and reverse primers, 200mdNTPs, and 0.5Ci of [␣-32P]dCTP and were run on a PE 9600. The optimized PCR
sions, 1-B-87 and Canada Park. In addition, 86
doubled-hap-loid (DH) lines, derived from the F1’s of crosses between cycling conditions varied and the conditions that amplified the
strongest product of the expected size on a 1.5% agarose gel Lina⫻H. spontaneumCanada Park (Waughet al.1996), were
used for mapping. DNA from all the above lines was extracted were utilized in our mapping studies, which were carried out as described byMorganteet al.(1994). After PCR an equal from 3-wk-old leaf material using the CTAB method (Saghai
Maroofet al.1984). volume of 95% formamide electrophoresis loading buffer was added to the samples, which were then denatured, snap cooled Exceptions to the above were the SSRs tested at IPK. These
were tested against a panel of nine barley lines: three H. on ice, and electrophoresed in 6% Easigel (Scotlab) according to standard procedures. An M13 sequencing marker was run spontaneum lines, HS 213, 277, and 584, provided by the
Bundesforschungsanstalt fu¨ r Zu¨ chtungsforschung (Aschers- to estimate product sizes and gels were double loaded for mapping studies where possible. Visualization of results was leben, Germany) and the varieties Brenda, Trasco, Steptoe,
Morex, Igri, and Franka. Polymorphic SSRs were mapped in achieved by exposure of fixed, dried gels to X-ray film. At IPK, fragment analysis was performed using an automated laser the two populations derived from these last four varieties
(Graneret al.1991;Kleinhofset al.1993). fluorescence sequencing machine, as described inRo¨ deret al.(1998b). The quality of the PCR products was rated on a SSR isolation and characterization: SSR-containing DNA
sequences were derived from public access sequence databases scale of 1 to 5, followingSmulderset al.(1997). Details of the mapped primer pairs and the PCR amplification condi-and from enriched libraries. The database-derived SSRs were
obtained by searching the Hordeum sections of EMBL and tions used are given in Appendixes S1 and S2, respectively, available at the Genetics supplemental data site at http:// GenBank for sequences containing microsatellites, using the
find-patterns program in the Wisconsin GCG package. The www.genetics.org/supplemental/156/4/1997/DC1.
In addition, primers designed to SSRs already published data file included all possible mono-, di-, tri-, tetra-, penta-,
and hexanucleotide repeats: (N)15, (NN)7, (NNN)5, (NNNN)4, were synthesized or obtained as designated “Barley map pairs”
from Research Genomics (Huntsville, AL). Finally, two wheat (NNNNN)4, and (NNNNNN)4. In addition, the sputnik
pro-SSRs, WMS6 (Ro¨ deret al.1995) and WMC1E8 from the wheat gram (C. Abajian, University of Washington, http://www.
microsatellite consortium library (P. Isaac,personal commu-abajian.com/sputnik/) was used to double-check the above
nication) were utilized, as was a single SSR (Bmatc0001) de-results and extract imperfect repeats. Seventeen
database-rived from a small insertlibrary (courtesy of J. R. Russell). derived SSRs, which had already been published (Saghai
Parental line screening and linkage analysis:The frequen-Maroofet al.1994;BeckerandHeun1995;Liuet al.1996;
cies of the alleles within the barley lines screened were used Petersen and Seberg 1998), were excluded from further
to calculate diversity indices (DI) estimated as 1⫺Rpi2, where
analysis. The database-derived SSRs were named after the
piis the frequency of the ith allele in the given population
EMBL name for the sequence containing the repeat.
(Weir1990). A total of nine enriched small insert DNA libraries were
Linkage analysis in the Lina⫻H. spontaneumCanada Park constructed using a method based on a single-stranded DNA
population was carried out by combining the SSR data with hybridization selection (A. RafalskiandM. Morgante,
per-existing amplified fragment length polymorphism (AFLP) sonal communication). The libraries were based upon
data and performed using Joinmap (v 2.0; P. Stam and J. W. Tsp509E digestion of barley DNA and were enriched for
Van Ooijen, CPRO-DLO, Wageningen, The Netherlands). (AC)n⫻3, (AG)n⫻3, (AAC)n, (ACC)n, and (ATC)n. Details
The linkage groups were separated using a LOD score of 5.0. of the enrichment procedure used for all the libraries and
the cloning procedure usingZAP II, used for seven of the libraries, are given inRamsayet al.(1999). Two later (AG)n
libraries used the plasmid pUC19 vector for ease of handling. RESULTS
In addition to these libraries, 50 clones from an enriched
SSR isolation and characterization:The 10 enriched
microsatellite library, constructed according to Edwards et
libraries used within this study showed some variation
al.(1996), were examined. The enrichment procedure used
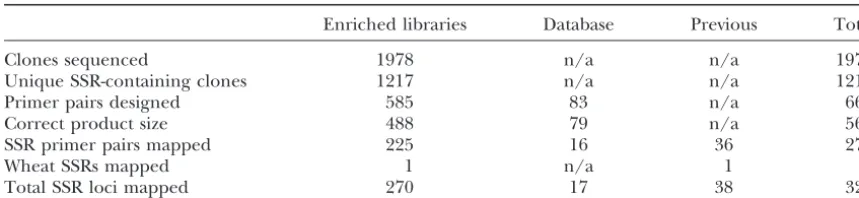
was different from that detailed above, with the use of RsaI in the degree of enrichment and duplication. Table 1 restriction digestion and multiple bound oligonucleotides en- shows the total number of clones sequenced and the riching for DNA fragments hybridizing to (AT)15, (GA)15, final number of working primer pairs that amplified a
(GC)15, (GT)15, (ATT)10, (CAA)10, (GCC)10, (ATAG)10,
product of the expected size giving an overall attrition
(CATA)10, and (GATA)10. SSRs, isolated from genomic
librar-rate of 24.7% (488/1978). Typically, the number of
ies, were titled Bm (barley microsatellite) or EBm (E to
repre-sent those originating from EU FAIR CT95-0003), followed sequences containing an SSR repeat representedⵑ10%
by the respective repeat motif and a consecutive four-digit of the recombinant clones screened (i.e., for one library,
number. 204 fromⵑ3000 screened), which is anⵑ50-fold
enrich-Sequence checking and primer design: The systematic
ment compared to the results ofLiuet al.(1996). The
checking of the sequences, against an in-house database of
level of duplication within the libraries generally
be-SSR-containing clones using BLASTN (Altschulet al.1997),
allowed the identification of duplicates at an early stage. In came unacceptable after sequencingⵑ180–200 clones.
addition, searches against this and public databases, using Most duplication was to clones produced within the FASTA (Pearson1990), screened out sequences that showed same library, but subsequent libraries also contained a homology to known repetitive elements prior to primer design
proportion (ⵑ2.5%) of clones found in independently
(Ramsay et al. 1999). Primers were designed to sequences
constructed libraries.
flanking SSRs using the computer program PRIMER (v 0.5
TABLE 1
Attrition rate in the development of working SSR primer pairs
Enriched libraries Database Previous Total
Clones sequenced 1978 n/a n/a 1978
Unique SSR-containing clones 1217 n/a n/a 1217
Primer pairs designed 585 83 n/a 668
Correct product size 488 79 n/a 567
SSR primer pairs mapped 225 16 36 278
Wheat SSRs mapped 1 n/a 1 2
Total SSR loci mapped 270 17 38 325
n/a, not applicable.
containing SSR motifs were isolated from a total of 1978 amplified with primer pairs derived from some of these clones early on in this study, SSR-containing sequences, sequenced clones. Of these, 632 contained either too
little flanking DNA sequence to design compatible which showed homology to retroelements, were subse-quently not used for primer design.
primer pairs or were found in the later libraries to show
homology to retroelements. This meant that 585 primer Quality of SSR markers:Following primer design and confirmation of product size on agarose gels, the SSRs pairs were designed to the unique sequences, 488 of
which gave products of the expected size, giving an were visualized using radioactive labeling and denatur-ing-PAGE electrophoresis. The quality of the PCR prod-attrition rate of 24.7% (488/1978). These 488 primer
pairs, together with the 79 new database-derived SSRs ucts was rated on a decreasing scale of 1–5 following
Smulderset al.(1997; seeStephensonet al.1998). Of and the wheat SSR WMC1E8, bring the total to 568.
Seven of these (Bmac0018, Bmac0030, Bmac0032, 535 primer pairs for which data were generated, 364 (68%) were placed in the top two classes. SSR analysis Bmac0040, Bmac0064, Bmac0090, and Bmac0399) have
been published in an earlier study (Russellet al.1997) of the 16 barley lines revealed variable levels of informa-tiveness. The DI values derived from screening these under a slightly different nomenclature (as BMS18,
BMS30, BMS32, BMS40, BMS64, BMS90, and BMS02, lines and the quality scores are given in Appendix S1 at http://www.genetics.org/supplemental/156/4/1997/ respectively).
Working SSRs were derived from all libraries with the DC1. No significant differences were found between the DI values of SSRs derived from different libraries or exception of the library enriched for (AAC)n repeats,
where the repetitive structure of the sequences pre- different repeat types or SSRs mapping to different re-gions of the genome. Some correlation (r⫽0.46) was cluded successful primer design. All 568 SSRs, together
with the 63 already published, were categorized ac- found between DI value and repeat number but only when analysis was restricted to simple perfect dinucleo-cording to repeat length, composition, and type. A
com-parison of the repeat lengths of dinucleotide SSRs in tide repeats.
Linkage mapping:Segregation data derived from 253 clones from the enriched librariesvs.dinucleotide SSRs
derived from unenriched libraries or databases showed SSR primer pairs (216 new and 37 previously pub-lished), which were polymorphic in the Lina⫻H.
spon-that the repeats found in the enriched libraries were
significantly longer (22.7⫾1.7 compared to 12.4⫾1.8 taneumCanada Park population, were entered alongside a collection of segregating AFLP alleles and the data repeats). Categorization of the SSRs, according to motif
type, allowed a comparison of numbers of perfect/im- set submitted for analysis using Joinmap (v 2.0). Seven linkage groups corresponding to the seven barley chro-perfect and simple/compound repeats in the various
libraries. A significant difference was found between mosomes were separated initially at a LOD score of 5.0 (Figure 1). The genetic map generated had a total map the proportions of simple/perfect repeats found in the
libraries enriched for the two dinucleotide motifs. Only length of 1173 cM and showed strong segregation distor-tion around the centromeric region of chromosome 40% of SSRs from the (AC)n-enriched libraries were
simple/perfect repeats compared with 76% of SSRs 2H. Chromosome designation and polarity were in-ferred from a combination of AFLPs (Waugh et al.
from the (AG)nlibraries.
Sequence comparisons with publicly held databases 1997) and previously mapped SSRs (BeckerandHeun
1995;Liuet al.1996). Subsequent confirmation of link-highlighted homologies between a significant
propor-tion of the dinucleotide SSR-containing clones to several age group designations came from isozyme data for
␣- and -amylase, and mapping of SSRs from known cereal retroelements. This work has been reported in
Ramsay et al. (1999). Similar homologies were also sequences, which had previously been mapped as RFLP, such as HVLOX and HVOLE. A total of 299 SSR loci found for the libraries enriched for (ACC)nand (ATC)n.
Can-Figure1.—Molecular linkage map of barley derived from the Lina⫻H. spontaneumCanada Park population. Linkage groups are orientated with short arms at top. The SSR loci are indicated in boldface type with other framework markers prefixed by an asterisk. Multiple loci are indicated by the presence of a lowercase suffix to the SSR name. Cosegregating SSRs are placed to the right and the approximate positions of SSRs mapped in other populations are given to the left of the linkage groups.
ada Park map (261 from new and 38 from previously exception of HVM 63, which mapped to the centromeric region of chromosome 2H but not chromosome 1H. In published primer pairs). This total included multiple
loci amplified from 27 of the primer pairs (26 new addition, in this population, HVM 11 detected two loci on chromosome 7H as well as 6H as found byLiuet al.
and 1 previously published). In addition, 26 single-locus
SSRs were mapped in other populations, 22 in the Step- (1996). HVM 64 and HVM 31, which were previously only assigned to chromosomes 1H and 6H by the use toe⫻Morex, and 4 in Igri⫻Franka populations. Thus,
in total, 39, 56, 45, 46, 37, 38, and 64 (i.e., 325) SSR of addition lines, were mapped intrachromosomally to the same groups.
loci have been mapped to chromosomes 1H–7H,
respec-tively. The most prominent feature of the map is the strong
clustering of SSR loci around the centromeric regions All previously mapped SSRs (BeckerandHeun1995;
Figure1.—Continued.
Liuet al.(1996). As a result of the clustering, genome chromosome 6H, there is an expansion of a centromeric cluster of four markers in a 4-cM interval to 17 cM. coverage with SSRs remains incomplete with an obvious
lack of markers on the long arms of chromosomes 1H and 5H and short arm of chromosome 6H. The gaps
DISCUSSION
observed in the Lina⫻H. spontaneumCanada Park map
on 5H and 6H correspond to gaps on other published We have developed 568 new SSR primer pairs (micro-satellites) for barley, 242 of which have been mapped maps (Kleinhofset al.1993).
The use of previously mapped SSRs also allowed the to date (Appendix S1 at http://www.genetics.org/ supplemental/156/4/1997/DC1). A list of new unmap comparison of their segregation with the results
pre-sented inLiuet al.(1996) in aH. vulgare⫻H. vulgare ped SSRs is available in Appendix S3 online at http:// www.genetics.org / supplemental / 156 / 4 / 1997 / DC1. cross (Steptoe ⫻ Morex). On chromosome 4H, HVM
14 and HVM 65 are linked without recombination in The 568 new SSRs, together with the 64 already pub-lished (Becker and Heun 1995;Liu et al.1996;
Pet-Lina⫻ H. spontaneum Canada Park but this region is
Figure1.—Continued.
mean that there are now 632 barley SSRs in the public as these proportions are similar to those reported by
Struss andPlieske (1998) in an unenriched library. domain.
The sequences obtained in this SSR discovery pro- Interestingly, such proportions have been reported in Eucalyptus (Brondaniet al.1998), implying that they gram suggest that the enrichment procedure biases the
recovery of certain repeats given the level of duplication reflect a fundamental difference in the character and evolution of these dinucleotide repeats in plant ge-within and between libraries and the preferential
selec-tion of larger repeats. To minimize redundancy, either nomes.
An unexpected feature of the clones from the en-different enzymes or en-different cultivars should be used
for additional libraries. The different proportions of riched libraries was sequence homology in a high pro-portion (ⵑ40%) of them, in one or both flanking re-simple/perfect repeats in the (AC)nand (AG)nlibraries
However, sometimes the scores were improved dramati-cally by redesigning or end-labeling the primers or by running the gels under highly denaturing conditions (20% formamide). For genotyping applications, we would strongly recommend using only the top two classes and optimizing all of the parameters to ensure accurate and reproducible results. For linkage studies using doubled-haploid populations, we were able to re-producibly monitor the segregation of amplified alleles in all classes. However, it is possible that the association of repetitive elements with SSRs in barley may produce additional loci in nonhomologous positions in crosses using different germplasm. This complication may be avoided by the use of a core framework set of SSRs with a high quality score.
The linkage map of the Lina⫻H. spontaneumCanada Park population presented here represents a second-generation linkage map, derived using only low/single-copy PCR-based markers. The total map length of 1173 cM (Kosambi) is comparable with that observed in other DH populations (Graneret al. 1991;Kleinhofset al.
1993;Thomaset al.1995;Heunet al.1996). Segregation distortion, as shown around the centromeric region of 2H, is common in doubled-haploid populations (Graner et al.1991) and does not appear to be a unique feature of this cross (H. vulgare⫻H. spontaneum). One prominent feature of the genetic linkage map is the significant clustering of the SSRs around the centromeric regions of each linkage group. This could be due to a nonran-dom physical distribution of SSRs due to an association with retroelements (Ramsayet al.1999) or the preferen-tial selection of longer SSRs (Areshchenkova and
Ganal 1999). While this possibility cannot be dis-counted, the observed genetic distribution is most likely influenced by the distribution of recombination events in the mapping population. Indeed the strong cluster-ing may have been exaggerated given the interspecific nature of the mapping population. Differences in the distribution and number of chiasmata in wide crosses affect the distribution of mapped marker loci ( Messeg-ueret al.1991) and it is possible that this phenomenon
for this interpretation comes from the clustering of SSRs that from ecological and biodiversity studies in barley. Most importantly, their PCR-based nature will provide mapped in intraspecific crosses (Liu et al. 1996) and
from other marker types also mapped in the Lina⫻H. nonmolecular geneticists with a simple and informative assay for estimating the level of variation at specific
spontaneumCanada Park population (data not shown).
In barley, EcoRI- and PstI-derived AFLPs exhibit a dis- regions of the barley genome.
junct distribution, with the distribution of the latter The authors acknowledge the Biotechnology and Biological Sci-more akin to that found withPstI genomic DNA probes ences Research Council grant PAG04430, which provided funding for M. Macaulay; the European Union grant FAIR-CT95-0003 for
in RFLP analysis (Powellet al.1997).
funding for L. Ramsay, S. degli Ivanissivich, and A. Massari; and the
The use of low-copy genomic probes to construct the
Scottish Executive Rural Affairs Department, which supports R.
first-generation RFLP-based linkage maps in the Triti- Waugh, W. Powell, K. MacLean, and J. Fuller through “core”-funded ceae largely avoided the problem of the extreme varia- research. K. J. Edwards is supported by the Biotechnology and Biologi-tion in the ratio of genetic to physical distance, as such cal Sciences Research Council, and T. Sjakste and M. Ganal by the Deutsche Forschungsgemeinschaft (436 LET 17/4/98) and the
Ga-sequences are mostly present in the distal unmethylated
tersleben Plant Genome Resource Center (PGRC).
gene and recombination-rich regions of the genome (Moore et al. 1993). Improved SSR coverage could therefore probably be achieved by the use of enriched
LITERATURE CITED
libraries constructed using methylation-sensitive
en-zymes, although this would not completely eliminate Altschul, S. F., T. L. Madden, A. A. Schaffer, J. Zhang, Z. Zhang
et al., 1997 Gapped BLAST and PSI-BLAST: a new generation
the problem of centromeric clustering (Ro¨ der et al.
of protein database search programs. Nucleic Acids Res.25:3389–
1998a,b). However, a more targeted approach based 3402.
Areshchenkova, T.,andM. W. Ganal,1999 Long tomato
microsa-upon the screening or sample sequencing of selected
tellites are predominantly associated with centromeric regions.
clones from large insert libraries could provide better
Genome42:536–544.
coverage with fewer SSRs (Cregan et al.1999;Cardle Becker, J.,andM. Heun,1995 Barley microsatellites: allele variation
and mapping. Plant Mol. Biol.27:835–845. et al.2000).
Bennett, M. D.,andJ. B. Smith,1976 Nuclear DNA amounts in
This study revealed only a weak correlation between
angiosperms. Philos. Trans. R. Soc. Lond. Ser. B274:227–274.
polymorphism and SSR repeat length (Innanet al.1997; Brondani, R. P. V., C. Brondani, R. TarchiniandD. Grattapaglia,
1998 Development, characterization and mapping of
microsa-Smulders et al. 1997) and no obvious correlation
be-tellite markers inEucalyptus grandisandE. urophylla.Theor. Appl.
tween polymorphism and SSR map position relative to
Genet.97:816-827.
the centromere, unlike low-copy RFLP in Aegilops Cardle, L., L. Ramsay, D. Milbourne, M. Macaulay, D. Marshall
et al., 2000 Computational and experimental characterization
(Dvora´ket al.1998). Although this lack of correlation
of physically clustered simple sequence repeats in plants. Genetics
could be due to the small population sample used,
156:847–854.
Innanet al.(1997) similarly failed to find such a relation- Cregan, P. B., J. Mudge, E. W. Fickus, L. F. Marek, D. Daneshet
al., 1999 Targeted isolation of simple sequence repeat markers
ship between polymorphism and locus position using
through the use of bacterial artificial chromosomes. Theor. Appl.
SSRs on a range of ecotypes of Arabidopsis. This implies
Genet.98:919–928.
that the high mutation rate of SSRs is sufficient to over- Dubcovsky, J., M.-C. Luo, G.-Y. Zhong, R. Bransteitter, A. Desai
et al., 1996 Genetic map of diploid wheat,Triticum monococcum
come the linkage disequilibrium maintained in
recom-L., and its comparison with maps ofHordeum vulgareL. Genetics
bination-poor regions of the genome and that the use
143:983–999.
of SSRs would thus increase the chances of finding poly- Dvora´k, J., M.-C. LuoandZ.-L. Yang,1998 Restriction fragment
length polymorphism and divergence in the genomic regions of
morphisms in the pericentromeric regions as well as
high and low recombination in self-fertilizing and cross-fertilizing
give the means to survey larger population sizes that
Aegilopsspecies. Genetics148:423–434.
would allow the identification of rare crossover events Edwards, K. J., J. H. A. Barker, A. Daly, C. JonesandA. Karp,
1996 Microsatellite libraries enriched for several microsatellite
in these intractable genomic regions.
sequences in plants. Biotechniques20:758–760.
In conclusion, the SSRs described here, together with
Graner, A., A. Jahoor, J. Schondelmaier, H. Siedler, K. Pillenet
those described by Liu et al. (1996) and Becker and al., 1991 Construction of an RFLP map of barley. Theor. Appl.
Genet.83:250–256.
Heun(1995), provide a considerable technological
re-Heun, M., A. E. Kennedy, J. A. Anderson, N. L. V. Lapitan, M. E.
source, providing barley breeders and geneticists with
Sorrellset al., 1996 Construction of a restriction fragment
an array of suitable tools for a range of target applica- length polymorphism map of barley (Hordeum vulgare). Genome
34:437–447.
tions. Given the continuing rapid development of barley
Innan, H., R. TerauchiandN. T. Miyashita,1997 Microsatellite
SSRs, we have set up a public access web site (http://
polymorphism in natural populations of the wild plantArabidopsis
www.scri.sari.ac.uk/ssr) to allow the rapid dissemination thaliana.Genetics146:1441–1452.
Kleinhofs, A., A. Kilian, M. A. Saghai Maroof, R. M. Biyashev,
of new primers and mapping information. We envisage
P. Hayeset al., 1993 Molecular, isozyme and morphological
that their development will ultimately supersede RFLPs
map of the barley (Hordeum vulgare) genome. Theor. Appl. Genet.
as a means of mapping, aligning maps, and integrating 86:705–712.
Ku¨ nzel, G., L. KorzunandA. Meister, 2000 Cytologically
inte-different genetic studies within Hordeum. Their
appli-grated physical restriction fragment length polymorphism maps
cation in both linkage and diversity studies will provide
for the barley genome based on translocation breakpoints.
Genet-a common reference thGenet-at will fGenet-acilitGenet-ate the rGenet-apid integrGenet-a- ics154:397–412.
Linde-Laursen, I., J. S. Heslop-Harrison, K. Shepherd and S.
Taketa,1997 The barley genome and its relationship with the Ro¨ der, M. S., V. Korzun, K. Wendehake, J. Plaschke, M.-H. Tixier
et al., 1998b A microsatellite map of wheat. Genetics149:2007– wheat genomes. A survey with an internationally agreed
recom-mendation for barley chromosome nomenclature. Hereditas126: 2023.
Russell, J., J. Fuller, G. Young, B. Thomas, G. Taramino et al., 1–16.
Liu, Z.-W., R. M. BiyashevandM. A. Saghai Maroof,1996 Devel- 1997 Discriminating between barley genotypes using micro-satellite markers. Genome40:442–450.
opment of simple sequence repeat markers and their integration
into a barley linkage map. Theor. Appl. Genet.93:869–876. Saghai Maroof, M. A., K. M. Soliman, R. A. JorgensenandR. W. Allard,1984 Ribosomal DNA spacer length polymorphism in
Messeguer, R., M. Ganal, M. C. de Vicente, N. D. Young, H. Bolkan
et al., 1991 High resolution RFLP map around the root knot barley: Mendelian inheritance, chromosomal location and popu-lation dynamics. Proc. Natl. Acad. Sci. USA81:8014–8018. nematode resistance gene (Mi) in tomato. Theor. Appl. Genet.
82:529–536. Saghai Maroof, M. A., R. M. Biyashev, G. P. Yang, Q. Zhangand
R. W. Allard,1994 Extraordinarily polymorphic microsatellite
Moore, G., S. Abbo, W. Cheung, T. Foote, M. Galeet al., 1993 Key
features of cereal genome organization as revealed by the use of DNA in barley: species diversity, chromosomal locations and pop-ulation dynamics. Proc. Natl. Acad. Sci. USA91:5466–5470. cytosine methylation-sensitive restriction endonucleases.
Geno-mics15:472–482. Sherman, J. E., A. L. Fenwick, D. M. NamuthandN. L. V. Lapitan,
1995 A barley RFLP map: alignment of the three barley maps
Moore, G. K., K. M. Devos, Z. WangandM. D. Gale,1995 Grasses,
line up and form a circle. Curr. Biol.5:737–739. and comparisons to gramineae species. Theor. Appl. Genet.91: 681–690.
Morgante, M., A. Rafalski, P. Biddle, S. TingeyandA. M. Olivieri,
1994 Genetic mapping and variability of seven soybean simple Smulders, M. J. M., G. Bredemeijer, W. Rus-Kortekaas, P. Arens
andB. Vosman,1997 Use of short microsatellites from database sequence repeat loci. Genome37:763–769.
Namuth, D. M., N. P. V. Lapitan, K. S. GillandB. S. Gill,1994 sequences to generate polymorphisms amongLycopersicon esculen-tumcultivars and accessions of otherLycopersiconspecies. Theor. Comparative RFLP mapping of Hordeum vulgareand Triticum
tauschii.Theor. Appl. Genet.89:865–872. Appl. Genet.97:264–272.
Stephenson, P., G. Bryan, J. Kirby, A. Collins, K. Devoset al., 1998
Ostrander, E. A., P. M. Jong, J. RineandG. Duyk,1992
Construc-tion of small-insert genomic libraries highly enriched for microsa- Fifty new microsatellite loci for the wheat genetic map. Theor. Appl. Genet.97:946–949.
tellite repeat sequences. Proc. Natl. Acad. Sci. USA89:3419–3423.
Pearson, W. R.,1990 Rapid and sensitive sequence comparison with Struss, D.,andJ. Plieske,1998 The use of microsatellite markers for detection of genetic diversity in barley populations. Theor. FASTP and FASTA, pp. 63–98 inMethods in Enzymology, Vol. 183,
edited byR. F. Doolittle.Academic Press, San Diego. Appl. Genet.97:308–315.
Thomas, W. T. B., W. Powell, R. Waugh, K. J. Chalmers, U. M. Petersen, G.,andO. Seberg,1998 Molecular characterization and
sequence polymorphism of the alcohol dehydrogenase 1 gene Baruaet al., 1995 Detection of quantitative trait loci for agro-nomic, yield, grain and disease characters in spring barley (H.
inHordeum vulgareL. Euphytica102:57–63.
Powell, W., W. T. B. Thomas, E. Baird, P. Lawrence, A. Boothet vulgareL.). Theor. Appl. Genet.91:1037–1047.
Waugh, R., N. Bonar, E. Baird, P. Lawrence, B. Harroweret al.,
al., 1997 Analysis of quantitative traits in barley by the use of
amplified fragment length polymorphisms. Heredity79:48–59. 1996 Conservation of AFLP marker order in different barley
Ramsay, L., M. Macaulay, L. Cardle, M. Morgante, S. degli populations. Proceedings of Vth International and VIIth
Interna-Ivanissevichet al., 1999 Intimate association of microsatellite tional Barley Genetics Symposium, Saskatoon, Saskatchewan, repeats with retrotransposons and other dispersed repetitive ele- Canada, pp. 397–399.
ments in barley. Plant J.17:415–425. Waugh, R., N. Bonar, E. Baird, B. Thomas, A. Graneret al., 1997
Ro¨ der, M. S., J. Plaschkey, S. U. Konig, A. Borner, M. E. Sorrells Homology of AFLP products in three mapping populations of
et al., 1995 Abundance, variability and chromosomal location barley. Mol. Gen. Genet.255:311–321.
of microsatellites in wheat. Mol. Gen. Genet.246:327–333. Weir, B. S.,1990 Genetic Data Analysis.Sinauer Associates,
Sunder-Ro¨ der, M. S., V. Korzun, B. S. GillandM. W. Ganal,1998a The land, MA. physical mapping of microsatellite markers in wheat. Genome