Article
Development and Assessment of an Integrated
1D-3D CFD Codes Coupling Methodology for Diesel
Engine Combustion Simulation and Optimization
Federico Millo 1,*, Andrea Piano 1, Benedetta Peiretti Paradisi 1, Mario Rocco Marzano 1, Andrea Bianco 2 and Francesco C. Pesce 31 Energy Department, Politecnico di Torino; [email protected], [email protected], [email protected], [email protected]
2 POWERTECH Engineering; [email protected]
3 General Motors Global Propulsion Systems; [email protected]
* Correspondence: [email protected];
Abstract: In this paper an integrated methodology for the coupling between 1D- and 3D-CFD simulation codes is presented, which has been developed to support the design and calibration of new diesel engines. The aim of the proposed methodology is to couple 1D engine models, which may be available in the early-stage engine development phases, with 3D predictive combustion simulations, in order to obtain reliable estimates of engine performance and emissions for newly designed automotive diesel engines. The coupling procedure features simulations performed in 1D-CFD by means of GT-SUITE and in 3D-1D-CFD by means of Converge, executed within a specifically designed calculation methodology. An assessment of the coupling procedure has been performed by comparing its results with experimental data acquired on an automotive Diesel engine, considering different working points including both part load and full load conditions. Different multiple injection schedules have been evaluated for part-load operation, including pre and post injections. The proposed methodology, featuring detailed 3D chemistry modeling, was proven to be capable to properly assess pollutant formation, specifically to estimate NOx concentrations. Soot formation trend was also well-matched for most of the explored working points. The proposed procedure can therefore be considered as a suitable methodology to support the design and calibration of new Diesel engines, thanks to its ability to provide reliable engine performance and emissions estimations from the early-stage of a new engine development.
Keywords: diesel engines; numerical simulation; pollutant emissions prediction; computational fluid dynamics
1. Introduction
Diesel engine performance and emissions are strongly dependent on the fuel spray injection, in-cylinder mixture formation and combustion processes. The highly demanding legislative and environmental targets mandatorily require a clear understanding of the interaction between the fuel spray, the in-cylinder swirling flow field and the piston bowl, to characterize the combustion efficiency and the pollutant formation phenomena correctly. Therefore, reliable Computational Fluid Dynamics (CFD) simulations are of paramount importance to integrate experimental studies for an efficient optimization and design of new Diesel combustion systems. Furthermore, with the exponential increase of the computational power of Central Processing Units (CPUs) extremely detailed physical and chemical models can be run with an acceptable computational time becoming fundamental in the first stages of the design and development phase. On one hand, properly calibrated 1D-CFD models can be considered as adequate to reproduce accurately the engine behavior with a minimum computational effort. However, the development of new engine designs
can condition significantly the engine behavior (e.g. a new piston bowl shape affects combustion) and requires a new calibration with experimental data in order to guarantee a satisfactory level of accuracy. On the other hand, the use of a 3D-CFD numerical model with its strong predictive capability can be helpful in simulating new engine designs to avoid an expensive and time-consuming experimental campaign. It is worth to point out that a 0D/1D multizone combustion model could provide satisfying results with the aim to optimize the fuel injection strategy, as Piano et al. shows in [1] where a detailed 1D model of the injector coupled with a 1D model of the engine is employed with the aim of minimizing Brake Specific Fuel Consumption (BSFC) and Combustion Noise (CN) without exceeding the Brake Specific NOx (BSNOx) baseline value. However, 3D-CFD detailed combustion analysis becomes essential when a substantial reshaping of the combustion chamber is introduced or when the post injection potential in soot emissions reduction is evaluated. In addition, the two different numerical approaches could be considered complementary: in fact, co-simulations exploit the strongest points of both approaches, minimizing their own drawbacks. For example, in engine simulation, an interesting option could be the development of a 1D/3D-CFD coupled methodology: 3D approach to simulate the complex components and flow processes in the combustion chamber, and 1D approach to solve the gas flow network. Several authors pursued this option to optimize the geometry of complex engine components such as intake manifolds [2–4] or innovative cooling systems [5]. The purpose of this study is to propose an alternative possibility of 1D/3D coupling: 3D-CFD simulations are used to solve the in-cylinder flow field and detailed combustion analysis for the emissions formation evaluation, using the 1D solution to provide time-varying boundary conditions (BCs) for the 3D numerical setup, and to post-process the 3D-CFD combustion results. The present methodology introduces some attracting novelties: on one hand, the coupling of the detailed 3D combustion analysis with a detailed 1D injector model to generate injection profiles; on the other hand, the 3D-CFD results post-processing not only to guarantee consistency with respect to experimental data in terms of in-cylinder pressure and heat release rate comparison, but also to evaluate global engine parameters in the preliminary engine design phase.
In the first part of the present work, the simulation methodology is described in detail, dwelling on the different setups, the CFD models chosen and the coupling technique between the 1D and the 3D setups. The essential elements of the described approach are a reliable spray calibration methodology and a combustion model coupled with a detailed chemistry scheme, to correctly characterize the emissions formation phenomena. A reliable spray modeling is fundamental to predict the fuel spray formation process and how it affects the combustion processes and should be accurately validated, as can be seen in other investigations [6,7]. Moreover, a detailed 1D model of the injector, extensively described in [8,9], provides realistic injection rates, which are one of the fundamental inputs of a reliable 3D-CFD analysis. The entire setup is validated against experimental results on three operating points of the engine map representatives of a typical type approval driving cycle, also considering complex injection strategies with pilots and post injections. The possibility to investigate the mixing improvement, combustion and pollutant emissions formation when using different injection strategies becomes very attractive using 3D-CFD [10,11], and an example of this type of optimization is illustrated in the second part of the work. At one operating point a further assessment is carried out, varying the post injection strategy in order to minimize the soot emissions, being an interesting employment of the present methodology. Other future applications can be the capability to study the influence of different fuel injection system designs on the spray targeting, as Leach et al. have been done in [12] or an appropriate description of the combustion process in presence of complex piston bowl geometries [13,14]. Indeed, since the in-cylinder air and fuel motion controls the combustion process, affecting the NOx and soot formation, the present multidimensional model could be a powerful tool to support the development phase of the new piston bowl shapes improving air and fuel mixing to achieve a better spatial circulation of the fuel.
The engine selected for this study is a 4-cylinder Diesel turbocharged engine for light duty applications, featuring a common rail injection system and a high-pressure Exhaust Gas Recirculation (EGR) loop. More information about the engine are given in Table 1.
Table 1. Main design characteristics of the test engine.
Cylinders 4
Bore x Stroke 79.7 mm x 80.1 mm
Displacement 1.6L
Compression ratio 16:1
Turbocharger Single-Stage with Variable Geometry Turbine (VGT) Fuel injection system Common rail Rated power and torque 100 kW @ 4000 rpm
320 Nm @ 2000 rpm
The test engine features a re-entrant type of bowl design, shown in Fig. 1 and it is equipped with a 8 holes injector.
Figure 1. Re-entrant bowl design
In order to validate the simulation setup, three different operating engine points were explored, two of them at part load and one corresponding to the rated power, as depicted in Figure 2 on the engine operating map and listed in Table 2. The two part load points can be considered as representatives of operating conditions during the execution of type approval driving cycles, where the choice of the third operating point was made to test the reliability of the numerical model also in conditions of high speed and load.
Figure 2. Engine selected WPs (working points) on the engine map.
Speed [rpm] BMEP [bar]
1500 5
2000 8
4000 18.5
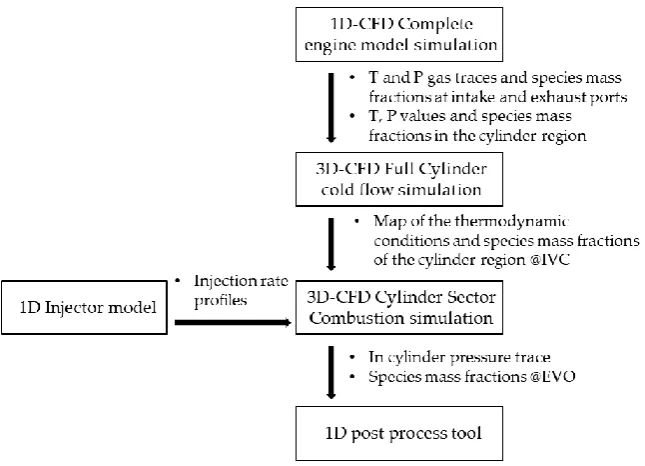
In the selection of a proper simulation setup for a compression ignition engine, the two fundamental needs are a well-calibrated spray modeling and an accurate combustion modeling. To address those requirements a coupled 1D and 3D approach was used, and the adopted methodology is summarized in the block diagram of Figure 3. The first step is a simulation of the entire engine cycle with a 1D complete engine model: in this work, a commercially available software GT-SUITE was selected and the validation results have been already validated in [15,16]. Results from this preliminary phase are used to initialize the first step of the 3D numerical analysis: a so-called full cylinder “cold flow” simulation. A cold flow analysis starts during the exhaust stroke up to the intake valve closure to capture the thermodynamic conditions and the charge motion during the gas exchange process. Then, the combustion process is simulated considering only one sector of the cylinder centered on a single spray axis of the injector. The injector rate comes from a 1D injector model, extensively calibrated and validated in [8,9], in which the only input is the control current signal, in terms of Energizing Times (ET) and Dwell Times (DT). Finally, the results from the 3D combustion simulation are post-processed by means of a 1D postprocess tool available in GT-SUITE environment: the Cylinder Pressure Analysis (CPOA). This is a stand-alone calculation starting only from the measured cylinder pressure, the engine geometry and basic cycle average results (as volumetric efficiency, fuel injected mass). All the boundary conditions needed from the CPOA and the pressure trace along the cycle are taken from the results of the 3D sector simulation. In this way, the simulated in cylinder pressure is analyzed using the same solution methodology as the initial 1D engine model, ensuring perfect consistency between the 3D and the 1D approach.
Figure 3. Block diagram schematizing the methodology used to carry out the simulation.
1D-CFD simulation setup
gas traces in function of the crank angle and the initial value of the species mass fractions will be imposed at the intake and exhaust ports, as well as the initial thermodynamics conditions and species mass fractions in the different regions in which the 3D cylinder model is divided. Finally, the results of 3D sector combustion simulation are post-processed in a 1D model, to ensure consistency between the experimental data and the outcome of the 3D-CFD simulation.
1D-CFD injector simulation
An accurate and realistic injection profile is a fundamental input of the combustion 3D-CFD simulation. In this case, only a limited set of experimental data were available in terms of injection rates and with the aim of extending the availability of the model, there was the necessity to build a meaningful injection rate profiles library. Therefore, a detailed 1D model of the solenoid injector was built in GT-SUITE [8,9]. Using this model, it is possible to calculate the injection rate starting from the Electronic Control Unit (ECU) parameters, in terms of Energizing Time (ET), Dwell Time (DT) and Rail Pressure.
3D-CFD simulation setup
The 3D-CFD simulations are carried out using a commercially available software CONVERGE CFD, in two different steps. At first, a full cylinder cold flow simulation starts during the exhaust stroke until the intake valve closure, to model the airflow in this portion of the engine cycle. The choice to start the simulation when the exhaust valve is quite fully opened is made to stabilize the calculation, far from transients. The aim of this stage of the model is to evaluate all the thermodynamic conditions inside the cylinder, the gas exchange process and the charge motion up to the end of compression stroke accounting the interaction of the moving geometry with the fluid dynamics. As mentioned, the full cylinder simulation is initialized using as a time varying boundary condition the 1D-CFD complete engine model results. Then the 3D solution in terms of temperature, pressure and species concentration is mapped in all the cells of the domain at the intake valve closure (IVC) and imposed to a sector mesh to start the combustion simulation. The combustion simulation is performed only on a portion of the cylinder, a sector of 45 degrees considering the presence of an 8 holes injector, as can be seen in Figure 4.
Figure 4. Selected cylinder sector on the entire combustion bowl geometry.
The base grid dimension in all the simulations is fixed at 0.5 mm, reaching the minimum size of 0.25 mm due to the grid refinement techniques. A so-called fixed embedding is placed near the nozzle to refine the base grid dimension in this volume during all the simulation and, consequently, correctly evaluate the spray phenomena; the law used to scale the base grid is given in the following equation
𝐝𝐱
𝐧𝐞𝐰=
𝐝𝐱𝐛𝐚𝐬𝐞
𝟐𝐞𝐦𝐛𝐞𝐝𝐝𝐢𝐧𝐠 𝐥𝐞𝐯𝐞𝐥. (1)
Apart from the near-nozzle region, it is quite difficult to choose a priori where a refinement of the grid is necessary. In this case, the Adaptive Mesh refinement (AMR) method is applied in all the sector volume where high velocity and temperature gradients grow up. In particular, when a difference of more than 1 m/s in velocity or 5 K in temperature is observed between two adjacent cells the grid is scaled according to Eq. 1.
As far as turbulence is concerned, the Reynolds-averaged Navier-Stokes (RANS) based Re-Normalization Group (RNG) k-ε model [18] is adopted. Considering the spray model, the atomization and the breakup of the droplets are calculated by means of calibrated Kelvin Helmholtz and Rayleigh Taylor (KH-RT) model. The “blob” injection method of Reitz and Diwakar is used [19], in which parcels of liquid with a characteristic size equal to the effective nozzle diameter are injected into the computational domain. The O’Rourke model is chosen to simulate the turbulent dispersion of the spray parcels, distributing the parcels evenly throughout the cone of the injector [20]. The No Time Counter method (NTC) [21] is used as a collision model with the addition of a collision mesh and the dynamic droplet drag [22] to account the possibility of variations in the drop shape. As far as the spray-wall interaction is concerned, the O’Rourke wall film model was adopted. Finally, the fuel evaporation was described by means of the Frossling evaporation model [23], which converts the evaporated liquid fuel mass into specified source species. The validation of the spray model was done considering the break up constants of the KH-RT model, the discharge coefficient and the spray angle values as calibration parameters, in comparison with penetration curves experimental data coming from constant volume vessel tests performed at the University of Perugia [24,25]. Those data were available only for a reference injection, whose characteristics are shown in Table 3.
Table 3. Main characteristics of the reference injection data.
Ref. case – 8 hole, solenoid common rail injector
Vessel Pressure [bar] 11.28
Vessel Temperature [°C] 20
Rail Pressure [bar] 400
Figure 5. Top: Experimental injection current (dotted lines) and hydraulic injection schedule (full lines). Bottom: Numerical spray penetration (red lines) compared with the experimental data (black line) obtained in conditions shown in Table 3.
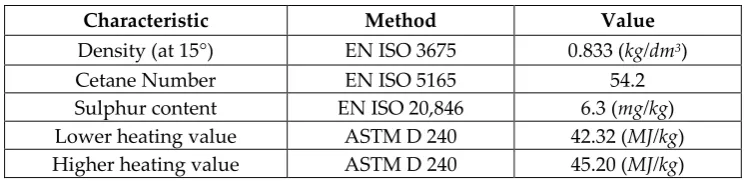
Concerning the combustion model, the SAGE detailed chemistry solver is implemented with the Skeletal Zeuch mechanism, the reduced version of the complete Zeuch mechanism [26], enhanced by the inclusion of soot reactions from prof. Mauss’s work. It features 121 species including Poly-cyclic Aromatic Hydrocarbon (PAH); therefore, it is possible to use a detailed Particulate Matter (PM) method, named Particulate Mimic model [27]. Since B10 fuel (10% biodiesel and 90% petrodiesel blend) was used for the experimental activity, in the numerical analysis the properties of the fuel were set equal to the ones of B10, as reported in Table 4.
Table 4. Main characteristics of the B10 Diesel blend [28].
Characteristic Method Value
Density (at 15°) EN ISO 3675 0.833 (kg/dm3)
Cetane Number EN ISO 5165 54.2
Sulphur content EN ISO 20,846 6.3 (mg/kg)
Lower heating value ASTM D 240 42.32 (MJ/kg)
Higher heating value ASTM D 240 45.20 (MJ/kg)
3. Results and Discussion
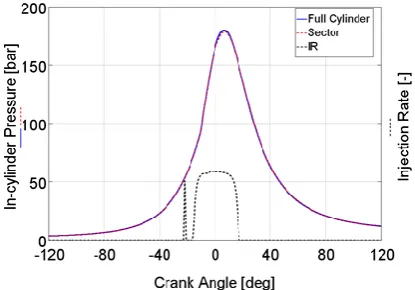
Figure 6. In-cylinder pressure obtained during a combustion simulation of all the cylinder
geometry (blue) compared with the sector mesh approach (red), for the WOP 4000 rpm at full load.
Figure 7. Computational time comparison of full cylinder (red) and the sector combustion
approaches (green) which needs a preliminary full cylinder cold flow analysis (blue). The CPU time is referred to simulations distributed on 24 cores, Intel Xeon E5-2680 v3 2.50 GHz processor.
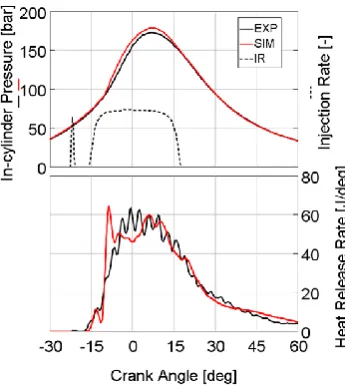
Regarding the validation of the coupled 1D-3D approach, Figure 8 displays the results for the engine operation point 1500 rpm x 5 bar of Brake Mean Effective Pressure (BMEP). The injection profile, is highlighted in black dashed line, and was obtained from the 1D detailed injector model. A more than satisfactory agreement was obtained, both in terms of in-cylinder pressure and heat release rate. The combustion timing is correctly depicted by the numerical model for pilots, main and post injections.
The in-cylinder pressure and heat release rate comparison with the experimental data is shown in Figure 9 for the second WP (2000 rpm x 8 bar BMEP). The combustion duration and the ignition delay are both correctly captured by the numerical simulation.
Figure 9. Top: Simulated (red) vs experimental (black) in-cylinder pressure, injection rate (dotted black); Bottom: Simulated (red) vs experimental (black) heat release rate (bottom). EOP: 2000 rpm x 8 bar.
The capability of capturing accurately the combustion process is also confirmed in the last test engine point, 4000 rpm x 18.5 bar BMEP, as shown in Figure 10, which features one pilot and main injection with high injection pressure, showing generally an excellent agreement between experiments and modeling.
Figure 10. Top: Simulated (red) vs experimental (black) in-cylinder pressure, injection rate (dotted black); Bottom: Simulated (red) vs experimental (black) heat release rate (bottom). EOP: 4000 rpm x FL.
Figure 11. Maximum pressure (top – left), Crank Angle at Maximum Pressure (top – right), 10-90 Combustion Duration (bottom – right) and MFB50 (bottom – left) comparison between experiments (black square) and simulation results (red circle).
Regarding the results in terms of pollutant emissions, Figure 12 shows NOx and soot emissions of the three operating points simulation results in comparison with experimental data. A very good agreement was found in terms of NOx emissions, on all the different considered WPs. Concerning the soot values presented normalized respect to the case at full load, the same trend was found across the three WPs using the detailed chemistry solver coupled with a detailed PM method.
Figure 12. NOx emissions (left) and soot emissions (right), experimental data in black and simulated in red, normalized respect to the full load value.
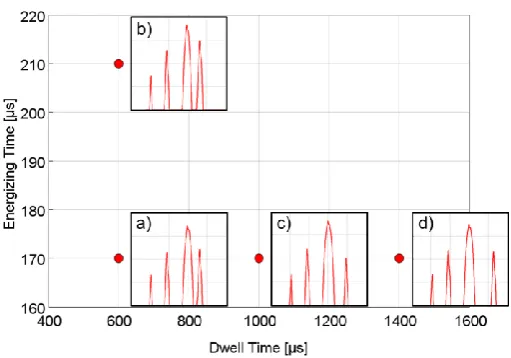
example of the effect of different injection parameters on post injection efficacy in soot reduction is investigated. Four different injection patterns have been analyzed on a single operating point (1500 rom x 5 bar BMEP) varying either timing or post injected quantity, as shown in Figure 12. The Start Of Injection (SOI) of main and 2 pilot injections is kept constant. The injector detailed model is used to obtain the different injected mass flow rate. Figure 13 shows the different injection profiles tested, with a sweep in the DT (600, 1000, 1400 μs) and a sweep of ET (170 and 210 μs).
Figure 13. Injection schedules varying the Energizing Time (ET) and Dwell Time (DT) of post injection, for the operating point 1500 rpm x 5 bar.
The in-cylinder pressure and the simulated heat release rate are shown in Figure 14 for the three injection profiles with the same ET, varying consequently the DT. The predictivity of the numerical model is more than satisfactory considering the comparison with the experimental data. The timing of the combustion is accurately simulated, as well as the heat release, with a moderate underestimation of the combustion peak in the in-cylinder pressure curve.
Figure 14. Effect of post injection DT – Top: Simulated (red) vs experimental (black) in-cylinder pressure, injection rate (blue); Bottom: Simulated (red) vs experimental (black) heat release rate (bottom). EOP: 1500 rpm x 5 bar – Case a), c) and d).
the experimental results, as well as the combustion timing and the overall evolution in the heat release rate profile.
Figure 15. Effect of post injection ET – Top: Simulated (red) vs experimental (black) in-cylinder pressure, injection rate (blue); Bottom: Simulated (red) vs experimental (black) heat release rate (bottom). EOP: 1500 rpm x 5 bar – Case a) and b).
All the results of the post injection analysis confirm that the methodology used for the simulations is reliable and can reproduce realistically what happens in the experimental combustion phenomena.
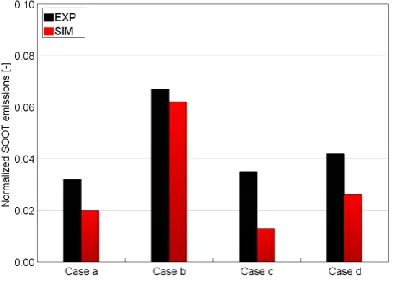
In Figure 16 soot emissions results are shown for the four post injection strategies analyzed. The results show a good agreement between experimental and numerical results, highlighting that the shorter post injection event is more effective on soot reduction, mainly if coupled with a reduced DT.
Figure 16. Normalized soot emissions respect to the respective maximum value at the EOP 4000xFL, experimental data in black and simulated in red.
5. Conclusions
An assessment of the developed procedure has been performed by comparing its results with experimental data acquired on an automotive Diesel engine, considering different working points including both part load and full load conditions. In addition, different multiple injection schedules have been evaluated for part-load operation, including pre and post injections, evaluating the procedure potential in terms of combustion and emissions prediction. Thanks to the detailed chemistry modelling, the proposed methodology has been proven to be capable to properly assess both combustion process and emissions formation: NOx concentrations and soot emission trends were well-matched for all the explored working points.
The proposed procedure can therefore be considered as a suitable methodology to support the design and calibration of new Diesel engines, thanks to its ability to provide reliable engine performance and emissions estimations from the early-stage of a new engine development.
Author Contributions: Conceptualization, F.M.; Methodology definition, A.B., A.P.; Sofware, A.B., A.P.;
Validation, A.P., B.P.P.; formal analysis, A.P., B.P.P., A.B.; investigation, A.P., B.P.P.; writing—original draft preparation, A.P., B.P.P.; writing—review and editing, F.M., F.C.P., M.R.M.; supervision, F.M., F.C.P.; project administration, F.M., F.C.P.; funding acquisition, F.M..
Definitions/Abbreviations
AMR Adaptive Mesh Refinement
BMEP Brake Mean Effective Pressure
CFD Computational Fluid Dynamics
CPU Central Processing Unit
DT Dwell Time
EGR Exhaust gas Recirculation
ET Energizing Time
EVO Exhaust Valve Opening
FL Full Load
IVC Intake Valve Closing
P Pressure
PM Particulate Matter
RANS Reynolds-Averaged Navier-Stokes
RNG Re-Normalization Group
SOI Start of Injection
T Temperature
VGT Variable Geometry Turbine
WP Working Point
References
1. Piano, A., Millo, F., Sapio, F., and Pesce, F.C., “Multi-Objective Optimization of Fuel Injection Pattern
for a Light-Duty Diesel Engine through Numerical Simulation,” SAE Int. J. Engines 11(6):1093–1107, 2018,
doi:10.4271/2018-01-1124.
2. Sinclair, R., Strauss, T., and Schindler, P., “Code Coupling, a New Approach to Enhance CFD Analysis
of Engines,” SAE Tech. Pap. Ser. 1, 2010, doi:10.4271/2000-01-0660.
3. Riegler, U.G. and Bargende, M., “Direct Coupled 1D/3D-CFD-Computation (GT-Power/Star-CD) of the
Flow in the Switch-Over Intake System of an 8-Cylinder SI Engine with External Exhaust Gas
Recirculation,” SAE Tech. Pap. Ser. 1(724), 2010, doi:10.4271/2002-01-0901.
3D finite volume CFD codes based on the Method of Characteristics,” Math. Comput. Model. 54(7–8):1738–
1746, 2011, doi:10.1016/j.mcm.2010.11.078.
5. Watanabe, N., Kubo, M., and Yomoda, N., “An 1D-3D Integrating Numerical Simulation for Engine
Cooling Problem,” SAE Tech. Pap. Ser. 1(1603), 2006, doi:10.4271/2006-01-1603.
6. Som, S., Ramirez, A.I., Aggarwal, S.K., Kastengren, A.L., El-Hannouny, E., Longman, D.E., Powell, C.F.,
and Senecal, P.K., “Development and Validation of a Primary Breakup Model for Diesel Engine
Applications,” SAE Tech. Pap. Ser. 1(0838), 2009, doi:10.4271/2009-01-0838.
7. Magnotti, G.M. and Genzale, C.L., “Exploration of Turbulent Atomization Mechanisms for Diesel Spray
Simulations,” SAE Tech. Pap. Ser. 1, 2017, doi:10.4271/2017-01-0829.
8. Piano, A., Millo, F., Postrioti, L., Biscontini, G., Cavicchi, A., and Pesce, F.C., “Numerical and
Experimental Assessment of a Solenoid Common-Rail Injector Operation with Advanced Injection
Strategies,” SAE Int. J. Engines 9(1):565–575, 2016, doi:10.4271/2016-01-0563.
9. Piano, A., Boccardo, G., Millo, F., Cavicchi, A., Postrioti, L., and Pesce, F.C., “Experimental and
Numerical Assessment of Multi-Event Injection Strategies in a Solenoid Common-Rail Injector,” SAE
Int. J. Engines 10(4):2129–2140, 2017, doi:10.4271/2017-24-0012.
10. Molina, S., Desantes, J.M., Garcia, A., and Pastor, J.M., “A Numerical Investigation on Combustion
Characteristics with the use of Post Injection in DI Diesel Engines,” SAE Tech. Pap. Ser. 1, 2010,
doi:10.4271/2010-01-1260.
11. Yu, H., Liang, X., Shu, G., Wang, Y., Sun, X., and Zhang, H., “Numerical investigation of the effect of
two-stage injection strategy on combustion and emission characteristics of a diesel engine,” Appl. Energy
227:634–642, 2018, doi:10.1016/j.apenergy.2017.09.014.
12. Leach, F., Ismail, R., and Davy, M., “Engine-out emissions from a modern high speed diesel engine –
The importance of Nozzle Tip Protrusion,” Appl. Energy 226:340–352, 2018,
doi:10.1016/j.apenergy.2018.05.117.
13. Subramanian, S., Rathinam, B., Lalvani, J.I.J., and Annamalai, K., “Piston Bowl Optimization for Single
Cylinder Diesel Engine Using CFD,” SAE Tech. Pap. Ser. 1, 2016, doi:10.4271/2016-28-0107.
14. Leach, F., Ismail, R., Davy, M., Weall, A., and Cooper, B., “The effect of a stepped lip piston design on
performance and emissions from a high-speed diesel engine,” Appl. Energy 215:679–689, 2018,
doi:10.1016/j.apenergy.2018.02.076.
15. Piano, A., Millo, F., Boccardo, G., Rafigh, M., Gallone, A., and Rimondi, M., “Assessment of the
Predictive Capabilities of a Combustion Model for a Modern Common Rail Automotive Diesel Engine,”
SAE Tech. Pap. Ser. 1, 2016, doi:10.4271/2016-01-0547.
16. Piano, A., “Analysis of Advanced Air and Fuel Management Systems for Future Automotive Diesel
17. Puri lng, T.N., Soni lng, L.R., and Deshpande, S., “Combined Effects of Injection Timing and Fuel
Injection Pressure on Performance, Combustion and Emission Characteristics of a Direct Injection Diesel
Engine Numerically Using CONVERGE CFD Tool,” SAE Tech. Pap. Ser. 1, 2017,
doi:10.4271/2017-28-1953.
18. Orszag, S. A., Yakhot, V., Flannery, W. S., Boysan, F., Choudhury, D., Maruzewski, J., & Patel, B.,
“Renormalization Group Modeling and Turbulence Simulations,” Near-Wall Turbul. Flows 1031–1046,
1993.
19. Reitz, R.D., B.F., “Mechanisms of Breakup of Round Liquid Jets,” Encycl. Fluid Mech 3:233–49, 1986,
doi:10.2514/1.19397.
20. Richards KJ, Senecal PK, P.E., “CONVERGE 2.3,” Converg. Sci., 2016.
21. Schmidt, D.P. and Rutland, C.J., “A New Droplet Collision Algorithm,” J. Comput. Phys. 164(1):62–80,
2000, doi:10.1006/jcph.2000.6568.
22. O’Rourke, P.J. ; Amsden, A.A., “The TAB method for numerical calculation of spray droplet breakup,”
NM Los Alamos Natl. Lab., 1987.
23. Amsden AA, O’Rourke PJ, Butler TD, I.K., “A Computer Program for Chemically Reactive Flows with
Sprays,” Los Alamos Natl. Lab. Rep. LA-11560-MS, 1989.
24. Postrioti, L., Grimaldi, C.N., Ceccobello, M., and Gioia, R. Di, “Diesel common rail injection system
behavior with different fuels,” SAE Tech. Pap. 2004(724), 2004, doi:10.4271/2004-01-0029.
25. Postrioti, L., Buitoni, G., Pesce, F.C., and Ciaravino, C., “Zeuch method-based injection rate analysis of
a common-rail system operated with advanced injection strategies,” Fuel 128:188–198, 2014,
doi:10.1016/j.fuel.2014.03.006.
26. Thomas Zeuch, Gladys Moréac, Syed Sayeed Ahmed, and Fabian Mauss, “A comprehensive skeletal
mechanism for the oxidation of n-heptane generated by chemistry-guided reduction,” Combust. Flame
155(4):651–674, 2008, doi:10.1016/j.combustflame.2008.05.007.
27. Kazakov, A. and Frenklach, M., “Dynamic modeling of soot particle coagulation and aggregation:
Implementation with the method of moments and application to high-pressure laminar premixed
flames,” Combust. Flame 114(3–4):484–501, 1998, doi:10.1016/S0010-2180(97)00322-2.