Article
Structure Modification of an Active Azo-Compound as a
Route to New Antimicrobial Compounds
Simona Concilioa,*, Lucia Sessab, Anna Maria Petroneb,c Amalia Portab, Rosita Dianad, Pio Iannellib and Stefano Piottob
a Department of Industrial Engineering, University of Salerno, Via Giovanni Paolo II 132, 84084 Fisciano (SA), Italy b Department of Pharmacy, University of Salerno, Via Giovanni Paolo II 132, 84084 Fisciano (SA), Italy
c PhD Program in Drug Discovery and Development, University of Salerno, Via Giovanni Paolo II 132, 84084 Fisciano (SA), Italy
d Department of Chemical Science, University of Napoli “Federico II”, Cupa Nuova Cintia, 21 - 80126 – Napoli, Italy * Correspondence: [email protected]; Tel.: +39-089-964115
Abstract: Some novel (phenyl-diazenyl)phenols (3a–g) were designed and synthesized to be evaluated for their antimicrobial activity. A previously synthesized molecule, active against bacteria and fungi, was used as lead for modifications and optimization of the structure, by introduction/removal or displacement of hydroxyl groups on the azobenzene rings. The aim of this work was to evaluate the consequent changes of the antimicrobial activity and to validate the hypothesis that, for these compounds, a plausible mechanism could involve an interaction with protein receptors, rather than an interaction with membrane. All newly
synthesized compounds were analyzed by 1H nuclear magnetic resonance (NMR), DSC thermal analysis and
UV-Vis spectroscopy. The in vitro minimal inhibitory concentrations (MIC) of each compound was determined
against Gram-positive and Gram-negative bacteria and Candida albicans. Compounds 3b and 3g showed the
highest activity against S. aureus and C. albicans, with remarkable MIC values of 10 µg/mL and 3 µg/mL,
respectively. Structure- activity relationship studies were capable to rationalize the effect of different substitutions on the phenyl ring of the azobenzene on antimicrobial activity.
Keywords: azo-compound; antimicrobial; synthesis; QSAR.
1. Introduction
Antimicrobial therapy is a powerful tool for the treatment of several diseases, and is a keystone of modern medicinal practice. Infections by pathogenic microorganisms are of great concern in many fields, particularly in medical devices, hospital surfaces, surgery equipment, health care products, food packaging and storage. Infections are generally combated with antimicrobial agents [1], however, some bacteria, upon mutating their genes, have become resistant to common antibiotics and this makes difficult their elimination [2-6]. Consequently, the increased resistance of microorganisms to the currently used antimicrobials has led to the evaluation of other agents that might have antimicrobial activity [7,8].
Recently, our research group described the synthesis and properties of some azobenzene-based compounds and their antimicrobial properties both as single molecules [9] and dispersed in a polymer matrix [10-12]. In one of this works, we also selected the best candidates by preliminary in silico test of ADMET properties and then we synthesized the azo compounds with lowest in silico toxicity values according to the classic scheme of diazocopulation reaction [9,13]. The majority of synthesized compounds exhibited high antibacterial activity against S. aureus and antifungal activity against C. albicans, but they were inactive against Gram-negative bacteria such as Pseudomonas aeruginosa and Salmonella typhimurium.
Azobenzene based derivatives possesses interesting features that worth further investigations. Among others, the presence of photo-inducible isomerism can be exploited in remodeling lipid membranes [14] or to modulate the membrane interaction of peptides [15].
In this work, we introduced some structure modifications to enhance the biological activity of the previously obtained azo-compounds. In particular, we aimed to evaluate the change in activity related to different types of substituents linked on the azobenzene structure.
2
We chose A4 from ref [9], one the best antibacterial azo-compound we synthesized, as lead compound to
synthesize several analogues (see Figure 1). The choice of A4 is related to both activity and synthetic easiness. We introduced simple molecular modifications on both azobenzene rings, in order to evaluate the role of the phenolic hydroxyl group in the mechanism of action. The substituents are joined to the fixed moiety azobenzene: the modifications involved moving of the phenolic hydroxyl group from para- to meta- position, or removing of the phenolic hydroxyl group, and replacing of the phenolic hydroxyl group by the methoxy and the methyl groups, to study and compare their antimicrobial activity.
Quantitative Structure-Activity Relationships (QSAR) are mathematical frameworks that interface molecular structures of compounds with their natural activities in a quantitative way [7]. The main success of the QSAR method is the possibility to estimate the properties of new chemical compounds without the need to synthesize and test them. One of the most efficient and popular technique is the Genetic Algorithm Search (GAS). GAS are inspired by natural evolution principles where variables play the role of genes (in this case a set of descriptors) in an individual of the species. A group of random individuals (population) evolves according to a fitness function (in this case the antimicrobial activity) that determines the persistence of the individuals. The algorithm exploits selection, mutation, and crossover operations on the genes. The QSAR correlates biological activity with structural and chemical properties. The results of the QSAR analysis permitted to develop a model of activity in which electronics transition are crucial. This approach will permit a more efficient design of azobenzene based antibiotics.
2. Results and Discussion
2.1. Chemistry
Substituted-(phenyl-diazenyl)phenols (3a–g) derivatives are reported in Figure 1.
Figure 1. Substituted-(phenyl-diazenyl)phenols derivatives (3a–g)
3
Scheme 1. Synthetic route for compounds 3a-d
Scheme 2. Synthetic route for compounds 3e-g
Synthesis of compounds 3a-g was accomplished according to the classic scheme of diazocopulation
reactions. An aromatic amine 1 (depending on A4 analogue) were suspended in acid solution and cooled in
an ice bath. Sodium nitrite was added, obtaining a suspension of the diazonium salt 2. Separately, an aqueous solution of NaOH containing the appropriate phenol was prepared and the two solutions mixed under stirring, maintaining the pH values around 10 for 30 minutes. The final solution was acidified until a dark red precipitate of the azo compound was formed. H nuclear magnetic resonance (NMR) was performed to confirm all structures.
2.2. Thermal and optical properties
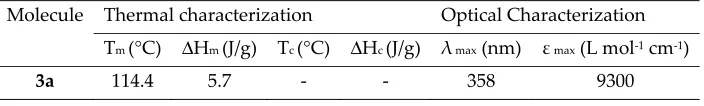
In Table 1, thermal and optical properties of the synthesized compounds are reported. Analogues 3a, 3b,
3d and 3e showed only a melting peak in the first heating run and they were not able to crystallize from the melt. In particular, 3a melts at 114.4 °C, 3b at 87.7 °C, 3d at 89.3 °C and 162.0 °C. Compound 3c showed a sharp melting peak in the first heating run at 128.3 °C and a crystallization peak at 94.6 °C in the cooling run. When
heated in the second run, it showed the same melting peak as in the first run. Compound 3f showed a sharp
melting peak in the first heating run at 147.3 °C and a crystallization peak at 110.6 °C in the cooling run; when heated in the second run, it showed the same melting peak as in the first run. 3g showed a sharp melting peak in the first heating run at 158.7 °C and a crystallization peak at 90.7 °C in the cooling run. When heated in the second run, it showed the same melting peak as in the first run.
Table 1. Thermal and optical properties of compounds 3a-g
Molecule Thermal characterization Optical Characterization
Tm (°C) ΔHm (J/g) Tc (°C) ΔHc (J/g) λ max (nm) ε max (L mol-1 cm-1)
4
3b 87.7 78.0 - - 344 18300
3c 128.3 98.1 94.6 92.1 360 14000
3d 89.3 86.1 - - 354 11400
3e 162.0 149.8 - - 344 14470
3f 147.3 123.3 110.6 104.5 355 14200
3g 158.7 139.4 90.7 83.7 358 14350
Tm = melting temperature, from DSC analysis, 10 °C/min, nitrogen flow; Tc = crystallization temperature, from
DSC cooling run; Instrument error ± 0.5 °C. ΔHm/ΔHc = melting/crystallization enthalpy, evaluated by
integration of the peak. Experimental error ± 5%. λmax = wavelength at the principal absorption maximum, εmax
= molar extinction coefficient at absorption maximum.
The spectral region 650-240 nm was investigated by UV-Vis spectrophotometry, at a concentration of about 3.0·10-5 mol L-1 of azo-compound in acetonitrile solution (Table 1). The UV-visible spectra for 3a-g are
qualitatively only depend on the azobenzene unit, which is the same for all compounds. The UV absorption
spectra of A4 analogues in trans configuration, showed the typical absorption bands of the electronic
transitions of the azobenzene chromophore [16].
2.3. Antimicrobial activity
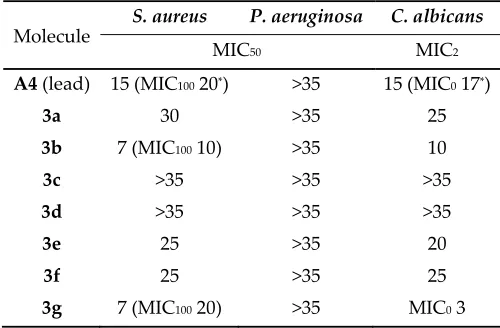
The MICs of the synthesized analogues and of lead compound A4 were determined by the microbroth
dilution for S. aureus A170, P. aeruginosa ATCC-27853 strains and C. albicans SC5314 (Table 2).
Table 2. Antimicrobial and antifungal activity of A4 analogues.
Geometric mean MICs (µg/mL) after 24 h
Molecule
S. aureus P. aeruginosa C. albicans
MIC50 MIC2
A4 (lead) 15 (MIC100 20*) >35 15 (MIC0 17*)
3a 30 >35 25
3b 7 (MIC100 10) >35 10
3c >35 >35 >35
3d >35 >35 >35
3e 25 >35 20
3f 25 >35 25
3g 7 (MIC100 20) >35 MIC0 3
MIC50: Minimum Inhibitory Concentration required to inhibit the growth of 50% of bacteria. MIC100: Minimum
Inhibitory Concentration required to inhibit the growth of 100% of bacteria. MIC2: Minimum Inhibitory
Concentration required to inhibit the growth of 50% of fungus. MIC0: Minimum Inhibitory Concentration
required to inhibit the growth of 100% of fungus. The values are the geometric mean of at least three determinations. *Data from ref. [9]
Analogues 3b and 3g are the most active antimicrobial analogue, exhibiting activity at a concentration lower than the lead compound concentration. In particular, 3b is the only analogue able to inhibit the growth
of 100% of S. aureus at a concentration of 10 µg/mL, indeed for other compounds only the MIC50 values are
5
3g is the most active antifungal analogue, showing a MIC0, which means 100% of inhibition of C. albicans
duplication already at 3 µg/mL (see also Figure 2).
Compared to the reference molecule, other analogues such as 3a, 3e and 3f show lower activities. Nevertheless, they still possess antimicrobial and antifungal activity, even if at concentrations higher than A4. 3c and 3d
compounds lose antibacterial and antifungal activity and all analogues do not exhibit antimicrobial activity against P. aeruginosa, asalready observed for previously synthesized similar compounds [9].
Interestingly, all the compounds show antibacterial activity only against Gram-positive bacteria. Probably the outer membrane in the Gram-negative prevents the entry of the azo compound into bacterial cell and so its antimicrobial action.
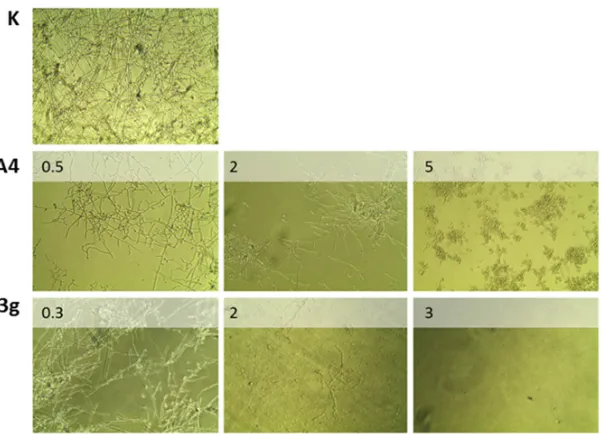
Figure 2 shows the total inhibition of germination and hyphae formation of azo compound 3g on C. albicans,
at 3 µg/mL. In the absence of azo compound, an extensive hyphae formation was observed, whereas when 3g
was present, hyphae formation was severely hampered in a concentration-dependent manner.
Figure 2. Inhibition of hyphae formation in Candida albicans at different concentrations (µg/mL) of A4 and 3g
(20X optical zoom).
2.4 QSAR models
QSAR models were performed to predict the activity of azobenzene molecules against S. aureus. We have
generated several QSAR models using different training and test sets and we have retained only statistically
significant models. The efficacy of the molecules are estimated as the inverse of MIC50. Therefore, higher
efficacy corresponds to higher values of 1/MIC50. After careful evaluation of all models, we have chosen the
following:
1
= 0.0789 ∙ 1 − 0.0580 ∙ 8 + 0.116
Equation 1
Whereas VR1_Dzp is the Randic-like eigenvector-based index from Barysz matrix / weighted by polarizabilities and standardized by range, and SpMin8_Bhi is the smallest absolute eigenvalue of Burden modified matrix - n 8 / weighted by relative first ionization potential standardized by range.
6
Table 3. Comparison of experimental and calculated antimicrobial activity against S. aureus
Molecule
MIC50
Experimental
(μg/mL)
Actual values
for C : 1/MIC50 ALogP
Equation 1:
predicted
values
Equation 1:
residual
values
MIC50
predicted
A4 15 0.067 2.8 0.0513 0.0154 19
3a 30 0.033 2.8 0.0520 -0.0187 19
3b 7 0.143 5.0 0.1460 -0.0030 7
3c 80* 0.013 3.0 0.0214 -0.0089 50
3d 80* 0.013 7.2 0.0357 -0.0232 30
3e 25 0.040 1.8 0.0452 -0.0052 22
3f 25 0.040 0.7 0.0909 -0.0509 11
3g 7 0.143 3.2 0.0950 0.0479 10
A1 17 0.059 0.8 0.0756 -0.0168 13
A2 15 0.067 2.6 0.0822 0.0155 12
A3 14 0.071 0.2 0.0699 0.0015 14
A5 18 0.056 4.3 0.0625 -0.0069 16
B10 80* 0.013 0.3 0.0142 -0.0017 70
B11 80* 0.013 1.1 0.0142 -0.0017 70
*molecules that did not show activity for concentration larger than 35 μg/mL, have been arbitrarily assigned
to 80 to perform the GFA.
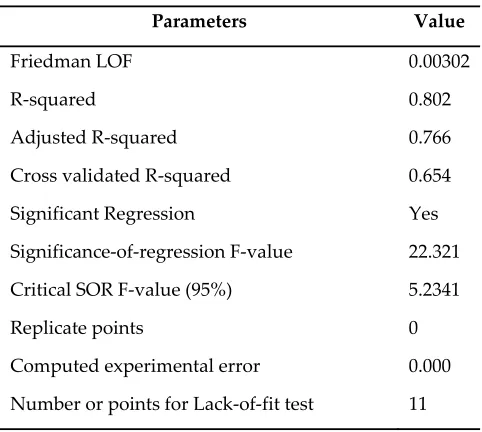
The validation tests used to check the predictive ability of the model are listed in Table 4.
Table 4. Validation of the genetic function results
Parameters Value
Friedman LOF 0.00302
R-squared 0.802
Adjusted R-squared 0.766
Cross validated R-squared 0.654
Significant Regression Yes
Significance-of-regression F-value 22.321
Critical SOR F-value (95%) 5.2341
Replicate points 0
Computed experimental error 0.000
7
Min expt. error for non-significant LOF (95%) 0.0201
The validation tests indicate good predictive capability of the model, but there are few molecules showing a large error. In particular, molecule 3d displays the highest error. This could be associated to the low solubility
of 3d that, in fact, has the largest value of AlogP. AlogP is a thermodynamic descriptor and represent
hydrophobicity [17].
3. Materials and methods
3.1 General
All the reagents and solvents were purchased from Sigma-Aldrich and used without further purification. Optical observations were performed by using a Jenapol microscope fitted with a Linkam THMS 600 hot stage. Phase transition temperatures and enthalpies were measured using a DSC scanning calorimeter Perkin Elmer Pyris 1 at a scanning rate of 10 °C/min, under nitrogen flow. UV absorption spectra of the samples were recorded at 25 °C in acetonitrile solution, on a Perkin Elmer Lambda 19 spectrophotometer. The spectral region 650-240 nm was investigated by using cell path length of 1.0 cm. Azobenzene chromophore concentration of about 3.0·10-5 mol L-1 was used. 1HNMR spectra were recorded with a Bruker DRX/400 Spectrometer. Chemical
shifts are reported relative to the residual solvent peak (dimethylsulfoxide-d6: H = 2.50 ppm)
3.2 General method of the synthesis of (phenyl-diazenyl)phenols derivatives 3a-d
A suspension of 0.0183 mol of the proper aromatic amine in a solution containing 38 mL of water and 4 mL of HCl 37% (w/w) was cooled at 0-5 °C in a water-ice bath. A solution of 1.39 g of sodium nitrite (0.0202 mol) dissolved in 8.0 mL of water was added dropwise, obtaining a suspension of the diazonium salt (solution A). Separately, a solution containing 0.7 g of NaOH (0.0175 mol) in 50 mL of water with 2.23 g of 2,6-dimethylphenol (0.0183 mol) was prepared (solution B). Solution A was added dropwise to solution B, under stirring at 12 °C. The system was left reacting for 30 min, maintaining the pH = 10-11. Then the final solution was slowly added to 103 mL of an acid solution (100 mL of water and 3 mL of acetic acid), and then stirred for 30 min at 15 °C. A dark red precipitate of the azo compound was formed. The crude precipitate was filtered and dried under vacuum. Yields ranged between 30 and 40%.
3’-hydroxy-(4-hydroxy-3,5-dimethyl)-azobenzene (3a): 3-aminophenol and 2,6-dimethylphenol were used as starting reagents. The crude product was extracted and crystallized from boiling n-octane (100 mL) and dried.
Final crystallization from boiling water/ethanol (3:1) gave pure 3a, as orange crystals. Polarized optical
microscopy showed a needle crystalline habitus. Yield: 30%. 1H NMR (DMSO-d6): δ (ppm) = 7.55 (s, 2H), 7.34
(m, 2H), 7.19 (d, 1H), 6.90 (d, 1H), 2.27 (s, 6H).
4-hydroxy-3,5-dimethyl-azobenzene (3b): Aniline and 2,6-dimethylphenol were used as starting reagents. The
crude product was extracted and crystallized from boiling water/ethanol (3:1) and dried, to give pure 3b as
amber crystals. Polarized optical microscopy showed a needle crystalline habitus. Yield: 35%.1H NMR
(DMSO-d6): δ (ppm) = 7.82 (d, 2H), 7.55 (m, 5H), 2.27 (s, 6H).
4’-methoxy-(4-hydroxy-3,5-dimethyl)-azobenzene (3c): p-anisidine and 2,6-dimethylphenol were used as starting reagents. The extraction and crystallization of the crude product from boiling water/ethanol (3:1) gave the pure 3c as yellow crystals. Polarized optical microscopy showed a needle crystalline habitus. Yield: 40%. 1H
8
4’-methyl-(4-hydroxy-3,5-dimethyl)-azobenzene (3d): p-toluidine and 2,6-dimethylphenol were used as starting reagents. The extraction and crystallization of the crude product from boiling water/ethanol (3:1) gave the pure 3d as orange crystals. Polarized optical microscopy showed a plate crystalline habitus. Yield: 38%. 1H
NMR (DMSO-d6): δ (ppm) = 7.72 (d, 2H), 7.54 (s, 2H), 7.36 (d, 2H), 2.39 (s, 3H), 2.27 (s, 6H).
3.3 General method of the synthesis of (phenyl-diazenyl)phenols derivatives 3e–g
A suspension of 0.0183 mol of the proper aromatic amine in a solution containing 38 mL of water and 4 mL of HCl 37% (w/w) was cooled at 0-5 °C in a water-ice bath. A solution of 1.39 g of sodium nitrite (0.0202 mol) dissolved in 8 mL of water was added drop-wise, obtaining a suspension of the diazonium salt (solution A). Separately, a solution containing 0.7 g of NaOH (0.0175 mol) in 100 mL of water (pH = 14) with 1.72 g of phenol (0.0183 mol) was prepared (solution B). Solution A was added dropwise to solution B, under stirring at 12 °C. The system was left reacting for 30 min, maintaining the pH = 11. The final solution was slowly added to 300 mL of an aqueous solution of acetic acid (pH = 5) and then stirred for 30 min at 15 °C. In this step, to facilitate the precipitation of the azo compound I added 0.5 g of sodium acetate powder and stirred for 20 min in water-ice bath. A dark precipitate of the azo compound was obtained, filtered and dried under vacuum. Yields ranged between 50 and 60%.
4’-hydroxy-azobenzene (3e): Aniline and phenol were used as starting reagents. The crude product was extracted and crystallized from boiling n-octane (100 mL) and dried. Final crystallization from boiling water gave pure
3e, as orange/yellow crystals. Polarized optical microscopy allowed the observation of needle crystals of the
azo compound. Yield: 56%. 1H NMR (DMSO-d6): δ (ppm) = 7.81 (t, 4H), 7.54 (m, 3H), 6.96 (d, 2H).
4’-hydroxy-4-methoxy-azobenzene (3f): p-anisidine and phenol were used as starting reagents. The crude product was extracted and crystallized from boiling n-octane (100 mL) and dried. Final crystallization from boiling
water/ethanol (3:1) gave pure 3f, as dark orange crystals. Polarized optical microscopy showed a plate
crystalline habitus. Yield: 58%. 1H NMR (DMSO-d6): δ (ppm) = 7.80 (dd, 4H), 7.51 (s, 2H), 7.11 (d, 2H), 6.93 (d,
2H), 3.86 (s, 3H).
4’-hydroxy-4-methyl-azobenzene (3g): p-toluidine and phenol were used as starting reagents. The crude product was extracted and crystallized from boiling n-octane (100 mL) and dried. Final crystallization from boiling
water/ethanol (3:1) gave pure 3g, as brilliant yellow crystals. Polarized optical microscopy showed a needle
crystalline habitus. Yield: 60%. 1H NMR (DMSO-d6): δ (ppm) = 7.75 (dd, 4H), 7.54 (s, 2H), 7.35 (d, 2H), 6.93 (d,
2H), 2.39 (s, 3H).
3.4 Antimicrobial tests
Bacterial strains and minimum inhibitory concentrations
The in vitro minimal inhibitory concentrations (MIC) of each compound was determined against Candida albicans SC5314 by the micro-broth dilution method in 96-well plates according to the guidelines suggested by the Clinical and Laboratory Standards Institute (CLSI) [18] using three separate plates each containing the same batch of azo compounds.
Microtiter plates containing 100 µL of two-fold serial dilutions of azo compounds in RPMI 1640 medium were inoculated with 100 µL of cells containing 2.5·103 yeast/mL and incubated at 35 °C for 24 h. The resulting MICs
were visually read as the lowest concentration of compound causing a reduction or an absence of growth (optically clear) in comparison to the drug-free growth control.
For S. aureus A170 a clinically isolated gentamicin resistant strain (kindly provided by Prof. R. Capparelli from
the University of Naples, Italy) and P. aeruginosa ATCC-27853, MIC values of each compound were
determined by the serial broth microdilution method as reported by Patton [19]. Therefore, flat-bottom polystyrene microtiter plates containing 100 μL of two-fold serial dilutions (six replicates per dilution) of azo
compounds were inoculated with 100 μL of ∼5·105 CFU/mL of each bacterium grown in Mueller–Hinton broth
9
Plates were incubated at 37 °C with shaking at 160 rpm for 24 h. Data were analyzed according to Patton et al. [19]. The optical density (OD) was determined just before the incubation (T0) and again after 24 h incubation
(T24) at 600 nm. The OD for each replicate at T0 was subtracted from the OD for each replicate at T24. The
adjusted OD of each control well was then assigned a value of 100% growth. The MIC is reported as the lowest concentration of azo compounds, which results in 100% or 50 % inhibition of growth.
Candida albicans morphological analysis
Hyphal growth of Candida treated cells was induced using RPMI 1640 medium. Stationary yeast cells were
inoculated into a fresh pre-warmed medium at a density of 6×10⁶ cells/mL in a flat-bottom 96 well microtiter
plates. Different concentrations of azo compounds (ranging from 1 to 50 µg/mL), were added to each well. After incubation at 37 ºC for 24 h, each microtiter plate was examined using an inverted microscope to monitor phenotypic modification and hyphae formation.
3.5. QSAR analysis
For the series of 14 azobenzenes molecules we have calculated 3780 chemical descriptors by means of the PaDel tool [20] and the Genetic algorithms available in the program Materials Studio [21].
The 3780 parameters calculated have been standardized by range between -1 and 1. The regression was made using the inverse of MIC50 against S. aureus.
The number of descriptors in the regression equation was set to 2, and Population and Generation were set to 5000 and 50000, respectively. Mutation probability was 0.1, and the smoothing parameter was 0.5.
The choice of the models was based on Friedman’s Lack of Fit (LOF) calculated as follows:
=
1 − + Equation 2
whereas, SSE is the sum of squares of errors, c is the number of terms in the model, other than the constant
term, d is a scaled smoothing parameter, p is the total number of descriptors contained in all model terms
(again ignoring the constant term), M is the number of samples in the training set, and λ is a safety factor, with a value of 0.99, to ensure that the denominator of the expression can never become zero, and so the LOF is always well-defined.
An adjusted R2 estimation, where the variance is reduced in proportion to the size of the estimated model. The
adjusted R2 is calculated as follows:
1 − /( − ) /( − 1) Equation 3
where p is the number of parameters in the regression equation. SST is the total sum of squares, and n is the
number of data points from which the model is built. Compared to R2, this measure penalizes large equations.
The Cross validated R-squared (R2(CV)) is also a key measure of the predictive power of a model. The closer
the value is to 1.0, the better the predictive power. For a good model, R2(CV) should be fairly close to R2. If
R2(CV) is much less than R2, the model equation is probably overfitting the data. A model with an R2(CV)
value of 0.0 or less has no predictive power at all, according to the cross-validation criterion. The R2 (CV) is calculated as follows:
10
where PRESS is the predictive sum of squares of a model. After a required group of data is deleted, the remaining data in x is used to produce a new model for y. These predicted values of y are compared with the exact values that have been excluded.
( ) = −
Equation 5
A model is produced for each row or group of rows excluded.
An indication of whether or not the regression is statistically significant. Yes if F > Fcr, No if not. F is the significance-of-regression F value and Fcr is the critical SOR F value (95%).
The F test is a standard statistical test for the equality of the variances of two populations having normal distributions. Here, it is used to test whether the variance in the data which is explained by the regression is much larger than the variance remaining due to errors. If this is the case, then the model is said to be significant, rather than one which simply fits the noise [22].
The significance-of-regression F value is defined as:
/( − 1) /( − ) Equation 6
This parameter is used to determine whether or not the regression is statistically significant.
The critical significance-of-regression (SOR) F value is the critical point of the F distribution of degrees n - p
and p - 1 evaluated for probability 0.05 (at 95% confidence level). In conjunction with the significance-of-regression F value, it is used to determine whether or not the significance-of-regression is significant.
4. Conclusions
Some novel derivatives of (4’-hydroxy-(4-hydroxy-3,5-dimethyl)-azobenzene) were designed, synthesized, and biologically evaluated as antimicrobial agents.
The majority of synthesized compounds exhibited significant antibacterial activity against S. aureus and
antifungal activity against C. albicans, but they were inactive against Gram-negative bacteria such as P.
aeruginosa. The best results were obtained for 3b (4-hydroxy-3,5-dimethyl-azobenzene), which showed antibacterial activity against S. aureus higher than lead compound. The best antifungal activity was obtained
for 3g (4’-hydroxy-4-methyl-azobenzene) that was able to inhibit the growth of 100% of C. albicans at a
concentration five times lower than the lead compound.
Structure-activity relationship studies were capable to rationalize the effect of different substitutions on the phenyl ring of the azobenzene on antimicrobial activity. Changing the electronic nature and the position of the substituent group attached to the aromatic ring led to changing the observed MIC. These observations suggest that the killing ability depends mainly by the interaction of a not yet identified receptor. The best QSAR model explains the role of polarity and ionizability in determining the killing capacity of the synthetized compounds and suggests that these molecules interact with protein receptors and that the interaction with membranes is of minor importance. The solubility and the partition coefficient may rationalize the apparent
poor activity of the compound 3d. Taken together, these results can be extremely promising for the design of
novel azobenzene based antibiotics.
Author Contributions: S. Concilio, S. Piotto and P. Iannelli designed the idea, and the protocol of the study. S. Concilio helped in synthesizing the compounds and wrote the manuscript. L. Sessa and R. Diana synthesized the compounds, wrote the experimental parts and interpreted the experimental data. S. Piotto performed the computational analysis and wrote the manuscript. A. Porta and A. M. Petrone performed the biological studies and wrote the experimental data. All the authors revised the whole manuscript.
11
and designed the experiments; X.X. performed the experiments; X.X. and Y.Y. analyzed the data; W.W. contributed reagents/materials/analysis tools; Y.Y. wrote the paper.” Authorship must be limited to those who have contributed substantially to the work reported.
Conflicts of Interest: The authors declare no conflict of interest.
References
1. Ball, A.P.; Bartlett, J.G.; Craig, W.A.; Drusano, G.L.; Felmingham, D.; Garau, J.A.; Klugman, K.P.; Low,
D.E.; Mandell, L.A.; Rubinstein, E., et al. Future trends in antimicrobial chemotherapy: Expert opinion on the 43rd icaac. Journal of Chemotherapy 2004, 16, 419-436.
2. Liu, C.; Bayer, A.; Cosgrove, S.E.; Daum, R.S.; Fridkin, S.K.; Gorwitz, R.J.; Kaplan, S.L.; Karchmer, A.W.;
Levine, D.P.; Murray, B.E. Clinical practice guidelines by the infectious diseases society of america for the
treatment of methicillin-resistant staphylococcus aureus infections in adults and children. Clinical
infectious diseases 2011, ciq146.
3. Smith, A. Bacterial resistance to antibiotics. Hugo and Russell’s Pharmaceutical Microbiology 2004, 220-223.
4. Wright, G.D. Bacterial resistance to antibiotics: Enzymatic degradation and modification. Advanced drug
delivery reviews 2005, 57, 1451-1470.
5. Stewart, P.S.; Costerton, J.W. Antibiotic resistance of bacteria in biofilms. The lancet 2001, 358, 135-138.
6. Tenover, F.C. Development and spread of bacterial resistance to antimicrobial agents: An overview.
Clinical Infectious Diseases 2001, 33, S108-S115.
7. Smith, A.W. Biofilms and antibiotic therapy: Is there a role for combating bacterial resistance by the use
of novel drug delivery systems? Advanced drug delivery reviews 2005, 57, 1539-1550.
8. Jenssen, H.; Hamill, P.; Hancock, R.E. Peptide antimicrobial agents. Clinical microbiology reviews 2006, 19, 491-511.
9. Piotto, S.; Concilio, S.; Sessa, L.; Porta, A.; Calabrese, E.C.; Zanfardino, A.; Varcamonti, M.; Iannelli, P.
Small azobenzene derivatives active against bacteria and fungi. European Journal of Medicinal Chemistry
2013, 68, 178-184.
10. Concilio, S.; Iannelli, P.; Sessa, L.; Olivieri, R.; Porta, A.; De Santis, F.; Pantani, R.; Piotto, S. Biodegradable
antimicrobial films based on poly (lactic acid) matrices and active azo compounds. Journal of Applied
Polymer Science 2015, 132.
11. Piotto, S.; Concilio, S.; Sessa, L.; Iannelli, P.; Porta, A.; Calabrese, E.C.; Galdi, M.R.; Incarnato, L. Novel antimicrobial polymer films active against bacteria and fungi. Polymer Composites 2013, 34, 1489-1492. 12. Sessa, L.; Concilio, S.; Iannelli, P.; De Santis, F.; Porta, A.; Piotto, S. In Antimicrobial azobenzene compounds
and their potential use in biomaterials, AIP Conference Proceedings, 2016; AIP Publishing: p 020018.
13. Cariati, F.; Caruso, U.; Centore, R.; De Maria, A.; Fusco, M.; Panunzi, B.; Roviello, A.; Tuzi, A. Optical
second order nonlinearities in new chromophores obtained by selective mono-reduction of dinitro precursors. Optical Materials 2004, 27, 91-97.
14. Piotto, S.; Trapani, A.; Bianchino, E.; Ibarguren, M.; López, D.J.; Busquets, X.; Concilio, S. The effect of
hydroxylated fatty acid-containing phospholipids in the remodeling of lipid membranes. Biochimica et
Biophysica Acta - Biomembranes 2014, 1838, 1509-1517.
15. Scrima, M.; Di Marino, S.; Grimaldi, M.; Campana, F.; Vitiello, G.; Piotto, S.P.; D'Errico, G.; D'Ursi, A.M.
Structural features of the c8 antiviral peptide in a membrane-mimicking environment. Biochimica et
Biophysica Acta - Biomembranes 2014, 1838, 1010-1018.
16. Acierno, D.; Amendola, E.; Bugatti, V.; Concilio, S.; Giorgini, L.; Iannelli, P.; Piotto, S.P. Synthesis and characterization of segmented liquid crystalline polymers with the azo group in the main chain.
Macromolecules 2004, 37, 6418-6423.
17. Ghose, A.K.; Viswanadhan, V.N.; Wendoloski, J.J. Prediction of hydrophobic (lipophilic) properties of
small organic molecules using fragmental methods: An analysis of alogp and clogp methods. The Journal
of Physical Chemistry A 1998, 102, 3762-3772.
18. CLSI, C. Reference method for broth dilution antifungal susceptibility testing of yeasts; approved
12
19. Patton, T.; Barrett, J.; Brennan, J.; Moran, N. Use of a spectrophotometric bioassay for determination of
microbial sensitivity to manuka honey. Journal of Microbiological Methods 2006, 64, 84-95.
20. Yap, C.W. Padel-descriptor: An open source software to calculate molecular descriptors and fingerprints.
Journal of computational chemistry 2011, 32, 1466-1474.
21. Accelrys Accelrys materials studio. Accelrys inc., san diego, california, 2014.
22. Todeschini, R.; Consonni, V. Molecular descriptors for chemoinformatics, volume 41 (2 volume set). John Wiley & Sons: 2009; Vol. 41.