Hadronic Resonances from STAR
Masayuki Wada (for the STAR collaboration)The University of Texas at Austin
Abstract. The results of resonance particle productions (ρ0,ω,
K∗,φ,Σ∗, andΛ∗) mea-sured by the STAR collaboration at RHIC from various colliding systems and energies are presented. Measured mass, width,pT, and yield of those resonances are reviewed. No significant mass shifts or width broadening beyond the experiment uncertainties are observed. New measurements ofφandωfrom leptonic decay channels are presented. The yields from leptonic decay channels are compared with the measurements from hadronic decay channels and the two results are consistent with each other.
1 Introduction
Ultra-relativistic heavy ion collisions are an effective way to create hot and dense strongly interacting matter in laboratories. Hadronic resonance particles can be used as probes to study this strongly inter-acting matter because of their short lifetimes compared to that of the fireball. In-medium modification of their masses and widths are expected in hot and dense mediums [1, 2]. If those modifications exist, it could possibly indicate chiral symmetry restoration. In hadronic decay channels, yield and momentum spectra of resonances may be modified due to resonance decay and the subsequent re-scattering of their decay daughters as well as the re-generation of resonances during the fireball lifetime. By con-trast, di-leptons can probe the whole evolution of the collision without the hadronic medium effects at the later stage because of the relatively small cross section of leptons with the hadronic medium. Combined with ionization energy loss (dE/dx) information from the Time Projection Chamber (TPC), the newly installed Time of Flight detector (TOF) [3] provides a clean particle identification (PID) at low and intermediate momentum (p=0.2-2.0 GeV/c), which enable us to measure resonance parti-cles through the rare di-electron channel. A difference in resonance yields and momentum spectra in heavy ion collisions from hadronic and leptonic decay channels may show the signatures of the initial production of resonances which are probably washed out in hadronic decay channels but remains in leptonic decay channels. Theφmeson is one of the resonance particles of which the measurements from both leptonic and hadronic decay channels are possible.
Data shown here were measured by the STAR collaboration at RHIC. In STAR, many resonance particles are measured in several collision systems (p+p, d+Au, Cu+Cu, and Au+Au) and energies (only √sNN =62.4 and 200 GeV are presented). In this paper, we summarize those results by compar-ing the masses, widths, dN/dy, and mean transverse momentum of resonance particles from different collision systems and energies. In Table 1, the Particle Data Group (PDG) values [4] for the mass, width , lifetime, and decay channels of hadronic resonances are summarized.
2 Resonances from hadronic decay channels
2.1 Masses and Widths
In this section, we focus on the differences of the masses and widths among collision systems and energies.
DOI: 10.1051/ C
Owned by the authors, published by EDP Sciences, 2012 epjconf 20123/ 600020
This is an Open Access article distributed under the terms of the Creative Commons Attribution License 2.0, which permits unrestricted use, distribution, and reproduction in any medium, provided the original work is properly cited.
1
Table 1: Resonances from PDG [4].
particle Mass (MeV/c2) Width (MeV/c2) Lifetime (fm/c) Decay channel
ρ0(770) 775.49±0.34 149.1±0.8 1.32 π+π
ω(782) 782.65±0.12 8.49±0.08 23.2 e++e− K∗0(892) 895.94±0.22 48.7±0.8 4.05 K+π
φ(1020) 1019.455±0.020 4.26±0.04 46.3 K+K,e++e− Σ∗+(1385) 1382.80±0.35 36.0±0.7 5.48 Λ(→p+π)+π+
Σ∗−(1385) 1387.2±0.5 39.4±2.1 5.01 Λ(→p+π)+π−
Λ∗(1520) 1519.5±1.0 15.6±1.0 12.6 K+p
In Fig. 1a, the invariant mass ofπ+π−after like-sign background subtraction in minimum bias (MB) p+p (upper) and peripheral (40-80% central) Au+Au (lower) collisions are presented. Theρ0signal is fitted with a relativistic Breit-Wigner function multiplied by a phase factor with a fixed width ofΓ= 160 MeV/c2 which is consistent with theρ0 natural width folded with intrinsic detector resolution. Theρ0masses shown in Fig. 1b are obtained by the fit as a function of pT. The measuredρ0peak in the invariant mass distribution is lower than the PDG value by∼30–70 MeV/c2in all systems at low
pT. Effects such as phase space and dynamical interactions with matter may explain this modification of theρ0mass [7].
0 5 10 15
Sum 0 S K ω
*0 K
0
ρ
0 f
2 f Minimum Bias pp
< 0.8 GeV/c
T
p
≤
0.6
Invariant Mass (GeV/c2)
0.4 0.6 0.8 1 1.2 1.4
Counts x 10
3/(10 MeV/c 2)
0 10 20 30 40 50 60 70
Peripheral Au+Au < 0.8 GeV/c
T
p
≤
0.6
Invariant Mass (GeV/c2) 0 0.5 1 1.5 2
Counts x10
6
0 1 2 3 4
(a)ππinvariant mass distributions [5] (b) Fit mass vs.pT[6]
Fig. 1: ρ0→π+π−invariant mass distributions and mass shifts
(a):The invariant mass ofπ+π−in p+p (upper panel) and Au+Au (lower panel) collisions. Theρ0 signals are fit by the relativistic Breit-Wigner function times phase factor with fixed width.(b):Theρ0 mass vs.pTin MB p+p and d+Au and peripheral Au+Au collisions at √sNN =62.4 and 200 GeV. The green line shows the PDG value ofρ0mass.
In Fig. 2a, theKπinvariant mass distributions after the mix-event background subtraction in MB p+p and 0-10% central Au+Au collisions at √sNN =200 GeV are presented. TheK∗
0signals are fit
)
2
Mass (MeV/c
870 880 890 900
pp Minbias MC (pp) 0-10% central AuAu MC (0-10% central AuAu)
(GeV/c)
T
p
0 0.5 1 1.5 2 2.5 3
)
2
Width (MeV/c
20 40 60 80 100
120 pp Minbias
MC (pp) 0-10% central AuAu MC (0-10% central AuAu)
(a)Kπinvariant mass distribution [8]
)
2
Mass (MeV/c
870 880 890 900
pp Minbias MC (pp) 0-10% central AuAu MC (0-10% central AuAu)
(GeV/c)
T
p
0 0.5 1 1.5 2 2.5 3
)
2
Width (MeV/c
20 40 60 80 100
120 pp Minbias
MC (pp) 0-10% central AuAu MC (0-10% central AuAu)
(b)K∗0mass and width [8]
(GeV/c) T p
0 0.5 1 1.5 2 2.5 3 3.5 4 4.5
)
2
Mass (GeV/c
0.86 0.88 0.9 0.92 0.94
Au+Au 62.4 GeV Au+Au 200 GeV Cu+Cu 62.4 GeV Cu+Cu 200 GeV PDG value (a)
(c) Fit mass [9]
(GeV/c) T p
0 0.5 1 1.5 2 2.5 3 3.5 4 4.5
)
2
Width (GeV/c
0.02 0.04 0.06 0.08 0.1
Au+Au 62.4 GeV Au+Au 200 GeV Cu+Cu 62.4 GeV Cu+Cu 200 GeV PDG value (b)
(d) Fit width [9]
Fig. 2: K∗0→πK in p+p, Cu+Cu, and Au+Au at√s
NN=62.4 and 200 GeV
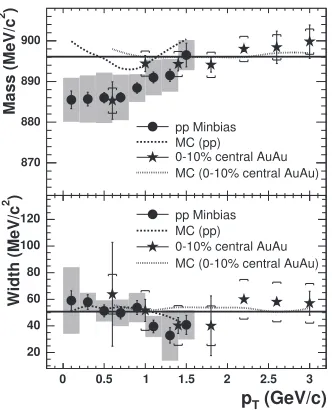
(a):The invariant mass ofKπin p+p (lower panel) and Au+Au (upper panel) collisions at √sNN = 200 GeV.(b):TheK∗0mass and width in MB p+p and 0-10% central Au+Au collisions at √s
NN = 200 GeV. The solid straight lines are the PDG K∗0 values. The dashed and dotted curves are the Monte Carlo simulation results. The grey shadows (caps) indicate the systematic uncertainties for the measurement in MB p+p interactions (central Au+Au collisions).(c,d):TheK∗0mass and width in MB Cu+ Cu and Au+ Au collisions at √sNN =62.4 and 200 GeV. The dashed lines represent the PDG values. The error bars and the gray shadows show statistical and systematical uncertainties, respectively.
for energy loss due to multiple scattering in the TPC, other detector effects may not be fully accounted for.
1 1.02 1.04 1.06
0 50000 100000
Au+Au 200 GeV
< 1.0 GeV/c
T
0.6 < p Exp. data mass = 1.019 GeV width = 8.46 MeV
mass = 1.019 GeV width = 6.36 MeV
MC data (1)
MC data (2) mass = 1.019 GeV width = 8.45 MeV 0
200 400
p+p 200 GeV
< 1.0 GeV/c
T
0.6 < p Exp. data mass = 1.019 GeV width = 8.28 MeV
mass = 1.019 GeV width = 6.15 MeV
MC data (1)
Entries/MeV
) 2 Invariant Mass (GeV/c
(a)K+K−invariant mass distribution [10]
1.01 1.012 1.014 1.016 1.018 1.02 1.022
open: MC data full: experimental data
PDG value Au+Au 200 GeV Au+Au 62.4 GeV
p+p 200 GeV d+Au 200 GeV
(GeV/c)
T
p
0 0.5 1 1.5 2 2.5 3 3.5 4 4.5 5 -6
-4 -2 0 2 4 6 8 10 12 14
open: MC data full: experimental data
PDG value Au+Au 200 GeV
Au+Au 62.4 GeV d+Au 200 GeV
p+p 200 GeV
)
2
Mass (GeV/c
)
2
Width (MeV/c
(b)φmeson mass and width [10]
)
2
(GeV/c
inv
M
0.98 1 1.02 1.04 1.06 1.08 1.1
)
2
(1/MeV/c
inv
dN/dM
0 1000 2000 3000 4000
5000 10-20% Cu+Cu 200 GeV
< 1.5 GeV/c
T
1.2 < p
(c)K+K−invariant mass distribution in Cu+Cu collisions [11]
(GeV/c)
T
Transverse Momentum p
0 1 2 3 4 5
)
2
Mass (GeV/c
φ
1.015 1.016 1.017 1.018 1.019 1.02 1.021 1.022 1.023 1.024
0-10% 10-20% 20-30% 30-40%
40-50% 50-60%
Monte Carlo (embedding)
Cu+Cu 200 GeV
(d)φmeson width in Cu+Cu collisions [11]
Fig. 3: φ→K+K−in p+p, Cu+Cu, and Au+Au at √sNN =62.4 and 200 GeV
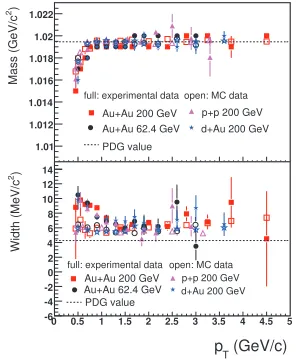
(a): The invariant mass distributions of K+K− in p+ p (upper panel) and Au+ Au (lower panel) collisions at √sNN =200 GeV. Theφmeson signals are fit with a non-relativistic Breit-Wigner function superimposed on a linear background function. Open and solid symbols respectively represent the experimental data and the MC simulation results.(b):The masses and widths ofφmeson as a function of pT in p+p 200 GeV (NSD), d+Au 200 GeV (0-20%), Au+Au 62.4 GeV (0-20%), and Au+ Au 200 GeV (0-5%) collisions, with the corresponding PDG values.(c):The invariant mass ofK+K−
in Cu+ Cu collisions at √sNN =200 GeV.(d): Theφmeson mass as a function of pT for various centralities in Cu+Cu collisions at √sNN =200 GeV.
Figures 3a and 3c show the invariant mass distributions ofφ→K+K−in the non-single diffractive (NSD) p+p, 0-5% central Au+Au, and 10-20% central Cu+Cu collisions at √sNN =200 GeV to-gether with two MC simulation results using different momentum resolution settings. The lines show the non-relativistic Breit-Wigner functions superimposed on linear background functions. The mea-suredφmeson masses are lower than the MC data at low pT in all collision systems and energies at
scattering energy loss of low pT tracks in the TPC. Since p+p collisions also show the mass shifts from the MC data, this is unlikely the in-medium modification we are looking for. In Fig. 3b (lower panel), the measuredφmeson widths are presented and are larger than the MC simulation results [MC data set (1)]. If the momentum resolution for low pT kaons used in the simulations is increased by 50% [MC data set (2)], theφmeson width from the simulation reproduces the measured width from real data as shown by the open diamond points.
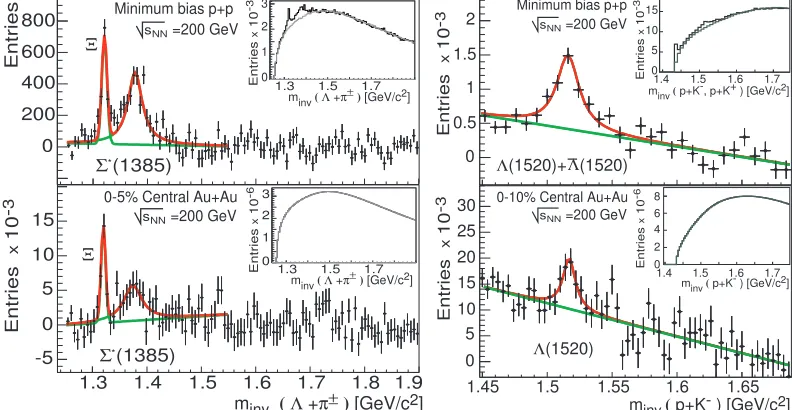
Figure 4 shows the invariant mass distributions of Λπ± (left panel) and pK (right panel) after the mix-event background subtraction in MB p+ p and central Au+Au collisions at √sNN = 200 GeV. In order to enhance the statistics the two chargedΣ∗±are combined for the p+p collision data and all four chargedΣ∗±+Σ¯∗± are combined for the Au + Au collision data. For theΛ∗, particle and anti-particle,Λ(1520)+ Λ¯(1520), are combined for the p + p collision data and onlyΛ(1520) is used for the Au+ Au collision data. BothΣ∗ andΛ∗ invariant mass distributions are fit with the non-relativistic Breit-Wigner function (red lines) plus linear background function (green lines). The fit results are summarized in Table 2. The measured masses and widths are in agreement with the PDG values within the errors except the masses ofΣ∗, which shows small differences (∼5MeV/c2).
0 200 400 600 800 NN s (1385) * Σ Ξ
1.3 1.4 1.5 1.6 1.7 1.8 1.9 -5 0 5 10 15 (1385) * Σ Ξ
1.3 1.5 1.7 0 1 2 3 0 1 2 3
1.3 1.5 1.7
minv (Λ +π±) [GeV/c2]
Entries x 10 -3
Entries Entries minv ( Λ +π±) [GeV/c2]
x 10 -3 Entries x 10 -6
minv ( Λ +π±) [GeV/c2] Minimum bias p+p
=200 GeV
NN s
0-5% Central Au+Au =200 GeV
1.45 1.5 1.55 1.6 1.65 0 5 10 15 20 25 30
1.4 1.5 1.6 1.7
0 2 4 6 8 0 0.5 1 1.5 2
1.4 1.5 1.6 1.7
0 5 10 15 (1520) Λ (1520)+ Λ Entries x 10 -3 Entries x 10 -3 Entries x 10 -3 Entries x 10 -6 (1520) Λ
minv ( p+K-, p+K+ ) [GeV/c2]
minv ( p+K- ) [GeV/c2]
minv( p+K- ) [GeV/c2]
NN s
Minimum bias p+p =200 GeV
NN s
0-10% Central Au+Au =200 GeV
Fig. 4: Invariant mass distribution ofΛπ±(left panel) andpK(right panel) in MB p+p and central Au +Au collisions at √sNN =200 GeV [12]
particle M (MeV/c2) Γ(MeV/c2)
Σ∗(p+p) 1376±3±3 44±8±8
Σ∗(Au+Au) 1375±5±3 43±5±6
Λ∗(p+p) 1516±2±2 20±4±2
Λ∗(Au+Au) 1516±2±2 12±6±3
2.2 Mean Transverse Momentum and dN/dy
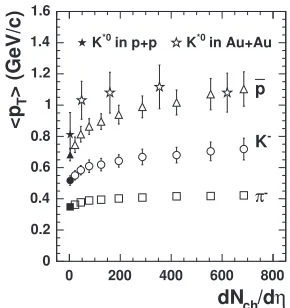
It is known that thepTof the particles strongly depends on their masses as shown in Fig. 5. This can be explained by the hydrodynamic expansion picture [13] or the multiple minijets contributions [14]. From this dependency, resonance and non-resonance particles which have similar masses are expected to have similarpT. As showed in Fig. 6, however, thepTofK∗is higher than that of ¯p. A possible explanation is that the signal loss of resonances due to re-scattering of daughter particles in the hadronic medium occurs mostly at the low momentum region (pT <1GeV/c) [15]. In consequence,
the reconstructed transverse momentum spectra are expected to have higher inverse slope parameters and higherpT.
0 0.2 0.4 0.6 0.8 1 1.2 1.4 1.6 1.8
0 0.2 0.4 0.6 0.8 1 1.2 1.4 1.6
) 2 Mass (GeV/c
0 0.2 0.4 0.6 0.8 1 1.2 1.4 1.6 1.8
> (GeV/c)T
<p
0 0.2 0.4 0.6 0.8 1 1.2 1.4 1.6
0 0.2 0.4 0.6 0.8 1 1.2 1.4 1.6 1.8
0 0.2 0.4 0.6 0.8 1 1.2 1.4 1.6
0 0.2 0.4 0.6 0.8 1 1.2 1.4 1.6
π Ks0
-K ρ K*p
0
fφ ΛΔ++Ξ -+
Ξ
*
Σ Λ* Ω -Central Au+Au
MinBias d+Au MinBias p+p
0
Fig. 5:pTvs. particle masses at√sNN=200 GeV. The errors shown are the quadratic sum of statisti-cal and systematistatisti-cal uncertainties. [16]
η
/d ch dN
0 200 400 600 800
> (GeV/c)T
<p
0 0.2 0.4 0.6 0.8 1 1.2 1.4 1.6
in p+p *0
K K*0 in Au+Au
p
-K
-π
Fig. 6: K∗0pT as a function ofdNch/dη compared to that of stable particles in MB p+p and Au+Au collisions. [8]
Figure 7 shows the double ratios of resonance to stable particle for Au+Au (Cu+Cu) to p+p colli-sion systems [5, 9, 11, 12, 18]. The supprescolli-sion of the ratios from unity in heavy ion collicolli-sions indicate extended hadronic medium in which the loss due to the re-scattering of the decay daughters is larger than the gain from the re-generation of the resonance particles. The suppression of theK∗resonance in the hadronic decay channelK∗→K+πindicates that the re-scattering cross section,σππ, is larger than re-generation cross section,σπK. In contrast, the double ratio of theφmeson is consistent with unity owing to its relatively long lifetime and the negligible re-generation cross section,σKK. Since
Λ∗shows the largest suppression, it is most sensitive to this effect and more detailed study is desired. From these suppressions, the life time of the hadronic medium can be calculated [17].
η
/d ch dN
1 10 102 103
pp
/Ratio
AA
Ratio
0 0.5 1 1.5 2
p+p Au+Au
Cu+Cu
Au+Au
-K*/K
-/K φ
Λ */ Λ
Λ */
Σ
-π / 0 ρ
Cu+Cu
-K*/K
-/K φ
Λ */ Λ
= 200 GeV
NN
s
STAR Preliminary
Fig. 7: Double ratios of resonance to stable particle for Au+Au (Cu+Cu) to p+p collision systems at
√
] 2 Invariant Mass [GeV/c
0.9 1 1.1 1.2 1.3
Entries
-2000 0 2000 4000
signal=23690
S/stat.Err=12.49 : 0.3-2.5 GeV/c
T
p
STAR Preliminary
(a)e+e−invariant mass distribution
[GeV/c] T p
0 1 2
]
-2
dy [(GeV/c)T
dpT
p
π
N/2
2
d
-2 10
-1 10
1 10
STAR Au+Au (0-80%) (stat. err)
-K
+
K
→ φ
Run4
-e
+
e
→ φ
Run10
Errors are stat. + sys.
STAR Preliminary
(b) Correctedφmeson yields comparison
[GeV/c] T p
0 0.5 1 1.5 2 2.5
]
2
Mass [GeV/c
1.01 1.015 1.02 1.025 1.03
Simulation Data Fit PDG value
STAR Preliminary
(c)φmeson mass vs.pT
[GeV/c] T p
0 0.5 1 1.5 2 2.5
]
2
Wi
d
th
[
G
e
V
/c
0 0.01 0.02 0.03 0.04 0.05
Simulation Data Fit PDG value
STAR Preliminary
(d)φmeson width vs.pT
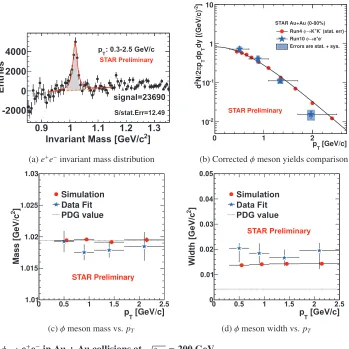
Fig. 8:φ→e+e−in Au+Au collisions at √sNN =200 GeV
(a):ThepT integratedφ→e+e−signals. The red solid line is the non-relativistic Breit-Wigner func-tions representing theφsignals and the orange dashed slope shows the residual backgrounds.(b):The corrected yields within rapidity|y|< 1 for the 0-80% centrality events are represented by blue stars. The vertical bars are statistical errors and the boxes are the sum of systematic and statistical errors in quadrature. For comparison, the hadronic channel results [10] are plotted with red points and system-atical error bars together with the exponential fit function (solid line) to the hadronic channel result. (c,d):mass (left) and width (right) vs. transverse momentum. The fit values and simulation results are respectively plotted in solid star and circles with statistical uncertainties. The dashed lines show the PDG values. [19]
3 Resonances from leptonic decay channels
respectively. The error bars are statistical errors (fit parameter errors) only. Simulation results and PDG values are plotted with red points and dashed lines, respectively. The fit, simulation, and PDG values of the mass are consistent within ∼ 1.5σ. On the other hand, the fit decay widths show significant discrepancy from the PDG value. This width broadening, however, can be explained by the momentum resolution of the detector entirely because the simulation results also shows the broadening.
The ω → e+e−is also measured in STAR [20, 21]. The invariant mass distributions of thee+e−
pairs after the mixed-events background subtraction in p + p and Au + Au collisions at √sNN = 200 GeV are presented in Fig. 9. The signal and residual background line shapes are obtained from cocktail simulations and they are fit to the data to obtain signal yields [21]. Figure 9 (right panel) shows corrected transverse momentum spectra ofω→e+e−in p+p and Au+Au collisions at √sNN =200 compared to the published PHENIX result [22] and predictions from Tsallis Blast-Wave function fits [23]. The results agree with the previous result in p+p collisions and the predictions in both p+p and Au+Au collisions.
(a)e+e−invariant mass distribution
(GeV/c) T p
0 1 2 3
-2
dy) (GeV/c) T
dp
T
p
π
N/(2
2
d
-4 10
-2 10
1 2 10
Au+Au 0-80% ω
STAR
TBW fit to light hadrons p+p
ω STAR
p+p ω PHENIX TBW fit to high pT
STAR preliminary
(b) Correctedωyields [21]
Fig. 9:ω→e+e−in p+p and Au+Au collisions at √sNN =200 GeV
(a):ThepT integrated invariant mass signals in p+p (upper panel) and Au+Au (lower panel) col-lisions. The black solid lines and green dashed lines in both figures respectively representωsignals and residual backgrounds obtained from cocktail simulation [21].(b):Theω→e+e−invariant yield, divided by its B.R., in NSD p+p and Au+Au collisions at √sNN =200 GeV [20]. The circles rep-resent PHENIX published results [22]. The bars and boxes are statistical and systematic uncertainties, respectively. The black dashed line represents the yields ofωfrom the Tsallis Blast-Wave function fit.
4 Summary
Au+Au) and energies (only √sNN =62.4 and 200 GeV are presented) in STAR. ThepTofK∗shows the increase compared to that of ¯p, although expected to have similarpT. This could be explained by the re-scattering contribution from hadronic medium. The double ratio ofK∗/KandΛ∗/Λyields show suppression with centrality whileφ/K−stays at unity. This comes from differences in their lifetimes and cross sections of their daughter particles. New measurements of φ andωfrom leptonic decay channels are presented. Both results from leptonic decay channels and from hadronic decay channels are consistent. No signature of the chiral symmetry restoration is observed.
References
1. G. E. Brown and M. Rho, Phys. Rev. Let.66, 2720 (1991)
2. R. Rapp, J. Wambach, and H. van Hees, arXiv:0901.3289v1 [hep-ph]
3. B. Bonneret al., Nucl. Instr. Meth. A508, 181 (2003); M. Shaoet al., Nucl. Instr. Meth. A492, 344 (2002); J. Wuet al., Nucl. Instr. Meth. A538, 243 (2005)
4. J. Beringeret al.(Particle Data Group), Phys. Rev.D86, 010001 (2012) 5. J. Adamset al., Phys. Rev. Lett.92, 092301 (2004)
6. P. Fachini (STAR collaboration), Nucl.Phys. A830, 837c (2009) 7. R. Rapp, Nucl.Phys. A 725, 254 (2003)
8. J. Adamset al., Phys. Rev.C71, 064902 (2005) 9. M. M. Aggarwalet al., Phys. Rev.C84, 034909 (2011) 10. B. I. Abelevet al., Phys. Rev.C79, 064903 (2009) 11. B. I. Abelevet al., Phys. Lett. B673, 183 (2009) 12. B. I. Abelevet al., Phys. Rev. Lett.97, 132301 (2006) 13. P. F. Kolb and R. Rapp, Phys. Rev. C 67, 044903 (2003) 14. A.Dumitru and C. Spieles, Phys. Lett. B446, 326 (1999) 15. M. Bleicher, J. Aichelin, Phys. Lett. B530, 81 (2002) 16. B. I. Abelevet al., Phys. Rev.C78, 044906(2008)
17. C. Markert, G. Torrieri, and J. Rafelski, arXiv:hep-ph/0206260v2 18. Masayuki Wada (STAR collaboration), APS April Meeting 2011
19. Masayuki Wada (STAR collaboration), A. Phys. Pol. B Supp.5249 (2012) 20. Bingchu Huang (STAR collaboration), A. Phys. Pol. B Supp.5471 (2012) 21. L. Adamczyket al., Phys. Rev. C 86, 024906 (2012)
![Table 1: Resonances from PDG [4].](https://thumb-us.123doks.com/thumbv2/123dok_us/8072757.1346566/2.482.60.442.304.511/table-resonances-from-pdg.webp)
![Fig. 9:resent PHENIX published results [22]. The bars and boxes are statistical and systematic uncertainties,respectively](https://thumb-us.123doks.com/thumbv2/123dok_us/8072757.1346566/8.482.50.429.219.500/resent-phenix-published-results-statistical-systematic-uncertainties-respectively.webp)
