Copyright to IJIRSET www.ijirset.com 73
Project Performance Evaluation By Earned
Value Method
Antony Prasanth M A#, K Thirumalai Raja* #
Department of Civil Engineering, EBETi Kangayam, Thirupur Dist, Thamilnadu, Anna University Chennai
*
Associate professor, EBETi Kangayam, Thirupur Dist, Thamilnadu, Anna University Chennai
Abstract
—
Earned Value Management (EVM) is a project control technique which provides a quantitative measure of work performance. It involves a crediting (earning) of budget as scheduled work is performed. The earned value technique is a proven method to evaluate work progress in order to identify schedule slippage and areas of budget overruns. Value earned for a given task is computed as budgeted cost of work performed and is a function of time, work completed, and budget. Budgeted cost of work performed is compared against actual cost of work performed and budgeted cost of work scheduled to assess cost and schedule variances, respectively. Cost and schedule variances identified at the individual cost account level. Variances reported as a percent of the baseline and presented graphically. The work breakdown structure, detailed schedules and cost account budgets form the foundation for earned value assessment.Keywords
—
project management, earned value management, project performance evaluation, cost variance, schedule variance, cost performance index, schedule performance indexI. INTRODUCTION
Earned Value management is a method of performance measurement. Earned Value is a project management technique that uses “work in progress” to indicate what will happen to work in the future. Earned Value is an enhancement over traditional accounting progress measures. Traditional methods focus on planned, accomplishment (expenditure) and actual costs. Earned Value goes one step further and examines actual accomplishment. This gives managers greater insight into potential risk areas. With clearer picture, managers can create risk mitigation plans based on actual cost, schedule and technical progress of the work. It is an “early warning” program/project management tool that enables managers to identify and control problems before they become insoluble.
II. EVM IN CONSTRUCTION PROJECTS
Earned value is a project control technique which
provides cost and schedule performance measurements. It compares actual accomplishment of scheduled work and associated cost against an integrated schedule and budget plan. When earned value was first introduced, there was no doubt that the sponsors were looking for a much better insight into the progress of their projects from both a cost and a schedule standpoint than they had before. EVM provides project managers and the organization with triggers or early warning signals that allow them to take timely actions in response to indicators of poor performance and enhance the opportunities for project success. Better planning and resource allocation associated with the early periods of a project might be the cause of this reliability.
EVM can be used for progress payments to contractors based on the EV of contracted or outsourced work. Because such contractual arrangements create legal and financial obligations, it is important to consider the method specified for evaluating progress. The previously discussed alternatives for determination of percent complete should be carefully considered and negotiated to achieve a fair and equitable environment that encourages successful accomplishment of contracted or outsourced project items.
III. EVMMETRICS
The EVM covers some metrics which should be recognized by a company or organization which intends to apply this method. The use of metrics is important in the EVM. Three quantities form the basis for cost performance measurement using Earned Value Management. They are Planned Value (PV), Earned Value (EV) and Actual Cost (AC).
A. Project Plan Metric
Department of CIVIL, CSE, ECE, EEE, MECHNICAL Engg. and S&H of Muthayammal College of Engineering, Rasipuram, Tamilnadu, India
Copyright to IJIRSET www.ijirset.com 74 project plan is Budget Cost of Work Scheduled (BCWS)
which compromises the total planned costs for all tasks or subtasks to be achieved by a given point in time. In fact the PV is often denoted for the sum of budgets for all work packages scheduled to be accomplished within a given time period.
B. Project Accomplishment Metric
The metric which quantifies the accomplishment of work is called as Earned Value (EV). The EV reflects the amount of work that has actually been accomplished to date, expressed as the planned value for that work. The EV is often used interchangeably with the BCWP. The Budget Cost of Work Performed (BCWP) is the total planned cost associated with completed work or tasks or sub-tasks at a given point of time.
C. Project Actual Metric
One of the main aspects of controlling projects characteristics is controlling the actual costs of the project. Therefore, this amount can be compared with the other above mentioned amounts in order to apply EVM method. Actual Cost (AC) also known as Actual Cost of Work Performed (ACWP) is the total expenditure on tasks or sub-tasks at any point of time. The actual cost incurred in accomplishing the work performed within a given time period. For equitable comparison, ACWP is
only recorded for the work performed to date against tasks for which a BCWP is also reported.
D. Performance Measurement Baseline (PMB)
The sum of all work packages Budgeted Cost of Work Scheduled (BCWS) for each time period, calculated for the total program duration. The PMB forms the time-phased budget plan against which project performance is measured.
Fig: 1. Standard Earned Value Graph
IV.EVMPERFORMANCE ANALYSIS AND FORECASTING
PARAMETERS
EVM measures project performance for the current period and the cumulative performance till date. The important parameters like variances, indices, and forecasts that developed using Planned Value, Earned Value, and Actual Cost are discussed here.
A. Schedule Variance (SV)
The difference between the work actually performed (BCWP) and the work scheduled (BCWS). The schedule variance is calculated in terms of the difference in dollar value between the amount of work that should have been completed in a given time period and the work actually completed.
B. Cost Variance (CV)
The difference between the planned cost of work performed (BCWP) and actual cost incurred for the work (ACWP). This is the actual dollar value by which a
project is either overrunning or under running its estimated cost.
C. Cost Performance Index (CPI)
The ratio of cost of work performed (BCWP) to actual cost (ACWP). CPI of 1.0 implies that the actual cost matches to the estimated cost. CPI greater than 1.0 indicates work is accomplished for less cost than what was planned or budgeted. CPI less than 1.0 indicates the project is facing cost overrun.
D. Schedule Performance Index (SPI)
The ratio of work accomplished (BCWP) versus work planned (BCWS), for a specific time period. SPI indicates the rate at which the project is progressing.
E. Estimate At Completion (EAC)
Copyright to IJIRSET www.ijirset.com 75 common forecasting techniques are some variations of:
1. EAC = Actual to date plus a new estimate for all remaining work. This approach is most often used when past performance shows that the original estimating assumptions were fundamentally flawed, or they are no longer relevant to a change in conditions.
2. EAC = Actual to date plus remaining budget. This approach is most often used when current variances are seen as a typical and the project management team expectations are that similar variances will not occur in the future.
3. EAC = Actual to date plus the remaining budget modified by a performance factor, often the cumulative cost performance index (CPI).
This approach is most often used when current variances are seen as typical of future variances.
4. EAC = Budget at Completion (BAC) modified by a performance factor, cumulative cost performance
variances from BAC have occurred.
F. Estimate to Complete (ETC)
It is the difference between Estimate at Completion (EAC) and the Actual Cost (AC). This is the estimated additional cost to complete the project from any given time.
G. Variance at Completion (VAC)
It is the difference between Budget at Completion (BAC) and Estimate at Completion (EAC). This is the value by which the project will be over or under budget.
From these quantities we can determine our total program budget as well as make a determination of schedule and cost performance and provide an estimated cost of the project at its completion.
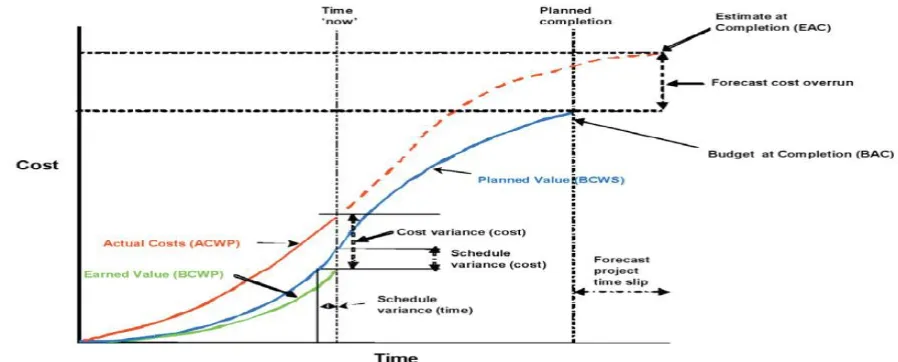
Fig: 2. Standard Earned Value elements
These variances, indices, and forecasts can be used to answer the key project management questions. Fig 2 is a graphical representation of standard earned value elements. Fig 3 shows the relationship between
those project management questions and the EVM performance measures. Fig 4 shows what EVM performance measures indicate about a project in regard to its planned work schedule and budget.
Project Management Questions To Calculate Formula
[1] How Are We Doing Time-Wise?- Schedule Analysis & Forecasting
Are we ahead or behind of schedule? Schedule Variance (SV) SV= EV-PV
Department of CIVIL, CSE, ECE, EEE, MECHNICAL Engg. and S&H of Muthayammal College of Engineering, Rasipuram, Tamilnadu, India
Copyright to IJIRSET www.ijirset.com 76 When are we likely to finish work? Time Estimate At Completion (EACt) (BAC / SPI)
(BAC/MONTHS) [2] How Are We Doing Cost-Wise? Cost Analysis & Forecasting
Are we under or over our budget? Cost Variance (CV) CV= EV-AC
How efficiency are we using resources? Cost Performance Index (CPI) CPI= EV/AC
What is the project likely to cost? Estimate At Completion (EAC) EAC= BAC/CPI
What we are under or over budget? Variance At Completion(VAC) VAC= BAC-EAC
What will be the remaining work cost? Estimate To Compete(ETC) (BAC-EV)/CPI
Fig: 3. Project management questions and EVM performance measures
PERFORMANCE MEASURES
SCHEDULE
SV > 0 & SPI > 1
SV =0 & SPI = 1
SV < 0 & SPI < 1
C
O
S
T
CV > 0 & CPI > 1
Ahead of Schedule Under Budget
On Schedule Under Budget
Behind Schedule Under Budget
CV = 0 & CPI = 1
Ahead of Schedule Under Budget
On Schedule On Budget
Behind Schedule On Budget
CV < 0 & CPI < 1
Ahead of Schedule Over Budget
On Schedule Over Budget
Behind Schedule Over Budget
Fig: 4. Interpretation of basic EVM performance measures
V.CASE STUDY
The selected site for case study is located in Mattampuram, Thrissur, Kerala. Thrissur Corporation decided to construct a housing colony under IHSDP (Integrated housing and slum development program). The facilities provides to the housing colony includes Power and street lighting, Water supply schemes, Roads and pavements, Community facilities, Housing project 240 flats, Sanitation, Solid waste management etc. In October 2013 the first phase of the project work is started, which is the construction of 120 flats. This is an ongoing project and details are given in the table 1.
TABLE I PROJECT DETAILS
Client Thrissur Corporation
Contractor COSTFORD, Thrissur
Name of the project IHSDP MATTAMPURAM Total duration 18 months
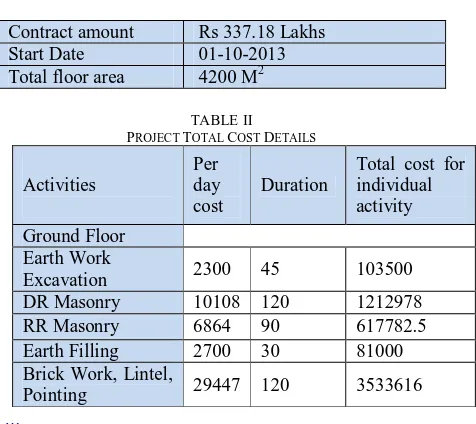
Contract amount Rs 337.18 Lakhs
Start Date 01-10-2013
Total floor area 4200 M2
TABLE II PROJECT TOTAL COST DETAILS
Activities
Per day cost
Duration
Total cost for individual activity
Ground Floor Earth Work
Excavation 2300 45 103500
DR Masonry 10108 120 1212978
RR Masonry 6864 90 617782.5
Earth Filling 2700 30 81000
Brick Work, Lintel,
Copyright to IJIRSET www.ijirset.com 77
Door, Window etc 25931 45 1166908.5
Flooring PCC 7131 45 320890.5
Other Finishing
Works 30938 60 1856262
First Floor
Brick Work 29791 120 3574884
R C C 29536 120 3544374
Door, Window etc 25931 45 1166908.5
Other Finishing
Works 30938 60 1856262
Second Floor
Brick Work 30140 120 3616746
R C C 29714 120 3565734
Door, Window etc 25931 45 1166908.5
Other Finishing
Works 30938 60 1856262
Toilet Door 31786 30 953580
Total Cost of the Project = 33717688.5Rs From the details of data collected from the organization, prepared project cost details and project schedule details which is shown in table 1 and table 2 respectively. It gives an idea of cost for individual activities and total cost for the construction of 120 flats. It also give an idea of time required for individual activities and total time required for the construction of 120 flats.
TABLE III PROJECT SCHEDULE DETAILS
Task Start
date
No of days
Finish date
Project 01-10-2013 546 30-03-2015
Pre-Construction 01-10-2013 30 30-10-2013
G. F 01-11-2013 210 29-05-2014
Earth Work
Excavation 01-11-2013 45 15-12-2013
DR Masonry 15-11-2013 120 14-03-2014
Earth Filling 01-03-2014 30 30-03-2014 Brick Work,
Lintel 01-01-2014 120 30-04-2014
R C C 1:1.5:3 15-01-2014 120 14-05-2014 Door, Window
Ventilator 01-02-2014 45 17-03-2014
Flooring PCC
1:4:8 10-03-2014 45 23-04-2014
Floor
Finishing 15-04-2014 45 29-05-2014
Other Finishing Works
15-04-2014 60 13-06-2014
F.F 01-05-2014 180 27-10-2014
Brick Work 01-05-2014 120 28-08-2014 R C C 1:1.5:3 15-05-2014 120 11-09-2014 Door Window
Ventilator 01-05-2014 45 14-06-2014
Floor
Finishing 15-08-2014 45 28-09-2014
Other Finishing Works
30-08-2014 60 28-10-2014
S.F 01-09-2014 170 17-02-2015
Brick Work 01-09-2014 120 29-12-2014 R C C 1:1.5:3 15-09-2014 120 12-01-2015 Door Window
Ventilator 15-09-2014 45 29-10-2014
Floor
Finishing 15-12-2014 45 28-01-2015
Other Finishing Works
30-12-2014 45 12-02-2015
Department of CIVIL, CSE, ECE, EEE, MECHNICAL Engg. and S&H of Muthayammal College of Engineering, Rasipuram, Tamilnadu, India
Copyright to IJIRSET www.ijirset.com 78
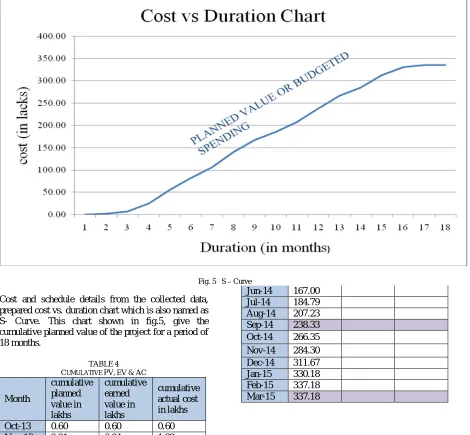
Fig. 5 S – Curve
Cost and schedule details from the collected data, prepared cost vs. duration chart which is also named as S- Curve. This chart shown in fig.5, give the cumulative planned value of the project for a period of 18 months.
TABLE 4 CUMULATIVE PV,EV&AC
Month
cumulative planned value in lakhs
cumulative earned value in lakhs
cumulative actual cost in lakhs
Oct-13 0.60 0.60 0.60
Nov-13 2.21 0.94 1.32
Dec-13 6.61 4.85 5.18
Jan-14 24.94 15.44 18.82
Feb-14 55.46 Mar-14 81.43 Apr-14 105.83 May-14 140.67
Jun-14 167.00 Jul-14 184.79 Aug-14 207.23 Sep-14 238.33 Oct-14 266.35 Nov-14 284.30 Dec-14 311.67 Jan-15 330.18 Feb-15 337.18 Mar-15 337.18
In table 4, cumulative Planned Value, cumulative Earned Value and cumulative Actual Cost of the project for a period of 4 month duration and budget at completion for the project of 18 month duration is tabulated from the collected data and the values given as:
Copyright to IJIRSET www.ijirset.com 79 3. Actual Cost (ACWP) : 18.82 lakhs
4. Budget at completion (BAC) : 337.18 lakhs
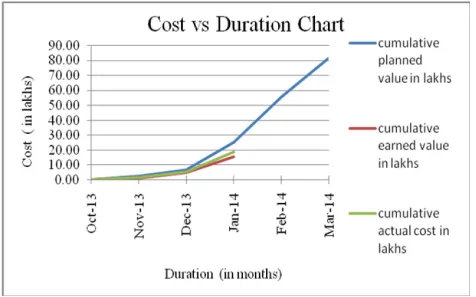
Fig. 6 shows the S- Curve for cumulative planned value, earned value and actual cost of the project for a period of 6 months. Here the total duration of the project is divided into 3 equal intervals of 6 months. This chart shows the first 6 month interval from OCT-13 to MAR-13 and it is found that, the EV line is below the PV or AC line, which means there are problems in those areas.
value line is below planned value line, which indicates that the work has not been accomplished as per the planned value. From the fig.6 it is also cleared that the earned value line is below the actual cost line, which indicates that the work has been going on a cost overrun manner.
Fig. 6 Cumulative Planned Value, Earned Value, and Actual Cost for the Project
Department of CIVIL, CSE, ECE, EEE, MECHNICAL Engg. and S&H of Muthayammal College of Engineering, Rasipuram, Tamilnadu, India
Copyright to IJIRSET www.ijirset.com 80
PROJECT PERFORMANCE INDICATORS
To calculate Formula value project management questions Interpretation
1. How Are We Doing Time-Wise? Schedule Analysis & Forecasting
Schedule Variance (SV) SV= EV-PV -9.5 Are we ahead or behind of schedule? Behind schedule Schedule Performance Index
(SPI) SPI= EV/PV 0.62 How efficiency are we using time? Behind schedule
Time Estimate At Completion (EACt)
(BAC / SPI)
(BAC/MONTHS) 29 When are we likely to finish work? not on schedule
2. How Are We Doing Cost-Wise? Cost Analysis & Forecasting
Cost Variance (CV) CV= EV-AC -3.38 Are we under or over our budget? over budget
Cost Performance Index
(CPI) CPI= EV/AC 0.82
How efficiency are we using
resources? over budget
Estimate At Completion
(EAC) EAC= BAC/CPI 411.20 What is the project likely to cost?
assumption: current performance trends
continue Variance At
Completion(VAC) VAC= BAC-EAC -74.02 What we are under or over budget? over budget
Estimate To Compete(ETC) (BAC-EV)/CPI 392.37 What will be the remaining work cost?
assumption: current performance trends
continue
VI. RESULT
Table 5 shows the calculation of various project performance indicators. It is clear that:
The project has an unfavourable schedule variance of 9.5 that means the project is behind schedule. A SPI of 0.62 would tell that the project is progressing at 62 % of the rate originally planned. SPI indicates the rate at which the project is progressing. The originally estimated completion time for the project was 18 months. Here we found that if work continuous at the current rate the project will take 11 months longer than what was originally planned; as time estimate for completion is now 29 months.
The project has an unfavourable cost variance of 3.38 that means the project is over budget. A CPI of 0.82 would tell that the project is currently running over budget by 18% that is for each rupee we spend, we are getting a value of rupee 0.82.
Estimate at completion shows that the expected total cost of a project at completion is based on the performance of the data date 337.18 lakhs divided by 0.82 is 411.20 lakhs, therefore EAC is
411.20 lakhs. In other words, since the project is getting only 0.82 rupee out of every rupee, the project will cost 411.20 lakhs instead of 337.18 lakhs that were planned.
Variance at completion shows the variance of the total cost of the work and expected cost. Here it is -74.02. That means at this status date the project is over budget by 74.02 lakhs. Estimate to complete shows the expected cost required for finishing all the remaining work, here it is 392.37. This amount is needed to complete the work.
VIICONCLUSION
As project managers, all are aware of Earned Value Management to help control costs. Using this concept to track a real time project is extremely useful and gives an instant feel about the performance of the project.
Copyright to IJIRSET www.ijirset.com 81 which show the relationship between duration and cost
of the project.
The expected outcome of the project will show the difference in scheduled performance and actual performance of the project for a particular period of observation. Based on the performance we can find out the reasons for variance of schedule and variance of cost, also we can predict the future of the project.
ACKNOWLEDGMENT
The project data used in this study was made available by COSTFORD-Thrissur, Kerala. We are very indebted to this organization for their contribution to this study.
REFERENCES
[1] Sager K. Bhosekar, Gayatri Vyas, “Cost Controlling Using Earned Value Analysis in Construction Industries,”
International Journal of Engineering and Innovative Technology, Volume 1, Issue 4, April 2012.
[2] Frank T Anbari, “Earned Value Project Management Method and Extensions,” Project Management Journal, Dec 2003.
[3] Daniel M. Brandon, “Implementing Earned Value Easily and Effectively,” Project Management Journal, June 1998. [4] Vanhoucke, Stephan Vandvorde, “Earned Value Forecast
Accuracy and Activity Criticality,” The Measurable News, Issue 3, 2008.
[5] Walt Lipke, “The to-Complete Performance Index …An Expanded View,” The Measurable News, Issue 2, 2009. [6] Walt Lipke, “Why Should Cpi = 1?,” The MeasurableNews,
Issue 2, 2011.
[7] Walt Lipke, “Project Duration Forecasting … A Comparison Of Earned Value Management Methods to Earned Schedule,” The Measurable News, Issue 2, 2009. [8] Subrahmanya K, Shiji S G, “ project performance