ABSTRACT
SEMINELLI, MICHAEL DAVID. Implementing Discrete Event Simulation to Improve Optometry Clinic Operations. (Under the direction of Dr. Thom Hodgson).
As the tempo of military operations slows and Soldiers experience more time at their home installations between overseas deployments, service agencies effectively have a larger population to support. Army Medical Facilities are faced with a need to improve the
efficiency and throughput of their clinics to provide timely service to this growing population all while maintaining or reducing the size of their staff. Optometry clinics provide both routine and acute care to Soldiers ensuring medical readiness and also treat Soldiers’ family members and retirees from the surrounding community. A discrete event simulation was used to examine six scheduling and staffing policies for the Womack Army Medical Center’s Optometry Clinic with a goal of increasing the daily throughput of the clinic with
consideration to patient waiting times.
The Womack Optometry Clinic serves six different patient types ranging from eye wellness exams to vision screening evaluations. All patients experience up to three basic processes in the clinic: an evaluation by an Optometry Technician, examination by an Optometrist, and if required an eye dilation exam. A discrete event simulation was
constructed to model optometry clinic processes using probability distributions, derived from observed and historical data, which represent the variation in service and arrival times at each of the clinic stations. The output metrics from the baseline simulation were validated against the actual clinic performance and served as a benchmark for testing the six scheduling policies.
Implementing Discrete Event Simulation to Improve Optometry Clinic Operations
by
Michael David Seminelli
A thesis submitted to the Graduate Faculty of North Carolina State University
in partial fulfillment of the requirements for the degree of
Master of Science
Operations Research
Raleigh, North Carolina 2015
APPROVED BY:
_______________________________ _______________________________
Dr. Thom Hodgson Dr. James Wilson
Committee Chair
BIOGRAPHY
Captain Michael David Seminelli graduated from the United States Military Academy in 2005 with a Bachelor of Science degree in Mechanical Engineering and was commissioned as a Second Lieutenant in the United States Army Armor Corps.
After completing the Maneuver Officer Basic Course and Scout Leaders Course, Michael was assigned to D Company, 1st Squadron, 11th Armored Cavalry Regiment at Fort Irwin, California. He served as a tank platoon leader and tank company executive officer and was responsible for training thousands of Soldiers in preparation for deployments to both Iraq and Afghanistan.
Michael was then assigned to the 6th Squadron, 4th Cavalry Regiment at Fort Hood, Texas where he deployed to the mountains of Eastern Afghanistan from 2008-2009. He served as an operations officer focusing on the planning of Squadron level combat missions throughout the 2000 square kilometer battle space.
Upon his redeployment, Michael attended the Engineers Captains Career Course and earned a Master of Science degree in Geological Engineering from Missouri University of Science and Technology in 2010. He was assigned to the XVIII Airborne Corps
Headquarters at Fort Bragg, North Carolina and deployed to Iraq in 2011 as part of the United States Forces Iraq - Current Operations section. He was involved in the transitioning of battle space to the Iraqi Army and the retrograde of United States forces from Iraq.
Michael returned to Fort Bragg and assumed command of B Company in the Warrior Transition Battalion for 17 months. His unit aided wounded, ill, and injured Soldiers during their recovery and facilitated their return to duty or a successful transition from the Army as veterans in the community.
ACKNOWLEDGEMENTS
To my wife, Heather, thank you for all of your continued love and support. You are a constant source of inspiration and joy as we continue on this journey together. Your passion and creativity motivates me to improve myself and push my boundaries. Thank you for being an amazing mother to our daughter and my greatest friend. I look forward to our move to the Hudson Valley and our eventual return to the Land of the Pines.
To Dr. Thom Hodgson, thank you for your patience, support, and mentorship. Your confidence enabled me to explore a research opportunity that improves the lives of the Soldiers and family members I served with on Fort Bragg. You and your wife Grace, welcomed us into the program and treated us like family, which we greatly appreciate.
To Dr. James Wilson, thank you for taking the time to teach me the fundamentals of discrete event simulation and tirelessly helping with the model formulation. Your expertise helped me develop intuitive and elegant solutions which accurately captured the performance of the system.
To Lt. Colonel Jose Capo-Aponte, thank you for welcoming me into your clinic and treating me like a member of your team. Your support and willingness improve your clinic is a true testament of your leadership. I truly enjoyed getting to work with you and your staff.
TABLE OF CONTENTS
LIST OF FIGURES ...v
LIST OF TABLES ... vi
CHAPTER 1: INTRODUCTION ...1
1.1 MOTIVATION & OBJECTIVES ...2
1.2 DESCRIPTION OF CLINIC PROCESSES ...4
CHAPTER 2: LITERATURE REVIEW ...9
CHAPTER 3: MODEL CONSTRUCTION AND DATA ANALYSIS...12
3.1 KEY ASSUMPTIONS...14
3.2 INPUT MODELING ...15
3.3 VERIFICATION...16
3.4 VALIDATION ...16
3.5 ARENA SIMULATION ...17
3.6 ANIMATION ...18
3.7 EXPERIMENTAL DESIGN ...19
CHAPTER 4: RESULTS ...23
4.1 PATIENT LENGTH OF STAY ...23
4.2 PATIENT WAIT TIME ...25
4.3 CLINICAL STAFF UTILIZATION...28
4.4 END OF DAY ANALYSIS ...32
4.5 TOTAL REVENUE IN RELATIVE VALUE UNITS ...35
CHAPTER 5: CONCLUSIONS ...38
CHAPTER 6: FUTURE RESEARCH ...42
REFERENCES ...43
APPENDICIES ...44
APPENDIX A: INPUT MODELING ...45
APPENDIX B: MODEL OUTPUT ...51
LIST OF FIGURES
Figure 1.1 Diagram of Womack Army Medical Center Optometry Clinic ... 5
Figure 1.2 Patient Movement through Clinic ... 6
Figure 3.1 Clinic Floorplan with Animation ... 19
Figure 3.2 Relative Value Unit Calculations ... 20
Figure 4.1 Average Length of Stay by Patient Type ... 24
Figure 4.2 Average Patient Wait Time ... 26
Figure 4.3 Staff Scheduled Utilization ... 29
Figure 4.4 Impact of the Number of Technicians on Patient Wait Times... 30
Figure 4.5 Average End of Day Times ... 32
Figure 4.6 Probability End of Day Occurs Before a Certain Time ... 34
Figure 4.7 Daily Average of Total Clinic Revenue in RVUs ... 35
Figure 4.8 Daily Revenue Compared to Scheduled Patient Wait Time ... 36
Figure 4.9 Daily Revenue Compared to Average End of Day Time ... 36
Figure 6.1 Stat::Fit Output for Loglogistic Fit of “Waiting for Eyes to Dilate” Data ... 46
Figure 6.2 Stat::Fit Goodness of Fit Report for Distribution in Figure A.1 ... 46
Figure 6.3 Tech Dilate Process Beta Distribution Calculations ... 49
Figure 6.4 Simulation of Patient Arrivals... 53
Figure 6.5 Simulation of Clinic Processes ... 54
Figure 6.6 Simulation of Patient Departure and Calculation of Performance Measures ... 55
Figure 6.7 Simulation to Determine the End of Day ... 55
LIST OF TABLES
Table 3.1 Validation of Model Parameters... 17
Table 3.2 Base Scenario Daily Number of Appointments... 20
Table 3.3 Base Scenario Appointment Times ... 20
Table 3.4 Appointment Breakdowns for Each Policy ... 22
Table 4.1 Average Length of Stay for Scheduled Patients (Minutes) ... 25
Table 4.2 Average Wait Time for Scheduled Patient (Minutes) ... 27
Table A.1 Distributions for Arrival Times ... 45
Table A.2 Service Process Distributions ... 45
Table A.3 Empirical Distribution Function for “Waiting for Eyes to Dilate” Process ... 47
Table A.4 Empirical Distribution Function for Dilation Exam ... 48
Table B.1 Patient Wait Time (Minutes) ... 51
Table B.2 Patient Length of Stay in System (Minutes) ... 51
Table B.3 Resource (Provider) Utilization (Percent) ... 51
Table B.4 Total Clinic Revenue ($)... 52
CHAPTER 1: INTRODUCTION
Fort Bragg was established as an artillery training camp in 1918 and included a small landing field for aircraft and balloons used in artillery spotting, postal delivery, and aerial terrain mapping [1]. Camp Bragg, as it was known at the time, received its first base medical facility in September 1918, a 500 bed capacity spread throughout 22 buildings. The camp grew in population from two thousand Soldiers in the 1930’s to over five thousand prior to World War II. Following the Korean War, the fourth generation hospital was built on Fort Bragg in 1955. It was named after Private First Class Bryant Womack, an Army medic and Mill Spring, North Carolina, native who served in the Korean War. Private First Class Womack was posthumously awarded the Congressional Medal of Honor for conspicuous gallantry above and beyond the call of duty following the ambush of his unit in Korea. He exposed himself to intense enemy fire to render aid to his fellow Soldiers, and although he suffered moral wounds, he continued administer critical care to his comrades [2].
Today, the Womack Army Medical Center (WAMC) is the largest medical center in the Army, residing in a one million square foot facility. The four thousand member staff provides quality, cost-effective inpatient and outpatient care to over 225 thousand
beneficiaries in the area; including 57 thousand active duty personnel. On average, each day Womack has 3,350 clinic encounters, 190 emergency room visits, nine babies are born, 23 surgeries are performed, and 6,580 prescriptions are filled. In addition to the hospital complex, WAMC has seven unit level primary care facilities under its command. Four facilities are found on the installation, one is located in the main hospital, and two clinics are in the community (Fayetteville and Hope Mills) [3].
The Womack Optometry Department is comprised of five clinics located throughout the installation. Four of the clinics are colocated at unit level primary care facilities and one is located in the main hospital to maximize accessibility of their services to beneficiaries. Although beneficiaries can receive care at any clinic, they typically go to the optometry clinic that is colocated with their primary care clinic.
In a recent change, the Army Medical Department now considers optometry services as primary care. Patients schedule routine eye exams on their own without the need for a primary care provider (Family Practice Doctor, Pediatrician, Physician’s Assistant) to submit a referral. This opened and streamlined access of the clinic’s services to the population of beneficiaries. Patients schedule optometry appointments by calling the WAMC appointment lines where a representative in a small call center books the appointment. Patients also have the opportunity to use a web-based appointment scheduling portal where they can select a time slot from the list of available appointments up to three weeks out. Due to challenges accessing the portal and awareness of the system, patients will typically choose to utilize the appointment line when booking an optometry appointment.
1.1MOTIVATION & OBJECTIVES
Based on the large patient population, improvements in policies at an optometry clinic can enhance the patient care and the patient satisfaction for the Fort Bragg community. As several Army training schools, to include the U.S. Army Ranger School, require soldiers receive eye screenings as a prerequisite to advanced training, the intrinsic motivation for implementing better policies to serve this important patient base is obvious.
have their eyes dilated during a follow-up appointment, the follow-up is part of the same patient encounter but the encounter RVUs increase to account for the “cost” of the dilation procedure.
A per RVU value is applied to the total RVU for each encounter to generate a “billable” value of the services that were provided. Members of the armed services receive health care insurance through the MHS so the “billable” value is a comparative estimate of the cost a civilian provider would charge for the same service. MHS uses these values in budget planning and assessing the utility of the hospitals under its charge. Additionally, within a hospital, clinics and individual providers’ RVUs are totaled and converted to equivalent values to assess productivity.
Under the standard operating guidelines for the Womack Optometry Department, each staff optometrist is directed to support a daily schedule of twelve wellness examinations and two follow-up examinations. The average RVU for all patient encounters in the
Womack Optometry clinic is 4.74 from June 2013 to May 2014. During this time period, the providers averaged 162 encounters per month. The generic RVU rate of $34.02 per RVU is applied to clinical services yielding an average equivalent value of $26,100 per provider per month.
An improvement of one additional eye wellness exam each day to the scheduling process of the Optometry Clinic would increase the number of monthly encounters by 20. Expanding this value by 4.74 RVU per encounter and $34.02 per RVU, yields a monthly equivalent value increase of $3,225 per provider. The addition of one appointment to the schedule has the potential for an eight percent increase in the provider’s assessed
productivity. A feasible solution which increases the number of patients served would also need to minimally impact the wait times experienced by patients in the clinic. This analysis will use increases to patient wait times as a metric to compare schedules and assess
1.2 DESCRIPTION OF CLINIC PROCESSES
The Womack Optometry Clinic is located on the second floor in the hospital’s “clinic mall” near the west entrance. The clinic has three full-time staff optometrists and an optometry resident focusing on fitting specialty hard contact lenses and treating acute care “walk-in” patients. In support of Womack’s mission as a teaching hospital, the clinic will occasionally support an optometry student (extern) who serves a three month rotation and trains under a licensed optometrist. The extern will see patients but have extended one hour appointments since their advisor is required to verify and approve all clinical findings and notes. The hospital Optometry Department Officer in Charge (OIC) has his office in the clinic but does not see patients. The clinic is also staffed with four optometry technicians (one military, three civilian) and a receptionist. One of the civilian technicians is assigned to fitting and processing eye glass orders but will occasionally see patients. The clinic employs one Medical Support Assistant (MSA) who mans the clinic reception desk and manages the clinic appointment schedule. The facility has eight exam rooms, three screening rooms, eye glass order lab, and two rooms with specialty imaging equipment.
Optometrists, under the supervision of the department OIC, submit their availability to the MSA four weeks in advance. The MSA builds the appointments in the digital
scheduling system and “publishes” the schedule so the appointments are available for to be filled three weeks in advance. The providers typically follow a constant schedule unless they will be unavailable due to planned leave or training commitments. Optometrists are directed to schedule twelve 30-minute eye wellness exams and two 15-minute follow-up
appointments each day. The optometry technicians do not have scheduled appointments and are not assigned to support specific providers. They screen patients as they arrive and internally manage the division of labor.
shortened lunch break. The reception desk stops receiving patients at 1530 and the clinic closes at 1600, or until the last patient departed. The providers typically spend time after the clinic closes to complete charting the day’s encounters. Providers are directed to complete the digital medical record entry (note) for each patient visit within 72 hours. The optometry clinic layout is depicted in Figure 1.1 below.
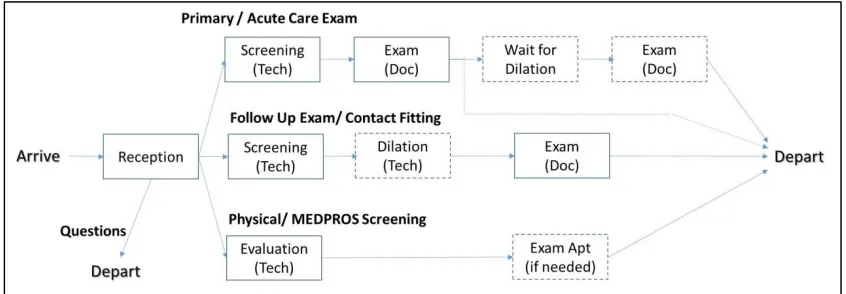
Patients arrive to the clinic and check in with the MSA at the reception counter, where their current medications are screened and staff is notified of the arrival. The clinic receives scheduled patients for routine eye wellness exams and for appointment follow-ups. They also treat patients with acute care issues on a walk-in basis. In the mornings, the clinic technicians provide medical readiness screenings for Soldiers to fulfill a requirement of their annual physical exam which is tracked through the Medical Protection System (MEDPROS). The MEDPROS system provides unit leaders with the medical readiness and deploy-ability status of the Soldiers under their command. Eye screening are also conducted in the
afternoon for Soldiers applying to attend physically demanding training or technical programs such as ranger school, flight school, or special forces assessment and selection. Additionally, the reception station receives a variety of visitors whose inquiries vary from
requesting copies of eye glass prescriptions and scheduling appointments to seeking directions to other clinics in the hospital. These visitors typically depart the clinic after speaking with the receptionist but their presence impacts the wait time of the scheduled and walk-in patients waiting to receive clinical services.
Following check in, patients sit in the entrance waiting area until an optometry technician escorts them to a screening room. Scheduled patients with wellness exam appointments are asked about their medical history and receive a standard battery of testing which includes the eye pressure (air puff) test. They are then directed to the interior waiting area until the doctor is ready to see them. Patients with follow-up exams will have their health history verified and then directed to the waiting area. If the follow-up is for an eye dilation exam, the optometry tech will apply the dilation drops and the patient will sit in the waiting area for the drops to take effect prior to seeing the provider. Figure 1.2 provides a flowchart of patient movement through the clinic.
The MEDPROS and Physical exam screenings are conducted by the optometry technician. Uncorrected and corrected vision is recorded, eye pressure tested, and some physical exams require tests for color blindness. If the technician identifies issues with the patients’ vision, they are directed to schedule an appointment for an exam with a provider,
otherwise, they depart the clinic. The physical exam and MEDPROS results are updated by the technician in the patient’s digital medical record.
The optometrist is notified by the technician that their scheduled patient (wellness exam and follow-up) has arrived and they review the results of the technician’s screening. The provider escorts the patient to their exam room, and for wellness exams, eye health is checked and prescriptions are verified and updated. If required and the patient has time, the optometrist will dilate the patient’s eyes and have them sit in the interior waiting area for the dilation to take effect. If the patient needs to order new eye glasses, they utilize this wait time to select frames and provide the lens ordering clerk with their contact information. When the patient’s eyes are fully dilated, the optometrist escorts them back to the exam room and conducts an examination of the interior of the eyes. Upon conclusion of the exam, patients are escorted out of the clinic.
Patients with a follow-up exam are evaluated by the optometrist focusing on the specific reason for the appointment. Patients who had their eyes dilated undergo the examination of the eye interior then depart the clinic. Patients returning for a contact lens fitting will be evaluated for a lens that fits properly by the provider. They will then spend time with a technician learning how to apply, remove, and clean the contact lenses before their visit is concluded.
The optometry clinic treats patients with acute care eye issues on a walk-in basis (no scheduled appointment) during regular business hours (0730-1530). Patients with eye complications when the clinic is closed are treated by the Emergency Department in
conjunction with the on call ophthalmologist. One staff optometrist assumes the duties of the walk-in provider each day following a rotating schedule. Currently, the optometry resident sees walk-in patients two days a week and the other providers cover the remaining three days. The walk-in provider has a reduced number of scheduled patients, seven per day, in order to allow time to treat the walk-in patients.
CHAPTER 2: LITERATURE REVIEW
As healthcare facilities strive to provide timely patient care, they turn to the scheduling and optimization techniques employed by Industrial and Systems engineers and Operations Research professionals. When faced with large and complex healthcare systems, engineers will enlist the aid of simulation to conduct analysis and test proposed changes. A discrete event simulation is a representative model that incorporates variability and uncertainty into the system processes. The simulation views the facility as a dynamic system where discrete events such as patient arrival, treatment time, and laboratory processing times are
measurable, finite, and occur in a prescribed sequence [4]. This flow is similar to jobs moving through a manufacturing facility where a job routed to a process station cannot be worked on until the preceding job has completed the process at the station.
A discrete event simulation uses defined probability distributions such as exponential or beta to account for the variation in the processing time a patient experiences at each station in the clinic [4]. The probability distributions are determined through a combination of direct observation of patient flow, clinic records, and staff input on averages processing times. Statistical analysis determines which specific distribution best represents the process; accuracy increase directly with the number of quality observations. Often, researchers will have a limited dataset and will select distributions based on “goodness of fit” indicators, based on statistical comparisons to the sample data, such as the Chi Square test and the Kolmogorov-Smirnov test. Selected distributions as evaluated in the simulation and results are compared to actual clinic performance in order to validate distributions and the overall model.
Healthcare facilities also have well-defined locations for reception, patient waiting, screening, and treatment to occur which is directly adaptable to the model construction. An advantage to using a validated baseline discrete event model is the ease in which parameters can be modified to test different staffing or scheduling policies and rapidly assess the impact to system’s performance. The use of discrete event models to assess the impacts of
physiotherapy clinic. The stochastic and non-linear construct of the discrete event model enabled researchers to identify a decrease in clinic efficiency despite an increase in the total number of providers due to competition over limited resources [4].
A discrete event simulation can be formulated to contain diverse entity types who will use a range of different services and then analyze their movement through a complex network of processes. This technique of modeling different entity types can be easily applied to patients who arrive to a clinic which provides a diverse range of services; as is the case in larger healthcare facilities. A model will route the patient entities through the appropriate sequence of process stations (where some may serve multiple patient types, such as the reception station) and report the desired performance statistics for each patient entity type. In a study of a mammography clinic, this method was utilized in a simulation model which tracked the travel times of both patients and their radiological films throughout the clinic system. The patients and films only shared a couple of common processes before traveling in different directions through the system. The simulation was ultimately able to identify
optimal resource-provider ratios to minimize patient wait times [5].
In studies of emergency departments (ED), researchers frequently employ discrete event simulation to analyze the system. The dynamic environment of an ED and requirement to rapidly provide for lifesaving care showcases the advantages of utilizing simulation to test system processes and performance against various scenarios, including mass casualty events such as multi-car accidents. While most healthcare simulations focus on patient wait time and length of stay in the facility, Abo-Hamad’s study of an ED in North Dublin included analysis of additional key performance indicators such as provider utilization and
productivity [6]. The addition of these performance indicators highlights impacts on the clinical staff and administration; expanding the simulation formulation from a purely patient focused approach.
improvement to the overall performance of the system and not be worth the expense. In Ahmed’s study of an ED, a discrete event simulation determined the optimal staffing ratios (doctors, nurses, lab technicians) which maximized patient throughput while reducing wait times [7]. The new policy achieved a 28% increase in throughput and 40% reduction in wait times while working with existing resources. Results and analysis from discrete event simulations provide clinic leadership with vital insight useful in their decision analysis process.
In this thesis, the discrete event simulation of the optometry clinic will implement a mixture of entity types which arrive to the clinic based on determined probability
distributions or specific schedules. A unique aspect of this study is the blending of both scheduled and stochastic patient arrivals seeking appointments with the walk-in optometrist resource. The clinic leadership is faced with the challenge of ensuring they have an
CHAPTER 3: MODEL CONSTRUCTION AND DATA ANALYSIS
The model of the Womack Optometry clinic was built using Rockwell Automation Technologies’ Arena Simulation software, version 14.7. Arena was selected based on the software’s dynamic and robust capabilities in developing complex discrete event simulations which incorporate animations of the system. A logical, source code, model was built to generate key performance parameters which are used in statistical analysis of the system and an animation model was developed to provide a visual representation of operations in the Womack Optometry clinic.
The Arena simulation model uses six entity types to represent the flow of various patient types who enter into the clinic. Entities for patients who have a scheduled
appointment (wellness exam or follow-up exam) are generated based on the planned appointment slots for their specific provider. The entities are then assigned an attribute containing the name of their specific provider; Doctor A, B, C, or Walk-in Doctor. This attribute will be used later in the simulation to ensure each patient receives care from their scheduled optometrist. The appointment-based arrivals are detailed in Section 3.7,
Experimental Design.
Walk-in patients arrive to the clinic based on an exponentially distributed arrival rate with an average inter-arrival time between patients of 95.5 minutes. The schedule allows patients to arrive during the first four hours of the simulation from 0730 to 1130 and for two and a half hours in the afternoon between 1230 and 1500. The simulation does not generate arrivals during the staff lunch hour between 1130 and 1230 since they would not be able to enter the clinic. In reality, walk-in patients with serious or emergency symptoms would receive immediate care from the walk-in provider but this would typically occur in the Emergency Department or in conjunction with Ophthalmology providers. Walk-in patients with non-emergent ailments will return to the clinic following the lunch time closure to see the on call provider.
average inter-arrival time between patients of 89.6 minutes. In the afternoon, the clinic services patients requiring vision screening for their annual health assessment and medical readiness. Arrivals are also exponentially distributed but the mean inter-arrival time between patients is 95.4 minutes. Both of these entities are serviced by available optometry
technicians and will not receive an attribute assigning them to a provider. People with questions for the receptionist arrive to the clinic on average, every 16 minutes which follows an exponential distribution. These patients are serviced by the receptionist then depart the model.
The Optometry clinic employs three types of staff members who are simulated as resources in the model. The MSA serves as the clinic’s receptionist, charting when scheduled patients arrive, answering phone calls, and notifying the staff when walk-in patients arrive. The MSA also builds the weekly schedule of available appointments four weeks in the future based on projected provider availability. This task does not involve patient interaction and is prioritized lower than servicing patients and will therefore not be studied in this model. However, this task should be considered when analyzing resource utilization for the receptionist.
Optometry technicians assist optometrists by screening patients prior to exams and conducting routine tests such as eye pressure measurements. Technicians also conduct routine vision assessments for physical exams, administer dilation drops, and conduct instruction on the use and care of contact lenses. The clinic employs three technicians who, when idle, are able to service any patient after they have been checked in by the receptionist, giving priority to those with scheduled appointments.
as a single resource. Patients with a scheduled appointment will call upon their assigned doctor for wellness exams; follow-up visits, and dilation exams. If a doctor administers dilation drops to a patient, while the drops take effect, he will see the next patient if they have arrived. The provider will prioritize evaluating a patient who is ready for a dilation exam over one who just arrived.
3.1KEY ASSUMPTIONS
In the development of this model several key assumptions were made which enabled me to construct a simulation to model the performance of this real world system. The number of optometrists in the Optometry clinic has varied based on provider re-assignments to other military installations, residents and interns rotating through for training, and the temporary re-allocation of staff while a medical facility is renovated. This model assumes the clinic has four full-time staff optometrists, one of whom is on call to treat walk-in acute care patients. The specific providers have certain days each week where they provide specialty treatment for patients recovering from traumatic brain injuries (concussion care) or patients with diabetes. These specialty appointments are scheduled for 45 minutes and the patients typically receive additional testing and evaluations. The model, which simulates the average work day, assumes all scheduled patients only receive the standard eye wellness examination which is scheduled for 30 minutes.
The model focuses on the performance of the clinic system and therefore assumes every scheduled appointment is filled by the patient. Allowing for patient cancellations will only reduce the load on the system and will not aid in our analysis. Patients are instructed by the hospital to arrive at least ten minutes prior to their scheduled appointment time. A patient who arrives to the reception queue significantly after their appointment time will be
considered a missed appointment and rescheduled for a later date. Allowing for variance in arrivals, it is assumed patients will arrive no earlier than 18 minutes prior to their
appointment and no later than five minutes after their scheduled appointment time. Patient movements through the clinic stations are assumed to take two minutes regardless of
order glasses. This process is conducted while the patient is waiting for the dilation drops to take effect and therefore assumed to have no impact to the patient flow. Lastly, a “baseline” scenario where each staff optometrist is scheduled to see 12 wellness exam patients and two follow-up patients each day is assumed to create the model. The walk-in provider will be scheduled to see seven wellness exam patients and no follow-ups each day.
3.2INPUT MODELING
Model input values for patient arrivals and processes throughout the clinic were primarily based on data collected through direct observation of patient movement through the
Optometry clinic. Service times for the clinical processes were recorded as patients departed the station. Patient wait times were also recorded at each of the queue locations for use in validating the simulation model. Inspection of digital medical records provided insight into the number of acute care (walk-in) patients; school physical and medical readiness screenings conducted, and even the probability of follow-up patients who receive dilation exams.
Interviews with the clinic staff provided generalized parameters for processes that occurred less frequently or were unobserved, such as school physical exam screenings and technician dilation. Stat::Fit and Arena’s Input Analyzer fit probability distributions to the collected data for use in developing the service and arrival rates.
Using a combination of Stat::Fit and Arena’s Input Analyzer, distributions were fit seeking to both visually match the empirical histogram as well as pass the goodness-of-fit tests. When there were too few data points to get a fit, nothing was assumed about the distribution except information obtained from the on-site data collection and a uniform distribution was constructed with realistic bounds. Important highlights regarding input distributions and choices are covered in Appendix A, Input Modeling. Additional
3.3VERIFICATION
The model simulates one work day for the clinic from 0730 to 1600 or until the last patient departs. Assuming 20 work days a month, the model was replicated for 60 iterations to simulate clinic averages over a three month period. A dashboard comprised of variables in the model reports on key entity and key resource values as the model is evaluated. The output from the dashboard verifies that no entities arrive into the system during the scheduled lunch hour or after 1530. The simulation also continues running until all patients are
processed through the clinic; entities in is equal to entities out.
3.4VALIDATION
The Arena overview report contains model performance statistics across all simulated replications. The parameters measured in the “baseline” scenario are compared to the data collected in the real world system in order to validate the output of the model. Further analysis will be conducted by instituting changes to the baseline model whose results are inferred to be valid in practice.
Table 3.1 Validation of Model Parameters
Parameter Model Output Value Observed Value
End of Day [Expected, Minimum] (time) 1623, 1550 1630, 1600 Total Number of Scheduled Patients 43 Wellness,
6 Follow-up 43 Wellness, 6 Follow-up Wait Time in Receptionist Queue (min) 0.246 ± 0.06* 0.54
Waiting Time for Exam (min) 10.8 ± 1.2* 9.8
Number of Walk-in Patients 4.083 ± 0.49* 4.085
* 95% confidence interval for expected value
3.5ARENA SIMULATION
The optometry clinic was simulated using the Arena software package by Rockwell Automation. The model uses a system of different control modules which generate entities (patients), move them to various processes (clinic procedures) which use available resources (clinic staff), before disposing of them (patient departs the clinic). The simulation starts by reading the schedule for wellness and follow-up exam patients from a text file which contains the appointment times and the corresponding doctor. This process enables one base
simulation to easily test different appointment scheduling policies without modification to the model construct. Entities for all scheduled patients are created at simulation time zero and assigned their appointment time and provider. The scheduled patients are all held in a Delay module until their appointment time, upon which they are released to enter the rest of the simulation. Since patients are instructed to arrive ten minutes early, a uniform distribution is used to vary patient arrivals between 15 minutes prior to their appointment and up to five minutes after. Arrivals greater than five minutes late are coded as a “no show” for their appointment and rescheduled for later date. The other patient entity types generated using the distributions discussed in Section 3.2, Input Modeling.
simulation to record data on the time spent in the system for further analysis. Arena analyzes the average values of recorded data from each of the simulated daily iterations (each run simulates a full clinic day). In order to conduct further statistical analysis, the time when the clinic closes (End of Day time) is exported to a text file for each iteration. Arena’s output report containing average performance measures as well as confidence intervals, can be view in the program or exported as a PDF file for use in future analysis.
3.6ANIMATION
The model is animated to graphically illustrate the flow of patients through the clinic utilizing the clinic floorplan diagram. This comes with a few problems as the actual physical layout has some shared waiting space and our model has those waiting spaces modeled as separate spaces. Although an extra waiting area appears in the model, experimental results indicate that the maximum number waiting in these spaces does not exceed the capacity of the unified waiting space at the physical clinic.
Figure 3.1 below provides an overview of the clinic floorplan as well as the animation. Using stations, the entity flow to various parts of the clinic is separated. All staff
Figure 3.1 Clinic Floorplan with Animation
3.7EXPERIMENTAL DESIGN
After multiple small-run pilot simulations, simulating each day 60 times (each replication simulates one normal workday at the clinic) provides an estimate of the average clinic
performance roughly over a quarter (three months). As mentioned previously, the experimental designs for this thesis, is to consider alternative appointment scheduling schemes to increase the total RVU of the clinic while minimizing increases to patient wait times.
The base scenario, referred to previously in Section 3.4, Validation, has one receptionist and three technicians working with the discussed work schedule. There are a total of four doctors, with one designated to take walk-in patients in addition to seven scheduled
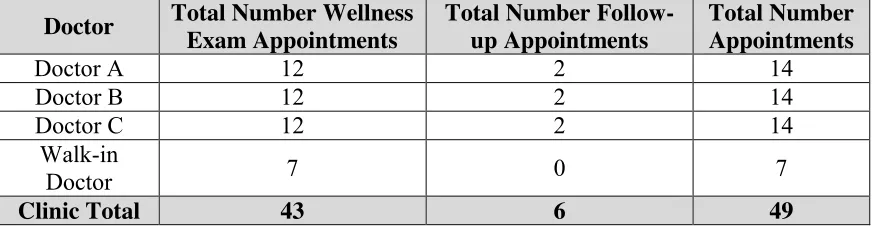
Table 3.2 Base Scenario Daily Number of Appointments
Doctor Total Number Wellness Exam Appointments
Total Number Follow-up Appointments
Total Number Appointments
Doctor A 12 2 14
Doctor B 12 2 14
Doctor C 12 2 14
Walk-in
Doctor 7 0 7
Clinic Total 43 6 49
Table 3.3 Base Scenario Appointment Times
Appointment Type Appointment Times
Follow-up 0730, 1300
Wellness Exam (all 3 doctors) 0745, 0815, 0845, 0915, 0945, 1015, 1045, 1115 1315, 1345, 1415, 1445 Exams assigned to Walk-in Doctor 0800, 0900, 1000, 1100, 1300, 1400, 1500
An estimate of the total clinic revenue earnings is based on the formulas outlined below. The number of encounters is totaled during the simulation and provided in the output report. Based on clinic records, the average RVU per encounter is 4.74; multiplying the number of encounters by this average RVU per encounters provides an estimated average RVU per time unit. These values are then used to determine the average total clinic revenue per time period. # 𝐸𝑛𝑐𝑜𝑢𝑛𝑡𝑒𝑟𝑠 = # 𝑆𝑐ℎ𝑒𝑑𝑢𝑙𝑒𝑑 𝑃𝑎𝑡𝑖𝑒𝑛𝑡𝑠 + # 𝑊𝑎𝑙𝑘-𝑖𝑛 𝑃𝑎𝑡𝑖𝑒𝑛𝑡𝑠 𝑇𝑜𝑡𝑎𝑙 𝐶𝑙𝑖𝑛𝑖𝑐 𝑅𝑒𝑣𝑒𝑛𝑢𝑒 = 𝑅𝑒𝑣𝑒𝑛𝑢𝑒 𝑅𝑉𝑈 × 𝐴𝑣𝑔 𝑅𝑉𝑈 𝐸𝑛𝑐𝑜𝑢𝑛𝑡𝑒𝑟× # 𝐸𝑛𝑐𝑜𝑢𝑛𝑡𝑒𝑟𝑠 𝑡𝑖𝑚𝑒 𝑢𝑛𝑖𝑡 𝑅𝑒𝑣𝑒𝑛𝑢𝑒
𝑅𝑉𝑈 = $34.02
𝐴𝑣𝑔 𝑅𝑉𝑈
𝐸𝑛𝑐𝑜𝑢𝑛𝑡𝑒𝑟 = 4.74
In the experimental design, separate alternative patient schedules were created to evaluate against the current (base) clinic policy. Policy A is the same as the base model except that for one of the three dedicated wellness exam doctors (Doctor C) all their appointments are scheduled 15 minutes offset from the other two doctors; the adjusted wellness appointment times are (0800, 0830, 0900, 0930, 1000, 1030, 1100, 1130, 1330, 1400, 1430, 1500) with the associated two follow-up appointments adjusted to 0745 and 1315. This policy tests the system to see if any efficiency can be gained through scheduling manipulation by offsetting some of the patient arrivals. Policy B is also similar to the base schedule, accept the walk-in provider is scheduled to see two additional scheduled patients; increasing his patient load to nine. The new appointment schedule for the walk-in provider’s scheduled wellness exam patients are (0800, 0900, 0930, 1000, 1100, 1300, 1330, 1400, 1500); which increases the total number of appoints in the clinic to 51.
Policies C and D modify the base schedule to create one hour where wellness patients are scheduled to arrive twenty minutes apart; generating a thirteenth appointment for each of the staff doctors and 52 for the clinic. The new wellness exam patient appointment times are (0745, 0805, 0825, 0845, 0915, 0945, 1015, 1045, 1115, 1315, 1345, 1415, 1445), with no change to the follow-up exam appointment times. The hour of twenty minute appointments is placed in the beginning of the day to allow the system to work through any patient
Table 3.4 Appointment Breakdowns for Each Policy
Lastly, Policies E and F modify the base schedule to create two hours where wellness patients are scheduled to arrive 20 minutes apart, generating fourteen appointments for each of the staff doctors and 55 for the clinic. The new wellness exam patient appointment times are (0745, 0805, 0825, 0845, 0915, 0945, 1015, 1045, 1115, 1315, 1335, 1355, 1415, 1445), with no change to the follow-up exam appointment times. One hour of twenty minute appointments is placed in the beginning of the day and the other hour immediately follows the lunch break; to allow the system to work through any patient congestion created. Policy F uses the fourteen patient schedules developed in Policy E and adds two additional
scheduled appointments for the walk-in provider; as was done in Policy B. The new
appointment schedules for the walk-in provider’s scheduled wellness exam patients are again (0800, 0900, 0930, 1000, 1100, 1300, 1330, 1400, 1500), increasing the total scheduled patients in the clinic to 57.
Total Appointments
Total Scheduled Patients
Scheduled Pts/ Staff Doctor
Scheduled Pts / Walk-In Doctor
Follow-up/ Staff Doctor
Base 49 43 12 7 2
Policy A 49 43 12 7 2
Policy B 51 45 12 9 2
Policy C 52 46 13 7 2
Policy D 54 48 13 9 2
Policy E 55 49 14 7 2
CHAPTER 4: RESULTS
The goal of this project was to increase the number of patient encounters while
minimizing the increase to the total time a patient spends in the system. The optometry clinic leadership and staff had several suggestions but were constrained by physical infrastructure capacity and personnel authorizations. The clinic leadership was also considering hiring additional administrative staff to ease the perceived work load. Each scheduling policy was converted into simulation time and written into an individual text file. Using the validated baseline model as a benchmark for comparison, the next step was to test policies A-F to analyze the simulation results to determine the best policy.
Policies A and B both employ the clinic standard of 12 scheduled eye wellness exam appointments for each staff optometrist. As discussed above, Policy A offsets patient arrival times for one staff optometrist by 15 minutes and Policy B adds two additional wellness exam appointments to the walk-in optometrist’s schedule. Policies C and D provide each staff optometrist with a thirteenth wellness exam appointment by scheduling three 20-minute appointment arrival times at the beginning of the day. Similar to C and D, Policies E and F achieve 14 exam appointments by adding a second hour of three 20-minute appointments to the afternoon schedule. Two additional appointments are also added to the walk-in provider in Policies D and F.
4.1PATIENT LENGTH OF STAY
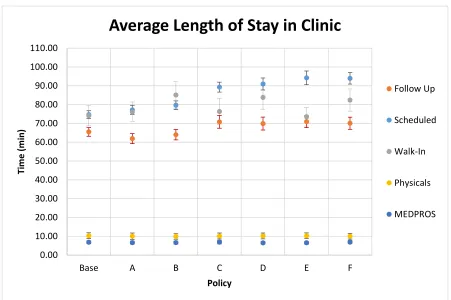
The total time a patient spends in the clinic (length of stay) is calculated from the difference in the time the entity arrives to the reception station queue and when they depart the clinic. The simulation determined the average length of stay for each patient type under each policy and is depicted in Figure 4.1 below. Patients arriving to receive a vision
half width of the baseline average for both patient types and therefore not statistically different from the base model.
The length of stay for scheduled patients in the baseline scenario is 74.69 minutes ± 2.08 minutes. The average times for the other two 12 wellness appointment policies (A and B) fall within the same confidence interval as the baseline results. This suggests that an offset to one of the provider’s schedules or an increase of two additional scheduled patients has no impact to a patient’s average length of stay. This is a positive result for Policy B, since the clinic can serve two more scheduled eye wellness exam patients each day with no impact to the total time a patient is in the clinic. The results depicted in Figure 4.1 are also summarized numerically in Table 4.1.
Figure 4.1 Average Length of Stay by Patient Type 0.00 10.00 20.00 30.00 40.00 50.00 60.00 70.00 80.00 90.00 100.00 110.00
Base A B C D E F
Ti m e ( m in ) Policy
Average Length of Stay in Clinic
Follow Up
Scheduled
Walk-In
Physicals
Table 4.1 Average Length of Stay for Scheduled Patients (Minutes)
Policy Mean Half Width % Increase from Base
Baseline 74.69 2.08 --
Policy A
77.19 2.4 3%
Policy B 79.65 2.32 7%
Policy C 89.30 2.65 20%
Policy D 90.97 3.17 22%
Policy E
94.22 3.65 26%
Policy F 93.98 3.08 26%
The average length of stay values for Policies C, D, E, and F are not statistically different from each other but the four policies are all statistically different from the base model. Implementing these policies and increasing the number of wellness appointments for the staff optometrists yields 20 to 26 percent increases in average length of stay (see Table 4.1 above). If the clinic was to increase the number of scheduled appointments Policy F should be
implemented as there is no difference to a patient’s total time in the system whether the clinic serves 46 scheduled patients under Policy C or 51 patients under Policy F.
4.2PATIENT WAIT TIME
As depicted in Figure 4.2, the average wait times for walk-in patients are similar across all policies except in Policy D. The average wait time for Policy D is statistically different from the base model average with 95% confidence. Although not statistically different, the average wait time of walk-in patients for all policies is larger than the baseline model. In Policies B and F, where the walk-in provider has two additional scheduled appointments, the walk-in patients experience increases in average wait time but the confidence intervals overlap the confidence interval for the baseline average. These results provide support for implementing policies which add additional scheduled appointments to the walk-in
optometrist.
Scheduled patients do not experience increases in average wait times in Policies A and B. This result again supports increasing the walk-in provider’s scheduled patient load by the implementation of Policy B. The simulation results for Policies C through F show a significant increase in average wait time for scheduled patients. Scheduled patients under Policies C and D experienced a 13-15 minute increase in wait times from the baseline
Figure 4.2 Average Patient Wait Time 0.00 5.00 10.00 15.00 20.00 25.00 30.00 35.00 40.00 45.00
Base A B C D E F
Wai t Ti m e ( m in ) Policy
Average Patient Wait Time
Follow Up
Scheduled
Walk-Ins
Physicals
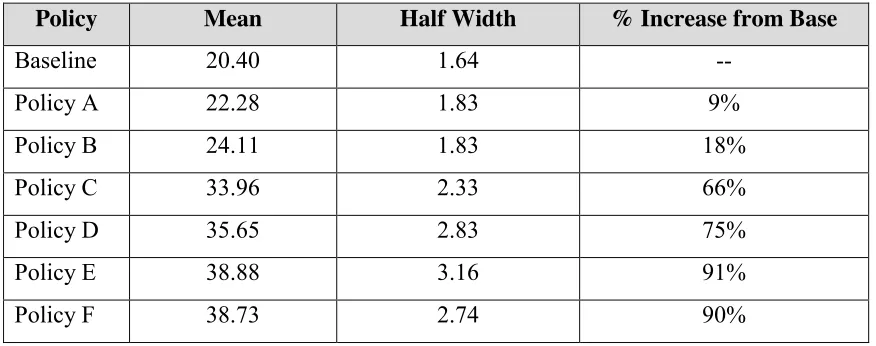
scenario and an 18-minute increase with Policies E and F, nearly double the base case. This increase makes intuitive sense as the clinic has patients arriving faster than a doctor can service them at the beginning of the day. As the day progresses and inter-arrival times are longer than service times, patients will experience shorter wait times. Since there is no impact to wait times for the MEDPROS and physical screening patients, scheduled patients experience most of their time in queues waiting for the optometrist. This time is split between waiting for the initial exam and then waiting for the optometrist to perform the dilation exam. The clinic can help mitigate the impact on wait times by scheduling patients who do not need dilation exams during the 20-minute appointment slots, eliminating one cause of delays. The results depicted in Figure 4.2 are also summarized numerically in Table 4.2.
Table 4.2 Average Wait Time for Scheduled Patient (Minutes)
Policy Mean Half Width % Increase from Base
Baseline 20.40 1.64 --
Policy A 22.28 1.83 9%
Policy B 24.11 1.83 18%
Policy C 33.96 2.33 66%
Policy D 35.65 2.83 75%
Policy E 38.88 3.16 91%
Policy F 38.73 2.74 90%
As discussed in Section 4.1, the largest average patient length of stay time was only 26% increase over the baseline model. Table 4.1 lists the average length of stay for Policy F as 93.98 minutes, which is 19.3 minutes larger than the baseline length of stay of 74.69 minutes. The difference in scheduled patient wait times between Policy F and the base model can be found in Table 4.2, which is 18.3 minutes. Therefore, if the clinic implements a policy to increase the number of scheduled patients, which causes the average wait time to double, the average total time a patient spends in the clinic will only increase by 26%. This direct
relationship between wait time and length of stay provides clinic leadership with a
framework to assess the risks and rewards of employing a scheduling policy to increase the number of patients served each day.
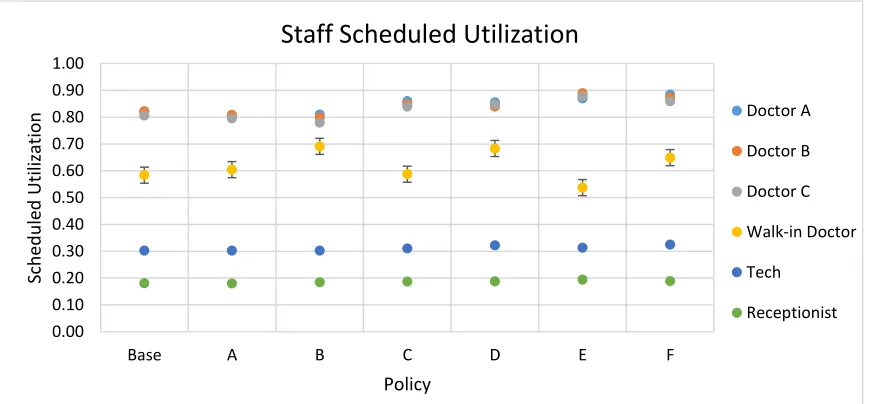
4.3CLINICAL STAFF UTILIZATION
Discrete event simulations provider researchers with data that is often too difficult and manpower intensive to collect from the actual system. Scheduled utilization is the ratio of the total time a resource is in service with entities to the total time the resource is scheduled to be available, reported as a percentage. In the optometry clinic simulation, scheduled utilization corresponds to the total time a staff member is serving a patient compared to the total time the staff member is scheduled to be at work.
The simulation is able to record only the time a staff member spends with a patient or busy with specifically assigned “work” such as completing charts. Calculating these values in the field is a challenging task as staff members tend to incorrectly estimate the time they busy with patients. The data would also be subjected to bias as time spend doing non-patient specific work would likely be counted. Although the staff is legitimately working, the schedule utilization informs the clinic leadership of how much “discretionary time” (time not with patients) his staff has so he can better assign additional duties to them.
As depicted in Figure 4.3, the simulation reports that the scheduled utilization of the reception station is 18% ± 1% for every policy tested. The increase of eight patients
requiring appointment check in under Policy F, had no impact to the utilization. The model does not include time spend fielding phone calls, as the data was unavailable; however, analysis of the base model with the arrival rate of random questions doubled (from 3.75 entities per hour to 7.5 entities per hour) yielded reception utilizations of 23% ± 1%. Despite this 5% increase over the observed rate, the model indicates the MSA has the capacity to be assigned a significantly higher workload.
The MSA is also tasked with creating the clinic’s appointment schedule four to five weeks into the future. The model, as stated above, only accounts for time the receptionist is serving patients and therefore has 80% of available time each day to work on the schedule. Based on how long it takes to create the appointment schedule, it may be viable for the receptionist to also book appointments without having to hire a second MSA.
Figure 4.3 Staff Scheduled Utilization
0.00 0.10 0.20 0.30 0.40 0.50 0.60 0.70 0.80 0.90 1.00
Base A B C D E F
Sched u le d U ti liza ti o n Policy
Staff Scheduled Utilization
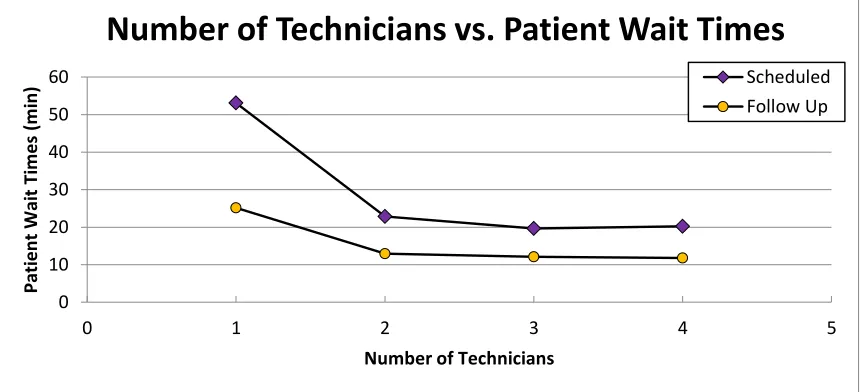
Optometry technicians also maintain a consistent utilization, 30% ± 1%, across all of the scheduling policies. The data shows that regardless of the increase in scheduled patients tested, each of the three technicians spend less than one-third of their day serving patients. Based on these results, further analysis was conducted on the impact of reducing the number of technicians. The base model was simulated with one, two, three, and four technicians yielding scheduled utilizations of 83%, 44%, 30%, and 22% respectively. The graph in Figure 4.4 shows the impact of the number of available technicians on patient wait times for both scheduled and follow-up patients. The waits times for both patient types are similar regardless of having two, three, or four technicians working.
The simulation output identifies a reduction in staffing to only two technicians has no impact on the clinic performance metrics. A broader interpretation of the results suggests that the clinic should strive to maintain an optometrist to technician ratio of two to one. This ratio will aid the OIC when faced with increases or decreases to his staff of optometrists, allowing him the confidence to re-assign technicians to among the clinics without sacrificing the performance. The available capability of the technicians also makes them a candidate for the task of building the appointment schedule, freeing up the receptionist to book appointments.
Figure 4.4 Impact of the Number of Technicians on Patient Wait Times 0 10 20 30 40 50 60
0 1 2 3 4 5
Pati e n t Wai t Ti m e s (m in )
Number of Technicians
The staff optometrists have the largest utilization rates among the clinic staff. This is expected as patients spend the most of their visit time with the optometrists and appointments are scheduled all day long. In the base model and for Policies A and B, the staff optometrists have an average scheduled utilization of 81%. By design, the simulation includes all of the time providers spend with patients when calculating utilization, as well as the stochastic time they spend charting and preparing in between patient visits. The staff optometrists experience a slight increase (4-7%) in the average utilization rate when the clinic is simulated under Policies C-F. These results are expected as since the providers are seeing more patients each day. Although these rates are statistically different from the baseline rate, the increase is similar whether the staff optometrists see three additional patients or six, supporting the implementation of Policy F.
The walk-in optometrist has a scheduled utilization rate which is 23% less than the staff optometrists in the base model. It is expected that the walk-in provider will have a lower utilization rate since he has half as many scheduled appointments as the staff optometrists. A 58% utilization suggests that the walk-in provider is spending just over half of the day with patients and there aren’t enough walk-in patients to maximize his time. The simulation generates an average of four walk-in patients each day, regardless of the scheduling policy, with values ranging from zero to ten patients. Although the walk-in optometrist may have to evaluate as many as ten walk-in patients in one day, totaling 17 patients, these days are statistically rare, occurring less than two percent of the time.
4.4END OF DAY ANALYSIS
A major consideration for implementing any scheduling policy was the impact on when the clinic would close for the day. While not a major concern for the military personnel, the civilian staff is constrained by an eight hour work day and the clinic OIC is unable to authorize overtime hours. Although the military staff will work until the mission is
complete, leadership that provides predictability regarding soldiers’ work schedules builds both unit morale and family relations. The clinic is currently open at 0730 and the civilian staff departs by 1630, with the last scheduled patient arriving at 1500. Under the current schedule the staff has 90 minutes to evaluate these patients, and any others still in the clinic, before the end of the work day.
In order to gain fidelity regarding the impact of each policy tested, an “End of Day” analysis was conducted on the model results. The simulation reports the End of Day (EOD) as the time when the last patient departs the clinic; and has no bearing on when staff depart. This measure accounts for the external influences requiring the clinic staff to remain at work. Under the baseline model, the average end of day time was 1623 ± 6 minutes; which matched the observed values. Policies A and B yielded EOD results which were similar to the base model; and most importantly, close to the 16:30 EOD time for the civilian staff. This result also supports the implementation of Policy B, which increases the clinic throughput without causing the clinic staff to work overtime.
16:23 16:30
16:44 16:42 16:49
17:00 17:02
16:00 17:00 18:00
Base A B C D E F
Ti m e ( 24 H r) Policy
Mean End of Day Time
As illustrated in Figure 4.5, the EOD times for Policies D-F are statistically different from the base model and occur after 1630; however, all of the times are before 1702. Under Policy F, although the number of patients served each day is increased by eight, the average time a patient departs is only half an hour later than what is currently in practice. The currently labor constraints require the civilian staff to depart by 1630, however, the patients remaining in the clinic after that time would have already been checked in, screened, and only require the services of an optometrist; who are all military. Additionally, a military technician can be scheduled to remain in the clinic until the last patient departs, in the event his services are required.
The output from the Arena model reports the average EOD from the 60 simulated days. While this is a valuable statistic for evaluating and comparing policies, it does not fully represent the potential impact of implementing a specific policy. The simulation was updated to export the EOD time for each of the runs tested. Now, not only can the average EOD be calculated but the times can be analyzed by quantile and determine the likelihood of the EOD occurring after specific times.
This result doesn’t discredit the benefits of Policy F, but provides the clinic leadership with some performance measures for consideration when implementing this policy. Under Policy F, eighty percent of the time the last patient will depart the clinic between 1630 and 1730. The OIC can prepare for this extended EOD by offsetting the work schedule of a few staff members where they would report to the clinic 30 minutes to an hour later than the rest of the staff. The minor shift in staff coverage provides the leadership as well as the staff with predictability instead of requiring them to work overtime four days a week.
The simulation for Policy F indicates the potential for the staff to work beyond 1730, but at 10% this occurs an average of once every two weeks. Contrary to the parameters of the simulation, when the staff identifies a patient’s visit will extend well beyond the average EOD, they have the flexibility to schedule the dilation procedure as a follow-up appointment for a later day instead of remaining in the clinic late. The discrete event simulation follows the procedural norms which provide data on the most likely system outcomes, although in
0% 10% 20% 30% 40% 50% 60% 70% 80% 90% 100%
Base Policy A Policy B Policy C Policy D Policy E Policy F
Probability End of Day Occurs Before a
Certain Time
Before 1630
Before 1700
Before 1730
practice, staff members may use rational judgment to deviate from system protocols under specific and rare circumstances.
4.5TOTAL REVENUE IN RELATIVE VALUE UNITS
Each patient encounter has an associated relative value unit (RVU) which is an estimated cost for the services conducted by the clinic. Although the service members and other beneficiaries do not incur these costs (technically the military health insurance company would pay the hospital), this value is used for justifying budgetary allocations to Army Medical Centers and subsequently the clinics within them. Additionally, RVUs are used as a quantifiable measure of a provider’s performance and frequently included in annual
evaluation reports. RVUs may appear to be a trivial performance measure for a military clinic but in a civilian healthcare setting, the RVU analysis directly translates to the clinic’s costs for services which have relative value and are billed to the patient or their insurance company. The RVUs generated under each policy are depicted in Figure 4.7.
Figure 4.7 Daily Average of Total Clinic Revenue in RVUs
7592 7668 7985 8125 8506 8544 8901 7000 7500 8000 8500 9000 9500
Base A B C D E F
To tal Cl in ic R e ve n u e ( $/d ay ) Policy
Under the baseline model parameters, the simulation reported a daily RVU of $7592 ± $80. As discussed in Chapter 3, RVUs are only calculated for services performed during a patient encounter and since follow-up appointments are recorded against the original visit, they do not contribute to the clinic’s RVU total. The RVU calculations are based on the clinic’s annual average RVU per visit and therefore the baseline results serve as a benchmark for comparison for the other policies.
The clinic’s total revenue increases as the total number of scheduled patients increases, which is expected. The simulation results for Policies B, D, and F identify that the addition of the two scheduled patients to the walk-in provider provided a significant increase in revenue over the corresponding policies. Regardless of the scheduling policy the leadership decides for the staff optometrists, at a minimum the policy needs to incorporate an increase in the number of scheduled patient appointments for the walk-in provider. The policies tested which added two scheduled patients to the walk-in provider resulted in a 5% increase in revenue over similar policies where the walk-in provider schedule did not change. This simple improvement over a 240 work day year, yields about a $90,000 increase in annual clinic revenue. Therefore, at a minimum, the clinic should implement Policy B which has no impact on patient wait times or time in the system, yet increases annual revenue by $94,000.
Figure 4.9 Daily Revenue Compared to Average End of Day Time Figure 4.8 Daily Revenue Compared to
The graphs in Figures 4.8 and 4.9 illustrate the impact of the policies on wait times and EOD when compared to clinic revenue. When comparing two similar policies, (such as C and D), the wait times and average EOD times are similar, yet under Policy D the revenue is $382 larger. Comparing Polices E and F, the patient wait times are similar and the EOD times only differ by two minutes but the revenue for Policy F is $357 more than Policy E. These results suggest that if the clinic is willing to increase the number of patients served by the staff optometrists, it is more advantageous to also increase the number of scheduled patients served by the walk-in provider.
CHAPTER 5: CONCLUSIONS
This research studied the optometry clinic system to establish a baseline simulation model and then tested six scheduling policies to improve the clinic’s service capacity which in turn would increase the revenue generated. As discussed in Chapter 3, the baseline model uses observed data to implement stochastic variations in system processes as well as
incorporates assumptions for data which was unobtainable. The baseline model was verified, validated, and used as a representative benchmark for comparison with the six scheduling policies.
Policy A tested the system by having one staff provider see patients 15 minutes offset from the other two staff optometrists. The theory is that this policy will minimize the “surge” of patients arriving to the clinic at the same time which would increase wait and service times at the reception and technician stations. The simulation results display that this policy has the same performance measures as the base policy and in the case of EOD time, Policy A performed worse than the base. This test illustrates that the reception and
technician stations are adequately staffed and potential delays occur when the patient is with the optometrist, which is expected since the exam accounts for the majority of the patient’s time in the clinic. The simulation shows that under the current level of resources, there is no advantage to implementing a scheduling policy which simply offsets appointment times.
A focus of this research has been to determine the feasibility of the clinic leadership’s desire to server more patients each day by raising the number of appointments for staff optometrists. This parameter is tested in Policies C and E, which implemented schedules allowing optometrists to see 13 and 14 patients per day respectively. The results in Chapter 4 highlight that both policies dramatically increase the clinic’s revenue but incur negative impacts to patient wait and EOD times. Under Policy C scheduled patient wait time is 34 minutes but is only five minutes longer in Policy E. End of Day time in Policy E occurs at 1700, which is 18 minutes later than Policy C, but the increased daily revenue for Policy E is $420 more than Policy C and $950 more than the base. The late EOD times for both
simulation results infer that if the clinic is willing to implement a scheduling policy which increases the number of patients each staff optometrist sees, they should assume slightly more risk with Policy E in return for the significantly higher rewards.
The optometry is tasked with providing an optometrist who is “on-call” to see walk-in patients with acute care eye issues. This optometrist also sees a limited number of scheduled patients and Policies B, D, and F analyzed the impact of increasing this number from seven to nine appointments each day. The results of Policy B, which only serves two more patients a day over the base model, yields a $392 increase in daily revenue while increasing the wait time of scheduled patients by less than four minutes.
Under Policy B, the wait time for walk-in patients does increase by ten minutes but these patients are not suffering from urgent conditions. Typically, patients suffering from severe eye trauma enter the hospital through the Emergency Department (ED), where the ED staff treats their other wounds and contacts the optometry clinic to notify them of the patient. In the rare occasion a walk-in patient presents to the clinic with a severe condition, they are immediately seen by any available provider. Adding ten minutes to the walk-in patient’s overall wait time is a minor drawback compared with the potential gains for the clinic. However, if the walk-in provider served ten scheduled patients (increase of three) with an average of four walk-in patients, the average number of patients per day will exceed 14 and result in increased wait times for both types of patients. Under the current walk-in arrival rate, the clinic should implement a policy (B, D, or F), which schedules nine eye wellness appointments for the walk-in provider each day.
This research also analyzed the staff utilization under the base scenario and each
scheduling policy. The scheduled utilization for the MSA at the reception station remained at 18% ± 1% regardless if the clinic served 49 appointments each day or 57 appointments and only increased 5% when the arrival rate for personnel with random questions was doubled. Clinic leadership was considering hiring a second MSA to assist with scheduling