ABSTRACT
JI, MIKYOUNG LEE. Functional evaluation of the mechanisms of reactive oxygen detoxification in the hyperthermophilic archaeon Pyrococcus furiosus using
complementation studies. (Under the direction of Amy Grunden)
study, P. furiosus SOR, Rd, NROR genes which are thought to be involved in SOR detoxification of O2- were cloned and expressed in E. coli strain JM105. Using
complementation studies, P. furiosus SOR was shown to detoxify O2- generated in the E. coli sodA, sodB strain (NC906) and restore growth under formerly nonpermissive
ii
BIOGRAPHY
iii
ACKNOWLEDGMENTS
I thank Dr. Petty and Dr. Hassan for serving on my advisory committee. I wish to thank the Libby lab, Hassan Lab, and Petty lab for letting me use their equipment and materials when necessary. I want to thank Xuelian Du and Erica Matloky for their support and Karen Kast-Hutcheson for her help with construction of the mutant E. coli strain. I thank Ming Yu and Alan House for the helpful discussions and instruction in the use of computer program for data analysis and graphical presentation. I thank T. J. Schneeweisfor the all his advice and help about teaching. I thank my family who encouraged, supported and stood by me all the time. I thank God who gave me strength for living and all the members of the church, especially, Dr. Tae Lee for helping with the data analysis. I give special thanks to Amy Grunden, for the endless patience and
iv
LIST OF CONTENTS
List of tables………v
List of figures………..vi
Introduction………..1
Materials and methods……….17
Results……….30
Discussion………....50
v
LIST OF TABLES
Table 1. Bacterial strains and plasmids used in this study ……….27 Table 2. The sequences and features of primers used in this study…….28 Table 3. The distribution of SOR, Rd, and NROR in microorganisms
vi
LIST OF FIGURES
Figure 1. Common oxygen detoxification enzymes present in aerobes
and the reactions they catalyze ………..…12 Figure 2. A standard SOD assay of P. furiosus superoxide reductase.
……….13 Figure 3. A model for the detoxification of oxygen in the
hyperthemophilic anaerobe P. furiosus……….….………..14 Figure 4. Oxygen detoxification enzyme in most of anaerobes……….15 Figure 5. The E.coli FL-Rd (norV) and NROR (norW) operon….……16
Figure 6. Gene replacement by PCR product mediated transformation..29 Figure 7. Restriction site analysis of the cloned P. furiosus SOR
and Rd expression vector……….……….39 Figure. 8. PCR analysis of P. furiosus SOR and Rd expression
vector………..….40 Figure 9. Restriction site analysis of the cloned P. furiosus
NROR expression vector……….…....41 Figure 10. P. furiosus SOR Expression in E. coli strain JM105 . ….…42 Figure 11. P. furiosus Rd Expression in E. coli strain JM105… ….….43
Figure 12. P. furiosus NROR expression in E. colistrain JM105…..…44 Figure 13. PCR verification of the E. coli norV mutant……….45
vii
Figure15. Complementation study of the ability of P. furiosus SOR to restore growth of an E. coli sodA,sodB mutant strain ……..…47
Figure 16. Complementation study of the ability of P. furiosus SOR to restore growth of an E. coli sodA, sodB, and norV mutant….48 Figure 17. P. furiosus SOR-Rd co-expression in E. coli strain JM105.
………. 49
Figure 18. Aligment of P. furiosus Rd with the E. coli Rd-domain
flavorubredoxin (NorW)………...57
1
INTRODUCTION
Reactive Oxygen Species Detoxification in Aerobes
Oxygen is a required element for most living organisms. Without it, much of the life on Earth today would not exist. Oxygen is used in aerobic organisms as a final electron acceptor in the respiratory electron transport chain, which ultimately provides energy for the cell via oxidative phosphorylation. Oxygen is also required as a substrate in many biosynthetic reactions but does pose a risk of generating reactive oxygen species (Hassan & Schrum, 1994). These reactive oxygen species (ROS) include superoxide (O2 -), hydrogen peroxide (H2O2) and hydroxyl radicals (HO-), which are all partially reduced intermediates of oxygen. In the normal operation of the electron transport chain, O2 is reduced directly to H2O by the cytochrome oxidase system. However, some intermediates along the chain can transfer a single electron to oxygen to produce an O2- radical and a further single electron transfer generates H2O2 and HO- (O2Æ O2-Æ H2O2 Æ HO- + H2O Æ H2O). These oxygen species are reactive to various kinds of cellular structures and
2
two superoxide anions to hydrogen peroxide and water molecules by dismutation. The hydrogen peroxide is then immediately converted into water molecules by an enzyme called catalase as shown in Figure 1.
3
It had been thought that no life could survive without oxygen until studies conducted by Louis Pasteur in1861 showed that yeast could thrive under anaerobic conditions in fermenting cultures. Pasteur determined that oxygen inhibits the process of fermentation, and he went on to differentiate microorganisms into ‘aerobic’, ‘facultative’ and ‘anaerobic’ based on whether the organisms absolutely required oxygen for growth, could grow with or without oxygen, or could not survive in the presence of oxygen, respectively. In the 1880’s, work was initiated in the development of techniques for growing anaerobes in pure culture, and in 1950, Robert Hungate had devised techniques that could be routinely used for the isolation of pure cultures of anaerobes.
It had been thought that strict anaerobes are by necessity anaerobic because they do not have any mechanisms to protect their cells from oxygen toxicity. This assumption that obligate anaerobes lacked oxygen detoxification capabilities arose from the
observations that these organisms typically contain little or no cellular SOD activity (McCord et al., 1971). Therefore, sensitivity of anaerobes to oxygen suggested the inability to detoxify superoxide molecules due to a lack of the required enzymes.
However, most of the anaerobic organisms, which often lack these classical ROS defense enzymes, show various degrees of tolerance to oxygen when they are occasionally
exposed to oxygen in their environments.
Hydrothermal Vent Organisms and the Discovery of a New Enzyme for Detoxification of Superoxide
4
system is strictly anoxic and very hot (>350 °C). Interestingly, observations indicated
that microbes from hydrothermal vents are able to survive exposure to oxygen under conditions of cold temperatures (~4 °C) (Marteinsson et al., 1997), suggesting that these
organisms possess some form of oxygen detoxification mechanism.
Researchers once thought that no living organisms could survive around
hydrothermal vents located on the ocean floor since the environment was judged to be too extreme for life, as they contained toxic chemicals, high temperature, enormous pressure, extreme acidity, and total darkness. However, in the late 1970’s, scientists discovered extensive communities of organisms such as six foot, red-tipped tube worms, large white clams, yellow mussels and pale crabs that congregate around hydrothermal vents in the deep sea. These vent chimneys are formed by cold seawater penetrating through cracks in the ocean floors and interacting with heated and chemically altered rocks of volcanic crust. This modified hot liquid is forced back to the ocean floor for tens to hundreds of meters to become plume spreads. By mixing with cold, oxygenated water, deposits of metal precipitation in the plume spread, creating chimney like structures called
hydrothermal vents (Prieur et al., 2001). Vent fluids contain gases, especially hydrogen sulfide, and microbes utilizing hydrogen sulfide as their energy source. Microbes from the vents serve as the primary food source for clams, mussels and other invertebrates, thereby forming the base of food chain in this ecosystem (Van Dover et al., 2002).
The microbes found in deep-sea hydrothermal vents are predominantly anaerobic hyperthermophilic species that can grow optimally above 80o C (Stetter, 1996).
5
carbohydrates and peptides producing organic acids, CO2, H2, and H2S as by-products (Fiala & Stetter, 1986). P. furiosus is classified as a member of the domain Archaea, which was identified as the third domain of life based on the 16S r RNA sequence-derived phylogenetic trees developed by Carl Woese (Woese et al., 1990). Phylogenetic trees constructed using 16S rRNA homology have indicated that thermophiles are in the most deeply rooted and shortest lineages, and are therefore regarded as the most primitive and slowest evolving organisms (Stetter, 1996).
For anaerobic hyperthermophilic microbes that live in deep-sea vents, exposure to cold, oxygen-containing water in their environment was thought to cause cell death. However, studies later showed that anaerobic thermophilic microbes including Pyrococcus furiosus could survive during long periods of time after exposure to cold, oxygenated seawater (Huber et al., 1990). However, the mechanisms used by the thermophilic anaerobes to survive the oxygen exposure had not been identified at the time.
In aerobic organisms, the primary source of the superoxide comes from the one-electron reduction of dioxygen by the components of one-electron transport chains.
6
release iron into the cytoplasm forming inactive [3Fe-4S] + centers in the enzymes. The free iron is maintained in reduced forms, and it further reduces the hydrogen peroxide creating hydroxyl radicals, which bind nonspecifically to every type of biomolecule, such as DNA, RNA, protein, polysaccharide, and lipids (Imlay, 2002). Furthermore, in
anaerobes, which often feature enzymes containing flavoproteins in their central metabolic pathways, superoxide generated by flavoproteins and oxygen can inactivate key metabolic enzymes that contain iron-sulfur clusters (Pan & Imlay, 2001).
In archaea, including P. furiosus, a family of ferredoxin-dependent enzymes that oxidize glycerol aldehyde-3-phosphate, formaldehyde, and glyceraldehyde contain tungsten and pterin cofactors as well as iron-sulfur clusters. These are irreversibly damaged by oxygen in vitro (Imlay, 2001). Thus, superoxide is produced by reactive interaction between oxygen molecules and flavoproteins and ultimately causes the inactivation of central catabolic pathways in strict anaerobes.
For most anaerobes that live in an environment transiently exposed to air, detoxification of reactive oxygen species is necessary for their survival. They show various degrees of tolerance to oxygen, and SOD and/or catalase enzymes are generally not present in their genomes. Therefore, there has been much interest in determining what mechanism other than SOD is being used by these organisms to detoxify oxygen.
7
ferric iron coordinated by four cysteines. Center II has ferrous iron bound in an
octahedral geometry to four histidines in the equatorial plane, and one cysteine and one glutamate in axial positions. Center II of Dfx is homologous to Nlr in D. gigas while center I of Dfx is similar to desulforedoxin (Dx) in D. gigas (Abreu et al., 2002). It is known that the center II of Dfx and Nlr are the sites where superoxide is bound. The enzyme’s function was first studied in 1996 in the laboratory of Danièle Touati. Dfx was cloned from Desulfovibrio baarsii and it showed complementation of SOD activity in E. coli SOD deficient mutants. Soon after, Liochev and Fridovich (1997) proposed that Dfx catalyzes the reduction of superoxide rather than dismutation at the expense of cellular reductant such as NAD(P)H. Later, this was confirmed as an oxidoreductase by Lombard et al. (2000a).
In 1999, Jenny et al. identified SOD activity in P. furiosus. The putative SOD was purified and was determined to have a M.W. of 14.3 kDa. The gene encoding this protein was identified using N-terminal sequencing and was found to contain 124 amino acids. It shows high homology to Dfx and Nlr of the sulfate reducing bacteria. High SOD activity was measured by a standard SOD assay at 25oC. However, there is a fundamental
difference in terms of enzyme property. In the assay, an increasing amount of bovine SOD inhibited cytochrome c reduction, which means that bovine SOD reduces the
8
is an oxidoreductase, not a dismutase and has accordingly been named superoxide oxidoreductase (SOR).
In the process of identifying and biochemically characterizing P. furiosus SOR, the small Fe-containing redox protein (~5.3kDa) rubredoxin (Rd) was identified as a physiological electron carrier for SOR reduction (Jenney et al., 1999). The Rd gene is located next to SOR in the P. furiosus genome, and is reduced by an NAD(P)H dependent oxidoreductase (NROR) using NAD(P) H as its electron donor (Auchere, 2002). NROR is a monomer with a M.W. of ~45 kDa. and contains one flavin adenine dinucleotide (FAD) per mole. Its physiological role is known to be reduction of rubredoxin in P. furiosus (Ma & Adams, 1999). A model for the detoxification of reactive oxygen species by SOR has been proposed and is illustrated in Figure 3. In this model, the direct electron donor to SOR is Rd, and the Rd is in turn reduced through a second electron donor, most likely NAD(P)H oxidoreductase (NROR). The further conversion of hydrogen peroxide to water molecules is thought to occur via peroxidase as genes encoding peroxidases have been identified in the P. furiosus genome (Jenney et al., 1999).
Most of the P. furiosus enzymes are not very active below 80oC, but SOR, NROR, and Rd are still active at low temperature (< 25°C) (Ma & Adams, 1999,
Grunden et al. 2003), which would obviously be advantageous for the ROS detoxification in P. furiosus since P. furiosus lives in an environment in which it would periodically encounter oxygen-containing cold seawater (Huber et al.,1990).
9
oxygen by SOD would be disadvantageous to anaerobes because this oxygen could potentially produce yet more superoxide as a result of cellular metabolism, and it is known that some of the enzymes in the fermentation pathways of anaerobes have reaction centers and iron-sulfur clusters that are especially sensitive to damage by superoxide. The hydrogen peroxide generated by SOR is a strong oxidant that is easily reduced within anaerobic cells where cellular reducing agents are abundant (Auchere & Rusnak, 2002).
Recent studies have confirmed that the enzymatic reactions involving SOR, Rd and NROR, which serve as the basis of the proposed model for oxygen detoxification in P. furiosus, can successfully reduce superoxide to hydrogen peroxide in vitro (Grunden et al., 2003). However, feasibility of the SOR pathway in vivo is still needed to
unambiguously prove that this is the mechanism responsible for oxygen detoxification in P. furiosus. To date, in vivo studies in P. furiosus have been hampered because of an absence of a usable genetic system in P. furiosus. As of now, tools for targeted gene disruptions, which would be required for in vivo investigation of oxygen detoxification in P. furiosus, are not available, and there are currently no stable selectable markers that can be used for introducing vectors into P. furiosus. As a result in the study presented here, E. coli, which is very amenable to genetic manipulation and has functional homologs to SOR, Rd, and NROR encoded in its genome (see below), will be used for in vivo feasibility of the oxygen detoxification pathway of P. furiosus.
10
E. coli contains the norVW genes (previously designated, ygaK and ygaD) which encode a flavorubredoxin (Fl-Rd, norV) and NADH:(flavo) rubredoxin reductase
(NROR, norW), respectively which are involved in nitric oxide reduction under anaerobic conditions. NorV and NorW are 49% and 42% similar to the sequence of P. furiosus Rd and NROR, respectively (In this study, Fig.18; Grunden et al., 2003). In E. coli, norV and norW have overlapping coding regions suggesting that they likely comprise a single transcriptional unit. YgaA, which has been identified as a transcriptional regulator of the norVW operon, is located upstream of the norVW operon and is transcribed in the
11
rubredoxin domain and the proximal FMN in flavorubredoxin and that these electrons are ultimately used for nitric oxide reduction (Gardner et al., 2002).
12
O2- + O2- + 2H+ Æ O2 + H2O2 (SOD) 2H2O2 Æ 2H2O + O2 (Catalase)
Figure 1. Common oxygen detoxification enzymes present in aerobes
and the reactions they catalyze
13
Figure. 2. A standard SOD assay of P. furiosus superoxide reductase (SOR). For this assay, superoxide is produced by Xanthine/ Xanthine oxidase, and
O2- is reduced by cytochrome c. O2- is removed by adding SOD. In graph A, increasing amounts of bovine SOD inhibit the cytochrome c reduction ndicating that SOD has removed the O2-. Adding excess bovine SOD has no
further effect. In graph B, the P. furiosus SOD-like enzyme was assayed. Addition of excess SOR caused the direct oxidation of cytochrome c indicating that it functions as an oxidoreductase, not a dismutase.
Graph modified from Jenney et al, (1999)
+SOD 1U (=3.4
µ
g)
+SOD 40,
+ 60U
Cyt c
Cyt c
+
SOR2.5
µ
g
+
SOR 6.2 µg
14 `
Figure 3. A model for the detoxification of oxygen in the hyperthemophilic, anaerobe P. furiosus
15
O2- + 2H+ + e- Æ H2O2 (SOR)
Figure 4. Oxygen detoxification enzyme in most of anaerobes.
16
Figure 5. The E.coli FL-Rd (norV) and NROR (norW) operon contains homologs of P. furiosus genes that are likely involved in SOR expression. The Rd- domain of norV has 49% similarity to P. furiosus Rd (PF Rd), NorW has 42 % similarity to P. furiosus NROR. YgaA is a the regulator of
the operon.
PF SOR PF NROR
17
MATERIALS AND METHODS
Bacterial strains and plasimds. The bacterial strains and plasmids used in this study are listed in Table 1.
Construction of recombinant P. furiosus SOR, Rd, NROR expression plasmids. P. furiosus SOR, Rd, and NROR genes were PCR amplified using boiled genomic DNA
as the template. The primers used for PCR amplification of the P. furiosus genes are
indicated in Table 2 and the specific restriction enzyme sites engineered into the
amplified genes that were used for recombinant cloning are designated in bold print. The
PCR amplication was performed using Accupol DNA polymerase (Gene Choice,
Gaithersburg, MD) and an Icycler (BioRad, Hercules, CA) programmed with the
following parameters: one cycle of denaturation at 95oC for 4 min., 30 cycles of 30 sec.
denaturation at 95oC, 30 sec. annealing at 55oC, and extension at 72oC for 2 min. The
amplified genes (SOR gene, 375 bp; Rd gene, 165 bp; and NROR gene, 1080 bp) were
purified using the Qiaquick PCR purification kit (Qiagen, Valencis, CA). For
construction of the recombinant plasmids, the restriction enzymes, NcoI and SacI, were
used for digestion of the P. furiosus SOR gene, BamHI and SalI for the P. furiosus Rd
gene, and SacI and BamHI for the P. furiosus NROR gene. The corresponding restriction
enzymes were used to digest the vector pTrc99A in its multiple cloning site. The
expression plasmids were produced by ligating the digested P. furiosus genes to the
18
furiosus SOR in pTrc99A), pMJ2 (P. furiosus Rd in pTrc99A), and pMJ3 (P. furiosus
NROR in pTrc99A). These plasmids were transformed into the E. coli strain XL1-Blue
using the CaCl2 method. To confirm the presence of the P. furiosus SOR, Rd and NROR
genes in the recombinant expression vectors, restriction enzyme analysis and PCR
verification using the appropriate primers (see Table 2) were done to ensure the presence
of the insert DNA.
Construction of compatible recombinant P. furiosus Rd and SOR expression plasmids and P. furiosus SOR and Rd co-expressing plasmids. There were a few attempts to clone both P. furiosus Rd and SOR genes into the same expression vector to
achieve co-expression. Because the genes are next to each other (10 nucleotides apart),
there was an attempt to clone the two genes as a single sequence into vector pTrc99A.
The Rd-SOR DNA sequence was amplified by PCR and purified (Qiagen, Hercules, Ca).
The resulting Rd-SOR PCR product was engineered to contain SalI and BamHI
restriction sites, and the PCR product was digested in overnight restriction reactions for
cloning into similarly digested pTrc99A vector DNA. The digested DNA was ligated
together using T4 DNA ligase and the resulting plasmid construct was transformed into
the E. coli XL1- Blue by the conventional CaCl2 method. Transformants were picked and
DNA was isolated from the transformants using the Qiagen Miniprep system to
determine if the P. furiosus insert DNA was present in the constructs. None of the
screened transformants appeared to contain the expected insert DNA based on
19
As an alternate method, the cloning vector, pPCR-Script was employed to clone
these two genes as a single sequence. Because the restriction enzyme sites of the Rd-SOR
PCR product are located at the ends of the DNA fragments, there is a possibility that
digestion at these restriction sites is inefficient. To alleviate this potential problem, the
Rd-SOR PCR product was first cloned into pPCR-Script that had been digested with the
blunt-end cutter EcoRV. The resulting ligation mix was transformed into XL1-Blue and
plated onto LB+Amp+Tet + X-gal media. Only white colonies, which indicated the
presence of the DNA inserted into the multiple cloning site of pPCR-Script, were picked,
and plasmid isolations were performed using the Quiagen Miniprep kit. One of the
transformants was shown to contain the insert by restriction site and PCR analysis. The
plasmid, which contained the P. furiosus Rd- SOR insert in pPCR-Script was digested
with SalI/BamHI and visualized on a 1% agarose gel. The DNA fragment that contains
the Rd-SOR genes with SalI and BamHI sites was cut and gel purified. The Rd-SOR
DNA fragment with appropriate restriction sites was ligated with pTrc99A cut with
corresponding restriction sites. The ligation mix was transformed into XL1-Blue and
plated into LB+Amp+ 0.3% glucose agar. The transformants were picked and plasmid
DNA isolated. However, none of the transformants was found to contain the Rd-SOR
insert.
A second attempt to clone the two genes into a single vector was prepared by
digesting the already cloned expression plasmids, pMJ1(P. furiosus SOR in pTrc99A)
with the restriction enzymes NcoI and SacI and pMJ2 (P. furiosus Rd in pTrc99A) with
the restriction enzymes BamHI and SalI. The digested P. furiosus SOR and Rd DNA
20
Purification kit. For the vectors, pMJ2 (P. furiosus Rd in pTrc99) and pMJ1 (P. furiosus
SOR in pTrc99A) were digested with NcoI/SacI and BamHI/SalI, respectively. The
digested vectors were gel purified. The SOR gene with the NcoI/SacI sites was ligated
into pMJ2 digested with NcoI and SacI, and the P. furiosus Rd DNA fragment with
BamHI/SalI sites was ligated into pMJ1 restricted with BamHI and SalI. The ligation
mixes were transformed into XL1- Blue Super competent cells (StrataGene, Kirkland,
WA). Transformants were successfully isolated that contained the expression plasmid
where the P. furiosus Rd gene had been ligated into the existing SOR expressing plasmid,
pMJ1. Plasmids were isolated from these transformants and the presence of the
appropriate insert DNA was verified by PCR and restriction site analysis. This construct
was transformed into JM105 to co-express the proteins following the procedure described
in the expression section. However, the expression studies later conducted with this
Rd-SOR expression clone did not indicate successful co-expression of both the P. furiosus
Rd and SOR genes in the E. coli expression strain JM105.
Since none of the previous attempts to produce a plasmid that could support co-
expression of P. furiosus Rd and SOR were successful, a strategy to clone P. furiosus Rd
in a plasmid that is compatible with the existing SOR expression plasmid was used
instead. In this case, a DNA fragment containing both the Trc promoter and Rd from
plasmid pMJ2 would be cloned into the compatible low copy number plasmid
pACYC184. To do this, plasmid pMJ2 was digested with SphI to release a DNA
fragment that contained the Rd gene and Trc promoter. Plasmid, pACYC184 was
digested with the blunt end cutter ScaI. Since SphI, which was used to isolate the
21
compatible blunt ends for ligation. Attempts to produce blunt-ended DNA involved
treatment with Mung Bean Nuclease (New England BioLab) or T4 DNA Polymerase
(New England BioLab) following the supplier’s recommendations. No clones
containing the P. furiosus Rd DNA were isolated even with some modification of the
protocols for producing blunt end DNA. A second attempt to produce a compatible
Rd-expressing plasmid was also done, and in this case pACYC177 is to be used as the vector.
No clones were obtained yet.
Expression of recombinant P. furiosus SOR , Rd, NROR proteins in the E. coli strain JM105. Plasmids containing the P. furiosus SOR, Rd, and NROR genes
(pMJ1, pMJ2, and pMJ3) were transformed into the E. coli strain JM105 for recombinant
protein expression. Expression of the recombinant genes is under the control of the Trc
promoter, a hybrid lac and trp promoter, which can be induced with
isopropyl-β-D-thiogalactopyranoside (IPTG), a non-degradable analog of allolactose. 30mL cultures of
JM105/pTrc99A, JM105/pMJ1, JM105/pMJ2, and JM105/pMJ3 were grown in LB
media at 37°C with shaking. Once the cultures reached an O.D.600 of ~1.0, IPTG was
added to a final concentration of 1mM to induce expression of the recombinant P.
furiosus genes. The cultures were incubated 3 more hours before harvesting. To
determine if recombinant proteins were successfully produced in whole cell samples, 1
mL aliquots of the cultures were collected just prior to IPTG-induction and 1, 2, and 3 h.
post induction. The OD600 was measured for every time-point sample. The samples were
centrifuged and the resulting pellets were then resuspended with differing amounts of 2X
22
bromophenol blue, pH 6.8) according to the O.D. by normalizing cell density at the time
of the IPTG induction. The samples were loaded in 12.5% polyacrylamide SDS gels, and
the protein expression was monitored using visual detection of Coomassie Blue-stained
gels.
Pellets from the 30mL cultures were resuspended in lysozyme buffer (0.03mg/mL
lysozyme in 50mM Tris, pH 8.0) and sonicated on ice for bursts of 30 to 60 sec. three
times. The cell free extracts were centrifuged at 15,300 rpm in Beckman F2402H rotor
for 20 min. Since the recombinant P. furiosus proteins should be heat stable, while the
majority of E. coli proteins are heat labile, aliquots of the cell free extracts were subjected
to heat-treatment which involved incubation of the samples in an 80oC water bath for 20
min. and centrifugation of the sample at 15,300 rpm in Beckman F2402H rotor for 20
min. to remove denatured E. coli protein. Protein concentrations of the samples were
determined based on the Bradford method (Bradford, 1976). 2X protein loading dye was
added and the samples were boiled at 100oC for 5 min. Samples (3~5 µg each) were
loaded onto 12.5% polyacryamide SDS gels. Protein detection was done by staining the
gel with Coomassie-Blue.
E. coli norV and nor W mutant strain construction. For disrupting norV (Flavorubredoxin) and norW (NAD(P)H dependant rubredoxin oxidoreductase) which
are homologous to P. furiosus Rd and NROR genes in E. coli, the PCR-based one step
inactivation of chromosomal gene method by Datsenko & Wanner ( 2000) was used. The
basic explanation for the strain construction is described in Figure 6. Plasmid, pKD3,
23
generation of PCR fragments encoding the chloramphenicol resistance marker and
homologous DNA regions for the target genes (norV and norW). The primers consist of
60 bases, which include 40 that are homologous to the flanking region of the target genes
and 20 bases that are complementary to the chloramphenicol resistance cassette (see
Table 2). The PCR products were gel purified (Qiagen, Valencia, CA). pKD46 is a helper
plasmid which carries the phage λ Red recombinase that is L-arabinose inducible.
pKD46 is cured from cells when the incubation temperature is raised to 37oC The sodA,
sodB deficient strain NC906 was used in the initial attempts to construct the norV, sodA,
sodB deficient strain. However, this approach did not yield the appropriate mutant
construct and as a result the E. coli strain LMG194 was used instead. The use of
LMG194 is recommended when expression vectors containing the arabinose promoter
(pBAD) such as pKD46 are used. The LMG194/pKD46 transformants were plated in LB
+ ampicillin + 0.3% glucose agar and incubated overnight at 30oC. Transformants
carrying pKD46 were grown in 10 mL SOB medium containing 0.2% of L-arabinose and
ampicillin at 30oC until the O.D.600 reached 0.6. The cultures were spun down at 9,500
rpm in Beckman C1015 rotor for 10 min. and washed three times with ice-cold 10%
glycerol in order to make the cells electrocompetent. The cells (LMG194/pKD46 and
NC906/pKD46) were suspended in 100µL of 10% glycerol and 50 µL aliquots were
placed into two separate microfuge tubes. The norV specific PCR products
(concentration ~1 µg) were added to the 50µL of the suspended cells and no DNA was
added to the other 50 µL of cells as a negative control. Electroporation was done by
using a Gene Pulser (Bio Rad, Hercules, CA) set at 2.5V, 200Ω, and 25µF according to
24
medium and incubated for 1-hour at 37oC. 10% of the electroporated cells were
employed in mutant strain construction. LMG194 was transformed with plasmid pKD46
using the CaCl2 method. The cells were plated into LB+ chroramphenicol agar and
incubated at 37°C overnight. The remainder of the cells was incubated overnight at room
temperature before plating the next day. For HMJI (LMG194, norV-) strain, P1
transduction was done to transfer the disrupted norV gene into NC906 (Miller, 1992).
PCR fragments, which have the norW homologous region and the chloramphenicol
resistance gene, were used for disrupting the norW gene region in E. coli strain NC906.
The procedures used were the same as described above for construction of the norV gene
disruption in LMG194. BW545 (wild type) and MJ100 (norV, sodA, sodB deficient
strain), and MJ200 (norW, sodA, sodB deficient strain) genomic DNAs were purified
using the GNOME DNA Kit (Bio 101, Carlsbad, CA) and the isolated DNA was sheared
with BstEII. To verify the mutants of norV and norW in the strains MJ100 and MJ200,
PCR analysis was conducted using the respective genomic DNAs as the templates and
the primers that are specific to outer region of the genes as well as the primers specific to
the disrupted genes (see Table 2 for primers).
In vivo P. furiosus SOR complementation studies in an E. coli sodA sodB deficient strain grown in M63 minimal media. The ability of the P. furiosus SOR gene to
complement an E. coli strain deficient in sodA and sodB was examined by growth activity
in M63 minimal medium without amino acid supplement, where restoration of growth
indicates complementation of SOD. The expression plasmid, pMJ1 (P. furiosus SOR in
25
transformed cells (MJ002) were grown overnight aerobically at 37 °C in M63 minimal
medium, containing glucose as its carbon source, 0.2% casamino acids (a source of
amino acids), and 100 µg/mL ampicillin (M63 glucose M.M. w. A.A + Amp). The
overnight cultures were used to inoculate 30 mL of M63 minimal medium that contained
glycerol as the carbon source and the appropriate antibiotics, but lacked amino acid
supplementation (M63 glycerol M.M. w/o. A.A.+ Amp). For each culture, the appropriate
volume of inoculum was added to give a starting OD600 of 0.06. As controls, cultures of
NC905, NC 906, and MJ001 (NC906/pTrc99A) were prepared as above. Prior to
incubating the 30 mL cultures, IPTG was added to a final concentration of 0.1 mM and
the cultures were incubated aerobically at 37oC with shaking (225 rpm). For the
complementation experiments, MJ002 (P. furiosus SOR in the E. coli sodA, sodB mutant)
cultures were prepared with and without IPTG supplementation in order to demonstrate
the effect of P. furiosus SOR expression on culture growth. During the growth
experiments, the OD600 of the cultures was measured at 3, 5, 7, 9, and 11 h. after
inoculation.
In vivo P. furiosus SOR complementation studies using the E. coli sodA, sodB, norV deficient strain. The ability of the P. furiosus SOR gene to complement an E. coli strain deficient in sodA, sodB and the norV gene was examined by growth activity in M63
minimal medium without amino acid supplementation as indicated in the section above.
The plasmids pTrc99A and pMJ1 (pTrc99A-SOR) were transformed into a sodA, sodB,
and norV deficient E. coli strain. The transformed strains (MJ101and MJ102,
26
glucose, casamino acids, ampicillin and chloramphenicol (30 µg/mL). These overnight
cultures were then inoculated into 30 mL of M63 minimal media that contained glycerol,
ampicillin and chloramphenicol. For each culture, sufficient inocula were used to provide
an initial culture OD600 of ~0.06. Growth of the cultures was monitored as indicated
above. Cultures of NC905, NC906, MJ001, MJ002, and MJ101 were prepared and grown
27
Table 1. Bacterial strains and plasmids used in this study
Strains
Genotype
Source
LMG194 F- ∆lac X 74 galE thi rpsL ∆phoA ∆ara174Leu:: Tn10
Invitrogen
XL1-BLUE recA1 endA1 gyrA96 thi-1 hsdR17 supE44 relA lac [F’ proAB
lacIqZ∆M15Tn10(Tet’)]
Stratagene
JM105 F' traD36 proA+ proB+ lacIq
delta(lacZ)M15 delta(pro-lac) hsdR4 sbcB15 rpsL thi endA1 lambda-
Lab collection
BW545 ∆(lacU)169 rpsL Lab collection HMJI LMG194norV::Cmr In this study
NC905 F- lambda- ilvG- rfb-50 rph-1 H. Hassan
NC906 NC 905sodA, sodB H. Hassan
MJ001 NC906/ pTrc99A In this study MJ002 NC906/ pMJ1 In this study
MJ100 NC906norV::Cmr In this study MJ101 MJ100 /pTrc99A In this study
MJ102 MJ100/pMJ1 In this study
MJ200 NC906norW::Cmr In this study
Plasmids
Genotype
Source
pTrc99A Trc promoter, Ampr, ColE1 ori Amersham Pharmacia Biotech
pMJ1 pTrc99A P. furiosus SOR In this study pMJ2 pTrc99A P. furiosus Rd In this study pMJ3 pTrc99A P. furiosus NROR In this study
pKD3 Ampr, Cmr B. Wanner
pKD46 Ampr, Temperature sensitive, γ Rec B. Wanner
pACYC184 Cloning vector, p15A ori, Cmr, Tetr New England BioLab pACYC177 Cloning vector, p15A ori, Ampr, Kanr New England BioLab pPCR-Script Lac promoter, Ampr, pUC ori,
28
Table 2. The sequences and features of primers used in this study. Bold lines indicate
the restriction sites for the each primer Gene
name Primer sequences Features of the primer Forward
5’-GGTGGTGGCCATGGTTAGTGAAACCATAAG-3’ NcoI site presence P.furoisus
sor
Reverse
5’-GATGAAGAAGAGCTCACTGACTTCTAT-3’
SacI site presence Forward
5’GGATCCGGAAGGAGGTATCATGGCAAAGTG-3’ BamHI site presence
P.furiosus rd
Reverse
5-’TAATCATGTCGACCACCTCAATCT-3’
SalI site presence Forward
5’-GAGCTCCAAGGAGATGAAATGAAGGTAGTT-3’ SacI site presence P.furiosus
nror
Reverse
5’-GTTGGGACTTCACATGGATCCTAGTGGAGA-3’ BamHI site presence Forward
5’-CCAGCACATCAACGGAAAAACTC-3’
outer region of the gene (-210 to -188) E. coli norV
(outer region )
Reverse
5’-ATTCTGGCTTTTCACCACACGGGC-3’
outer region of the gene (+158 to +181) Forward
5’-CCAGGACGCTCTGAAGTTATGC-3’
outer region of the gene (-303 to -283) E.coli norW (outer region ) Reverse 5’-GTATTTAGCGGCGGGGTTATTC-3’ outer region of the gene (+283 to +305) Forward 5’-TAAATTGAGGTTGCTATGTCTATTGTGGTG- AAAAATAACATGTAGGCTGGAGCTGCTTCG-3’ PCR product (norV-Cm
specific) Reverse
5’-CTTTGCCGAGGGAGCATTCCGGGCAGAGGA- AGTTATCCGGCATATGAATATCCTCCTTAG-3’
*Homologous region of the gene *chloramphenicol gene cassette region Forward 5’-GCCCGCCAACTGGTGAAAAATATTCGCAAA- CAGGACGCCATGTAGGCTGGAGCTGCTTCG-3’ PCR product (norW-Cm
specific) Reverse
5’-CGACATTTTACGCACAGTAGCCCACCTACA- TCGGCAATGTCATATGAATATCCTCCTTAG-3’
29
Figure 6. Gene replacement by PCR product mediated transformation.
A. Design of drug resistant cassette that has flanking region of the
resistance.
B. Design of target gene that has flanking region of the gene.
C. Primer design that has the flanking regions of the drug resistance
cassette (about 20 nt.) and target gene (about 40 nt)
D. Linear DNA fragment that has drug resistance and flanking portions of
the target gene generated by PCR amplication.
E. Gene disruption by homologous recombination between the linear DNA
fragment and the target gene.
30 RESULTS
Recombinant expression of P. furiosus SOR, Rd, and NROR in E. coli. In order to
study the P. furiosus oxygen detoxification mechanism, each of the P. furiosus SOR, Rd,
and NROR genes was PCR amplified and cloned into the expression vector, pTrc99A. To
confirm the presence of the correct insert, the plasmids were digested with the appropriate
restriction enzymes and DNA gels were used to determine if the expected fragment sizes
resulted. In some cases, PCR analysis was additionally performed to verify the presence of
the insert gene(s). For the P. furiosus SOR and Rd plasmids, expected sizes of DNA
fragments (375 bp and 165 bp respectively) were observed for both the restriction site and
PCR analysis (Figures 7 and 8). For the P. furiosus NROR plasmid, the expected sizes
DNA fragment (~1100bp) was obtained by restriction site analysis (Figure 9). The P.
furiosus SOR, Rd, and NROR plasmid constructs were transformed into the E. coli strain
JM105 for protein expression. For the expression, a final concentration of 1 mM IPTG was
added to the cultures to induce expression of the recombinant P. furiosus proteins.
Harvested cells were broken and the cell free extracts were loaded onto
12.5%-polyacrylamide-SDS gels for visual confirmation of successful recombinant protein
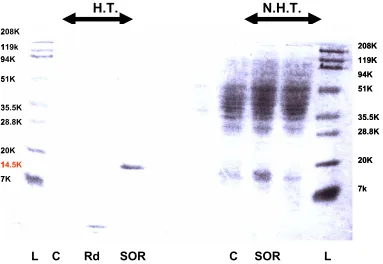
expression. A distinct band corresponding to the expected size for the P. furiosus SOR
protein (14.5 kDa) was observed in the cell free extracts of the E. coli samples that
contained the SOR expression plasmid and were induced with IPTG (Figure 10). The cell
free extract samples were then subjected to heat treatment in an effort to demonstrate the
heat stability of the recombinant P. furiosus SOR protein. SDS-PAGE analysis of the
31
band that migrated at the expected size for SOR, thus confirming that the recombinant P.
furiosus SOR was thermostable, unlike the majority of the E. coli proteins that were
denatured during the heat treatment.
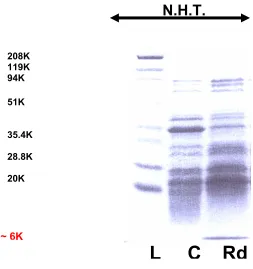
For Rd protein expression, the expected size of the protein, which is ~ 6 kDa, was
observed in both the untreated and heat-treated samples. A distinct band in the heat treated
samples was found in the Rd lane at the bottom of the gel (Figure 10) and similar bands
were observed in the untreated cell-free extract of the Rd expression samples (Figure 11).
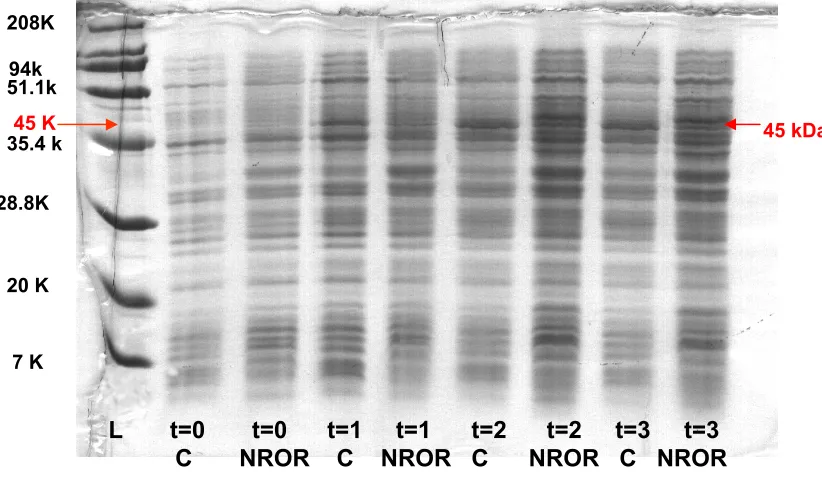
For the P. furiosus NROR protein expression experiments, it was often difficult to
identify an expressed protein band corresponding to the expected size (~45 kDa) for NROR.
From several trials, putative expression of NROR was observed in the whole cell pellet
samples on one occasion (Figure 12). The difficulty in over-expression of P. furiosus
NROR was thought to be due to the prevalence of rare codons (AGG and AGU coding for
arginine, AUA coding for isoleucine, and CUA coding for leucine) in the P. furiosus
NROR gene sequence. Of the 361 amino acids in the NROR sequence, 7 are encoded by
rare Arg codons, 17 by rare Ile codons, and 17 by rare Leu codons, which can result in poor
over-expression or in the production of truncated proteins in E. coli cells. To overcome this
problem, a rare codon plasmid, pRIL, which contains genes for the tRNAs for the rare Arg,
Ile, and Leu codons, AGG, AGA, AUA, and CUA, respectively, was transformed into the
E. coli expression strain JM105 which also harbors pMJ3 (P. furiosus NROR in pTrc99A).
NROR protein over-expression was still not detected by visualization in a
12.5%-polyacrylmide-SDS gel even with coexpression of the rare tRNAs. Expression
experiments will be continued in order to identify conditions under which P. furiosus
32
confirmed by both visual identification as well as by enzyme activity as described by Ma &
Adams. (1999).
E. colinorV (Fl-Rd-) and norW (NROR-) mutant strain constructs. The “One-step
inactivation of chromosomal genes in E. coli K-12 using PCR products” method by
Datsenko and Wanner (1999) was used in this study to inactivate specific target genes, and
it is based on PCR-mediated gene replacement. For construction of the norV (Fl-Rd-) specific gene disruption, two colonies from overnight-incubated cells were isolated on the
LB+ Cm selection plate, which were putative norV specific mutants (norV in LMG194
strain). These two isolates along with the wild type strain, BW545, were subjected to PCR
analysis for verification of the targeted gene disruption. For the PCR analysis, sheared
genomic DNA from each isolate and the control strain were used as the DNA templates and
primers that are specific to either the outer region of the genes or located within the
disrupted genes were used (See Table 2). The different primer combinations would yield
different sized PCR products. The expected sizes of the NorV distrupted DNA are 1.1 kb,
1.4 kb, 1.3 kb, and 1.7 kb when the following primer combinations are used: 5’ norV:Cm
specific and 3’ norV:Cm specific primers, 5’ outer region and 3’ norV:Cm specific primers,
5’ norV:Cm specific and 3’ outer region primers, and 5’ outer region and 3’ outer region
primers, respectively. The expected DNA size when using the wild type DNA as the
template DNA and the 5’ outer region and 3’ outer region primers is about 2.0 kb. PCR
analysis of one of the two isolates did result in the production of PCR fragments that
matched the expected sizes. The verified strain was designated HMJI (norV deficient strain
33
sodB mutant strain NC906 using P1 phage in order to produce a strain for use in the SOR
complementation studies. The successful introduction of the disrupted norV gene into
NC906 by P1 transduction (Miller, 1992) was verified using PCR analysis (Figure 13), and
the resulting strain was named MJ100. For construction of an E. coli strain with a norW
gene disruption, four colonies were isolated from the overnight-incubated cells. In this
case the norW -Cmr PCR fragment could be directly integrated into E. coli strain NC906. The four isolates were subjected to PCR analysis to confirm the correct location of the
chromosomal insertion using the appropriate primers (Table 2). One of the isolates gave the
expected PCR fragment sizes and was given the strain name MJ200 (Figure 14).
P. furiosus SOR is able to complement the growth defect in a sodA, sodB deficient E.
coli strain. Underaerobic conditions, bacterial mutants defective in sodA and sodB are not
able to grow in minimal media lacking amino acid supplementation because the protective
enzymes against superoxide toxicity are impaired. Excessive amounts of superoxide can
cause irreparable damage to the cell. A primary target of superoxide-mediated damage is
[4Fe-4S] cluster-containing enzymes. One particular enzyme, which is known to incur
superoxide damage, is dihydroxyacid dehydratase, a key enzyme involved in branched
amino acid biosynthesis (Kuo et al., 1987). Thus, amino acid biosynthesis is expected to be
impaired in cells lacking SOD activity, and as a result, there will be poor growth of a sodA,
sodB mutant E. coli strain in minimal media lacking amino acid supplementation. In this
study, it was observed that recombinant expression of the P. furiosus SOR restored the
growth of the sodA, sodB mutant E. coli strain in the M63 minimal medium lacking amino
34
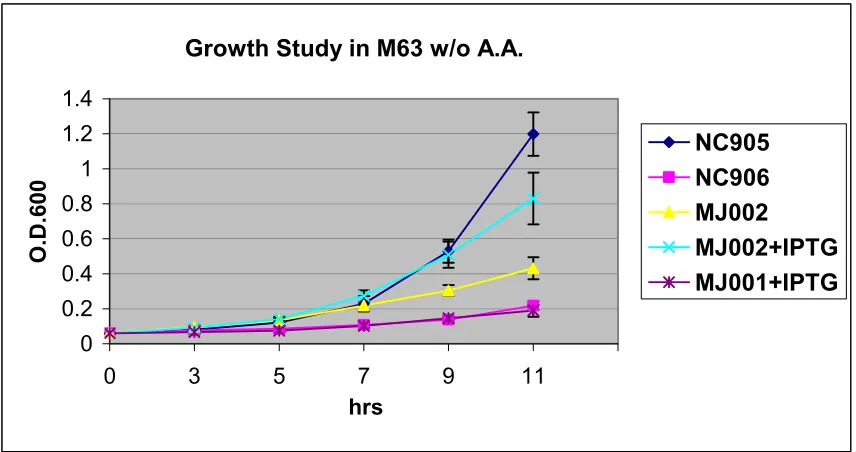
mutant strain expressing P. furiosus SOR ) grew up to approximately 62% of the O.D. level
as compared to the wild type strain, NC905, while NC906, the sodA, sodB mutant strain
showed poor growth in the M63 minimal media in the absence of amino acid
supplementation. It was also shown that the amount of SOR expression in the cell is
critical to restoring growth since the MJ002 strain only grew well in the minimal media
without amino acid supplementation when IPTG was added to induce over-expression of P.
furiosus SOR. Growth was also monitored for NC906 containing the empty expression
vector pTrc99A to show that the restored growth capabilities for strain MJ002 is due only
to the presence of the SOR-expressing vector. The growth experiments were repeated five
times and the data shown in Figure 15 are the average of all five trials. Bars indicate the
standard deviation of the data sets.
P. furiosus SOR is only able to support a low level of growth restoration in a sodA,
sodB, and norV defective E. coli strain. It is proposed that rubredoxin is the primary
electron donor to SOR in P. furiosus reactive oxygen species detoxification based on SOR
activity data (Jenney et al., 1999; Figure 3). The Rd and SOR genes in the P. furiosus
genome, as well as in other anaerobes that contain SOR, are adjacent to each other
suggesting a relationship between the two proteins (Adams et al., 2002). In the present
work, the functional relationship between SOR and Rd is explored using the growth-based
complementation studies discussed above.
In this case, the P. furiosus SOR gene was transformed into the sodA, sodB, and
norV deficient E. coli strain (MJ100), and transformants (MJ102) were tested for their
35
particular complementation study, poor growth in the media would imply a functional
relationship between SOR and Rd (assuming that the Rd domain in norV is indeed
responsible for transferring electrons to SOR in E. coli), whereas good growth would
indicate that SOR is receiving the necessary electrons from another source. The results of
this experiment showed that there is only a low level of growth restoration in the sodA,
sodB, and norV deficient strain when P. furiosus SOR is overexpressed in the strain (Figure
16). MJ102 showed about 15% of the growth compared to the wild type strain. It is
thought that major electron donor to the P. furiosus SOR is not functioning properly due to
the disruption of flavorubredoxin gene (norV), but the SOR still receives the electrons
inefficiently from an unknown factor in the cell. The MJ002 strain showed 70% restored
growth compared to the wild type O.D. level, which is consistent with the previous P.
furiosus SOR complementation study in E. coli sodA, sodB mutant. The MJ100 strain
which is a triple mutant (sodA, sodB, norV) showed the poorest growth overall. The data
presented in Figure16 are the average of five separate growth experiments. Bars indicate
the standard deviation of the data. The requirement of Rd for SOR activity will be further
evaluated once the Rd and SOR coexpression construct has been successfully developed.
Co-expression of recombinant P. furiosus SOR and Rd in E. coli. This study presented
the preliminary evidence that P. furiosus SOR and Rd are both required for full
complementation of E. coli SOD activity. However, in order to further investigate the
functional relationship between the P. furiosus SOR and Rd, P. furiosus SOR and Rd need
36
The first attempt to clone both the P. furiosus Rd and SOR genes as a single PCR
fragment into a vector, pTrc99A, was not successfully achieved. A number of clones were
screened for the presence of plasmids containing the Rd-SOR genes from among 44 that
were originally isolated; however, no plasmids containing the desired insert DNA were
identified. In order to minimize the possibility of vector ligation without insert, the ligation
mix was digested with XbaI. An XbaI restriction site is located in the multiple cloning site
region in plasmid pTrc99A between the SalI and BamHI restriction sites which were used
to clone in the Rd-SOR DNA, and therefore, only empty religated vector would still
contain the XbaI site. The XbaI-cut ligation mix was then transformed into XL1-Blue cells.
Nine transformants were recovered and used for plasmid isolation, but again none of them
contained plasmids with insert DNA. Since it was possible that the uncontrolled
coexpression of Rd and SOR was preventing isolation of a stable Rd-SOR containing
plasmid, the XbaI-cut ligation mix was also transformed into JM105 and plated on
LB-glucose-ampicillin plates in an effort to prevent unintended expression of Rd and SOR.
Again none of the resulting transformants contained plasmids with the Rd-SOR insert.
Since it was possible that the failure to isolate a plasmid containing the Rd-SOR
insert DNA was due to inefficient digestion at either the SalI or BamHI restriction sites in
the Rd-SOR PCR product because these sites are situated very near the ends of the DNA
fragment, an alternate method for cloning was used in which the Rd-SOR PCR fragment
was directly cloned into the cloning vector pPCR-Script that had been digested with the
blunt-end cutter EcoRV. Furthermore, use of pPCR-Script as the cloning vector has the
additional advantage of blue/white screening to indicate whether transformed colonies of E.
37
that resulted from the transformation were used for plasmid isolation, and one of the
isolates did appear to contain insert DNA of the appropriate size based on restriction and
PCR analysis. The Rd-SOR DNA was subsequently cut from this vector using BamHI and
SalI and cloned into the appropriately restricted expression vector pTrc99A. Using this
cloning strategy, no plasmids were successfully isolated that contained the Rd-SOR insert
DNA.
At this point a different cloning approach was used which involved cloning SOR or
Rd into the already existing Rd (pMJ2) and SOR (pMJ1) expression vectors, respectively.
Using this approach, the P. furiosus Rd DNA was successfully inserted into the SOR
expressing plasmid pMJ1. Three separate SOR-Rd expression clones were transformed
into JM105 for coexpression studies. None of the three SOR-Rd expression clones
appeared to support expression of both the SOR and Rd, as only one distinct overexpressed
band migrating at ~14 kDa was observed (Figure 17). Thus, it seems that only SOR is
overexpressed using the SOR-Rd expression plasmids. The inability to overexpress P.
furiosus Rd on the same transcript as SOR may be due to mRNA instability or inefficient
binding at the ribosomal binding site located upstream of the Rd gene.
This failure to achieve coexpression of P. furiosus Rd and SOR prompted use of a
different cloning and expression strategy in which SOR and Rd are expressed from separate
but compatible expression plasmids in the same E. coli cell. In this case there was an
attempt to clone P. furiosus Rd along with the Trc promoter into the low-copy plasmid
pACYC184. However, technical difficulties involved in preparing blunt end pTrc-Rd
DNA for ligating into the ScaI digested pACYC184 vector have to date prevented the
38
pTrc-Rd DNA into another compatible low-copy plasmid pACYC177, which has the
benefit of having a stable kanamycin selection marker rather than the somewhat light
sensitive tetracycline marker from pACYC184. No clone was obtained yet in this method.
39
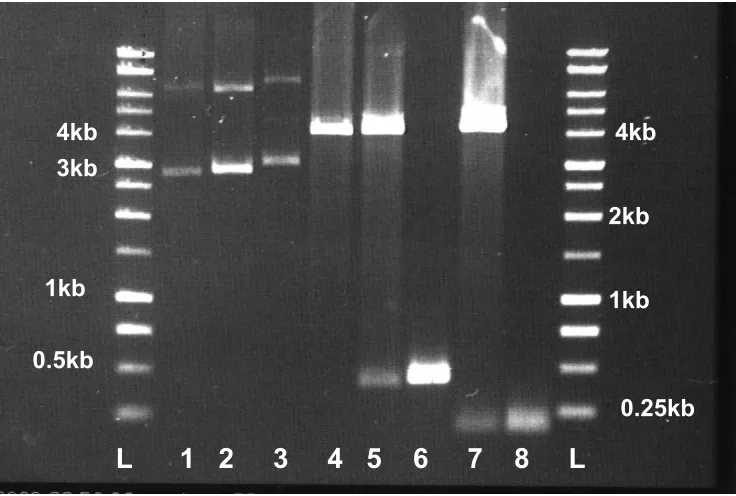
Figure 7. Restriction site analysis for the cloned P. furiosus SOR and Rd. L: DNA size
standards, Lane 1: pTrc99A, (undigested), Lane 2: pMJ2 (pTrc99A-Rd, undigested),
Lane 3: pMJ1 (pTrc99A-SOR, undigested), Lane 4: pTrc99A (digested by NcoI/SacI)
Lane 5: pMJ1 (digested with NcoI/SacI) Lane 6: SOR (PCR product) Lane 7: pMJ2
(digested with SalI/BamHI) Lane 8: Rd (PCR product)
L 1 2 3 4 5 6 7 8 L
0.5kb1kb 4kb 3kb
4kb
2kb
1kb
40
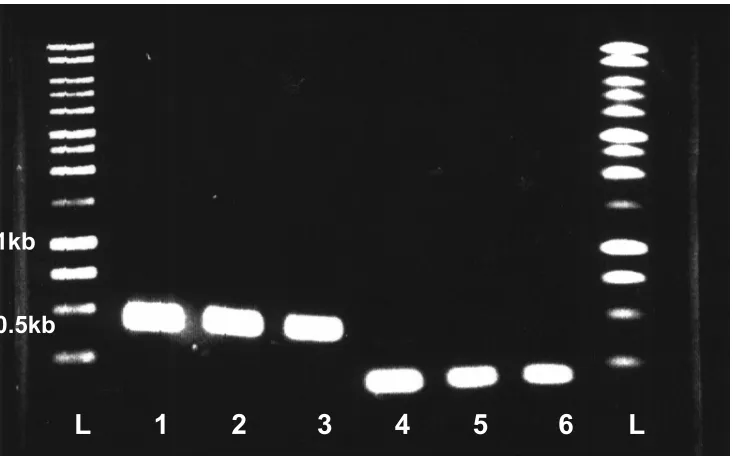
Figure. 8. PCR analysis of P. furiosus SOR and Rd. L: DNA size standards Lane 1: P.
furiosus SOR PCR product using genomic DNA as the template, Lane 2: cloned P.
furiosus SOR #1, Lane 3: cloned P. furiosus SOR #2, Lane 4 P. furiosus Rd PCR product
using genomic DNA as the template, Lane 5: cloned P. furiosus Rd #1, Lane 6: cloned P.
furiosus Rd #2.
L 1 2 3 4 5 6 L
1kb41
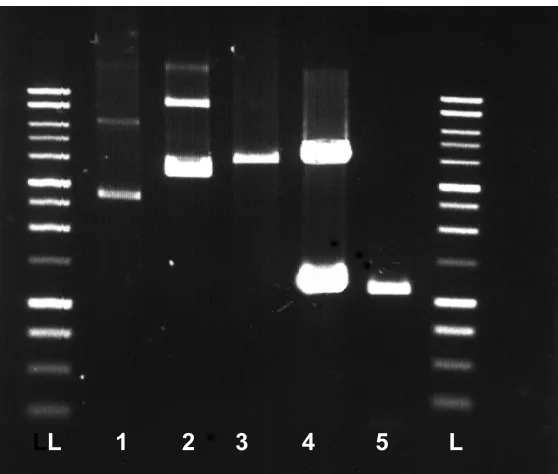
Figure 9. Restriction site analysis of the cloned P. furiosus NROR. L: DNA size
standards Lane 1: pTcr99A (undigested), Lane 2: pMJ3 (pTrc99A-NROR, undigested),
Lane 3: pTrc99A (digested with SacI/BamHI) Lane4: pMJ3 (digested with SacI/BamHI)
Lane 5: P. furiosus NROR PCR product
42
H.T.
N.H.T.
208K 119k 94K 51K 35.5K 28.8K 20K 14.5K 7K 208K 119K 94K 51K 35.5K 28.8K 20K 7k
L C Rd SOR C SOR L 208K 119k 94K 51K 35.5K 28.8K 20K 14.5K 7K 208K 119K 94K 51K 35.5K 28.8K 20K 7k 208K 119k 94K 51K 35.5K 28.8K 20K 14.5K 7K 208K 119K 94K 51K 35.5K 28.8K 20K 7k
Figure 10. P. furiosus SOR expression in E. coli strain JM105.
Expected M.W. is 14.5k Da. L: M.W. standards, C: control, pTrc99A only,
Rd: pTrc99A-Rd, SOR: pTrc99A-SOR
43
Figure 11. P. furiosus Rd expression in E. coli strain JM10. Expected M.W. is ~6kDa
L: M.W. standards C: control, pTrc99A only Rd: pTrc99A-Rd
N.H.T.: Cell free extract, not heat treated (5µg per lane) 208K
119K 94K
51K
35.4K
28.8K
20K
L
C Rd
~ 6K
44
Figure 12. P. furiosus NROR expression in E. coli strain JM105. Expected M.W. is
about 45 kDa., L: M.W. standards, C: control, pTrc99A only, NROR: pTrc99A-NROR
t stands for the time (hours) after ITPG induction.
208K 94k
51.1k
35.4 k
28.8K
20 K
7 K
45 K
L t=0 t=0 t=1 t=1 t=2 t=2 t=3 t=3 C NROR C NROR C NROR C NROR
45
Figure 13. PCR verification of E. colinorV mutant (MJ100) using different
combinations of gene-Cm specific or outer gene specific primers.
L stands for the DNA size markers
.
Lanes
Templates usedPrimers used Expected
sizes
1
MJ100
(
sodA,sodB,
norV)
5’-
norV-Cm
specific
3’-
norV-Cm
specific
~1.1kb
2
BW545
(Wild Type)
5’-
norV-Cm
specific
3’-
norV-Cm
specific
No DNA
3
MJ100
(sodA,sodB,
norV
)
5’- outer region
3’-
norV-Cm
specific
~1.4kb
4
BW545
(Wild Type)
5’- outer region
3’-
norV-Cm
specific
No DNA
5
MJ100
(
sodA,sodB,norV
)
5’-
norV-Cm
specific
3’- outer region
~1.3kb
6
BW545
(Wild Type)
5’-
norV-Cm
specific
3’- outer region
No DNA
7
MJ100
(
sodA,sodB,
norV
)
5’- outer region
3’- outer region
~1.7kb
8
BW545
(Wild Type)
5’- outer region
3’- outer region
46
Figure 14. PCR verification of E. colinorW mutant (MJ200) using different
combinations of gene-Cm specific or outer gene specific primers.
L stands for the DNA size markers.
Lanes
Templates usedPrimers used Expected
sizes
1
MJ200
(
sodA,sodB
,
norW
)
5’-
norW-Cm
specific
3’-
norW-Cm
specific
~1.1kb
2
BW545
(Wild Type)
5’-
norW-Cm
specific
3’-
norW-Cm
specific
No DNA
3
MJ200
(
sodA,sodB,norW
)
5’- outer region
3’-
norW-Cm
specific
~1.38kb
4
BW545
(Wild Type)
5’- outer region
3’-
norW-Cm
specific
No DNA
5
MJ200
(
sodA,sodB,norW
)
5’-
norW-Cm
specific
3’- outer region
~1.43kb
6
BW545
(Wild Type)
5’-
norW-Cm
specific
3’- outer region
No DNA
7
MJ200
(
sodA,sodB,norW
)
5’- outer region
3’- outer region
~1.72kb
8
BW545
(Wild Type)
5’- outer region
3’- outer region
47
Growth Study in M63 w/o A.A.
0 0.2 0.4 0.6 0.8 1 1.2 1.4
0 3 5 7 9 11
hrs
O.D.600
NC905 NC906 MJ002
MJ002+IPTG MJ001+IPTG
Figure 15. Complementation study of the ability of P. furiosus SOR to restore growth of
an E. colisodA, sodB experimental mutant in M63 glycerol minimal medium without
amino acid supplementation. Inocula of the cultures were prepared from overnight
cultures grown in M63 glucose minimal media with amino acid supplementation. The
experimental cultures were inoculated with enough inoculum to give a starting O.D. of
0.06. NC905: wild type E. coli strain, NC906: sodA, sodB mutant E. coli strain, MJ002:
pTrc99A-SOR in sodA, sodB mutant, MJ001:pTrc99A in sodA, sodB mutant. Where
indicated, a total concentration of 0 .1 mM of IPTG was added at the time of the culture
inoculation. The experiments were repeated five times. Bars indicate the standard
48
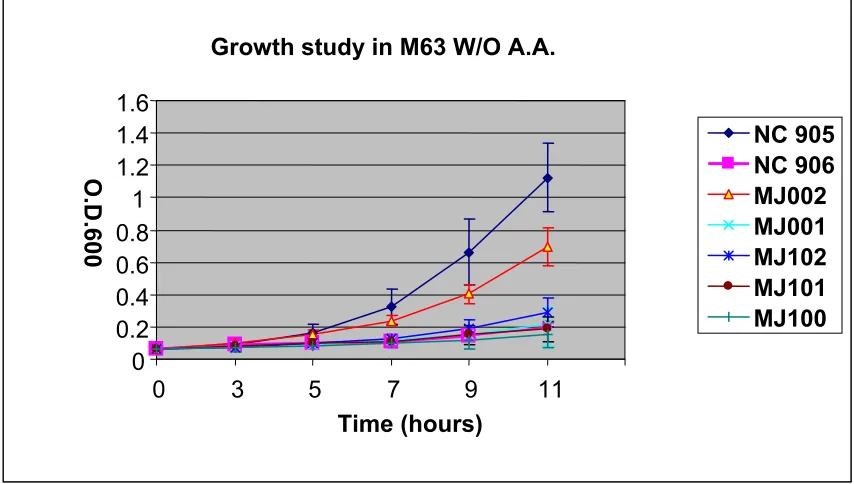
Figure 16. Complementation study of the ability of P. furiosus SOR to restore growth of
an E. coli sodA, sodB, norV mutant in M63 glycerol minimal medium without amino acid
supplementation. The experimental cultures were inoculated with enough inoculum to
give a starting O.D. of 0.06. NC905: wild type E. coli strain, NC906:sodA, sodBE.coli
mutant, MJ002: pTrc99A-SOR in sodA, sodB mutant, MJ001: pTrc99A in sodA, sodB
mutant, MJ102: pTrc99A-SOR in sodA, sodB, norV mutant, MJ101:pTrc99A in sodA,
sodB, norV mutant, MJ100:sodA, sodB, norV mutant. Experiments were repeated five
separate times. Bars indicate the standard deviation of the data set. Growth study in M63 W/O A.A.
0 0.2 0.4 0.6 0.8 1 1.2 1.4 1.6
0 3 5 7 9 11
Time (hours)
NC 905 NC 906 MJ002 MJ001 MJ102 MJ101 MJ100
49
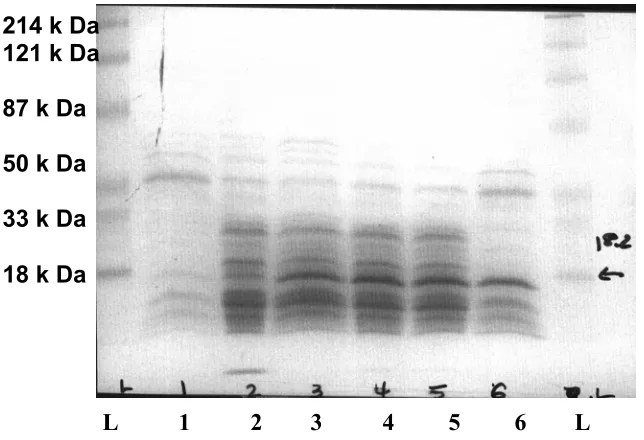
Figure 17. P. furiosus SOR-Rd co-expression in E. coli strain JM105. Expected M.W. is
14.5 kDa (SOR) and 6 kDa (Rd). L: M.W. standards, 1: pTrc99A, 2: pTcr99A-Rd, 3:
pTrc99A-SOR, 4: clone #2, 5: clone #3, 6: clone# 8. All the clones showed the SOR
band only, but not the Rd band. 214 k Da
121 k Da
87 k Da
50 k Da
33 k Da
18 k Da
50
DISCUSSION
Initial in vivo complementation studies in E. coli confirm aspects of the proposed P.
furiosus oxygen detoxification pathway
It is known that anaerobic microorganisms can periodically be exposed to oxygen in
their environments, and therefore, having some protective mechanism to detoxify reactive
oxygen species would be highly advantageous for their survival. It was recently proposed
by Jenney et al. (1999) that the hyperthermophilic anaerobe, Pyrococcus furiosus, has an
oxygen detoxification capability. In P. furiosus, the reactive oxygen specie superoxide is
reduced to hydrogen peroxide by the enzyme superoxide reductase (SOR). The electrons
required for this reduction are thought to be provided by rubredoxin (Rd), which in turn
receives it electrons from NAD(P)H:rubredoxin oxidoreductase (NROR). There has been
accumulating evidence that this pathway is valid when investigated through in vitro
experimentation. However, this proposed detoxification mechanism has not been
functionally studied in in vivo systems. Therefore, to more fully explore the P. furiosus
oxygen detoxification mechanism in vivo, functional complementation studies were
performed as part of this study. Due to the fact that P. furiosus is not very amenable to
genetic manipulation, E. coli mutant strains, which are deficient in the homologs of P.
furiosus genes involved in its oxygen detoxification mechanism, were employed in the
complementation study.
The complementation studies in here showed that high growth levels could be
51
medium without amino acid supplementation when P. furiosus SOR was expressed in E.
coli. This result indicates that the P. furiosus SOR detoxified the superoxide generated in
the E. coli cell that would otherwise have accumulated and caused cellular damage in the
sodA, sodB mutant, preventing growth of the cells in the amino acid deficient medium. For
further confirmation of P. furiosus SOR activity in the E. coli sodA, sodB mutant, SOR
enzyme activity assays should be conducted as well.
The ability of P. furiosus SOR to complement for E. coli SOD is consistent with
other complementation studies that used recombinant SORs from other diverse anaerobes
such as from Desulfovibrio vulgaris, Desulfovibrio gigas, Desulfoarcululus baarsii, and
Treponema pallidum (Lumppio et al.,2001; Silva et al., 2001;Pianzzola et al., 1996;
Lombard et al.,2000b). In these studies, the SOR analogs were shown to suppress the
deleterious effects of superoxide when they were expressed in E.coli SOD mutant strains
(Adams et al., 2002). From these complementation studies it is evident that the
recombinant SORs are efficiently receiving electrons from a donor in the E. coli cell.
It is important to note that the P. furiosus SOR complementation experiments
reported in this study were conducted at 37 ºC, the normal growth temperature for E. coli,
but a temperature well below that which is optimal for the activity of most enzymes from
hyperthermophiles (> 80 ºC). Therefore, the fact that the recombinant P. furiosus SOR
could successfully restore growth of the E. coli sodA, sodB mutant strain in amino acid
deficient minimal medium, indicates that the SOR is still enzymatically active at a
mesophilic temperature. This finding is consistent with the previously reported observation
that P. furiosus SOR is enzymatically active in in vitro assays conducted at 23 ºC, a