Copyright to IJIRCCE DOI: 10.15680/IJIRCCE.2016. 0401013 64
Prediction of Lung Disease using HOG
Features and Machine Learning Algorithms
R. Pradeebha 1* , S. Karpagavalli 2
Research Scholar, Department of Computer Science, PSGR Krishnammal College for Women, Coimbatore, India1* Associate Professor, Department of Computer Science, PSGR Krishnammal College for Women, Coimbatore, India2
ABSTRACT: Lung diseases are the one that mostly affects large number of people in the world. A sharp rise in respiratory disease in India due to infection, smoking and air pollution in the country. Respiratory diseases were no longer restricted to the elderly but were now being detected even in younger age groups. The early and correct diagnosis of any pulmonary disease is mandatory for timely treatment and prevent mortality. From a clinical standpoint, medical diagnosis tools and systems are of great importance. The proposed work is aimed at establishing more advanced diagnostic strategy for lung diseases using CT scan images. The three types of lung disease Emphysema, Pneumonia, Bronchitis are considered in this work. A dataset with 126 CT scan images of Emphysema, 120 CT scan images of Pneumonia and 120 CT scan images of Bronchitis are collected from National Biomedical Imaging Archive (NBIA) database. The classification of lung disease using Histogram of Oriented Gradients (HOG) features is carried out using classifiers Naive Bayes (NB), Decision tree (J48), Multilayer Perceptron (MLP) and Support Vector Machine (SVM). The performance of the models are compared for its predictive accuracy and the results are presented.
KEYWORDS : Emphysema, Pneumonia, Bronchitis, Histogram of Oriented Gradients, Naive Bayes, Decision tree, Multilayer Perceptron, Support Vector Machine
I. INTRODUCTION
Recent trends indicate that instances of chronic respiratory diseases are on the rise in India mainly due to vehicular pollution, air and dust pollution, habit of smoking and also increased population. A World Health Organization report indicates that India has a ranking number one in the world for lung disease deaths. Respiratory diseases like asthma, chronic obstructive pulmonary disease (COPD), Interstitial Lung Disease (ILD), pneumonia, tuberculosis (TB) are emerging as most important health problems in the country. The lungs are a pair of highly elastic and spongy organs in the chest. They are the main organs needed for breathing. They take in air from the atmosphere and also provide an area for oxygen to enter the blood and for carbon dioxide to leave the blood. There are various types of lung disease they are emphysema, pneumonia, bronchitis, lung cancer, sarcoidosis and pleural effusion[1]. Emphysema is a type of long-term lung disease. People with emphysema have difficulty in breathing due to a restriction in blowing air flow outside. Pneumonia is an inflammatory of the lungs. Generally the inflammation is caused by infection, however it can be caused due to deep breathing certain chemical substance fumes. Pneumonia can affect just one lobe of the right or left lung, a whole lung, or both lungs. Bronchitis is inflammation and also infection of the airways (bronchial tubes) of the lungs. Signs or symptoms consist of a determined cough that often produces mucus (sputum), fever, mild wheezing, and chest pain[2].
II. RELATED WORK
Copyright to IJIRCCE DOI: 10.15680/IJIRCCE.2016. 0401013 65
combination of gabor feature and Walsh Hadamard transform. Feature selection had been done using genetic algorithm and classification using Decision trees, K-nearest neighbor and MLP. The results shows the achievement of detecting the lung disease is 91% in MLP. In another work, they presented a method for segmentation and recognition of lung disease CT images using the fuzzy c-means clustering and the texture features are extracted using the gabor filtering and selecting the features using the Information Gain, Principal Component Analysis, Correlation based feature selection are employed with genetic algorithm. They achieved high accuracy using correlation based feature selection method and Naive Bayes classifier [4].
Xiabi Liu et al., [5] proposed a method to detect the 9 types of lung disease such as grand grass opacity, lobulation, cavity and vacuoles, spiculation, pleural identification, calcification, air bronchogram, bronchial mucus plugs and obstructive pneumonia. They used Fisher criterion and Genetic optimization (FIG) method to select the features from an image including the bag-of-visual-words based on HOG, LBP, wavelet transform and CT value Histogram in 511 ROIs captured from lung CT images. The lung disease are classified using the SVM, Bagging, Naive Bayes, K-Nearest Neighbor and Adaboost. They achieved high classification accuracy in SVM.
S.P. Kamalapriya et al., [6] proposed a method to detect the lung tissues in High Resolution Computed Tomography (HRCT) images. The ILD dataset consists of 130 images. The lung disease are normal, emphysema, ground glass, fibrosis and micro nodules. They extracted LBP and HOG features on the ROI segmented image. Each image patch is then classified based on reference dictionaries with a new patch-adaptive sparse approximation (PASA) algorithm.
Swati P. Tidke et al., [7] proposed a method to detect the lung tumor whether benign or malignant in Computer Tomography images. Pre-processed the images by denoising and segmented the images using thresholding and morphological operation. They used GLCM features and classified by SVM and the accuracy is 92.5%.
III.PROPOSED WORK
In the proposed work, prediction of lung disease from the CT scan images has been carried out which involves tasks like ROI segmentation, preprocessing, feature extraction and classification. Figure 1 shows the framework of the lung disease prediction task.
Figure 1: Framework of Proposed work of lung disease CT scan images
Lung CT Image
ROI Segmentation
Preprocessing
Feature Extraction
Testing
Building model
Classifier
Emphysema
Pneumonia
Bronchitis
Copyright to IJIRCCE DOI: 10.15680/IJIRCCE.2016. 0401013 66
A. ROI Segmentation
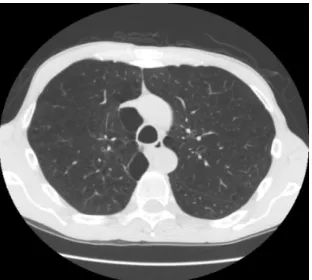
A region of interest is a selected sub-region of a CT scan image which is to be processed further. A ROI of 256×256 size by choosing the centre of abnormality x and y value. Figure 2 shows the original CT scan image of lung and figure 3 shows ROI segmented CT scan image.
Figure 2: Original Lung CT scan image Figure 3: ROI segmented image
B. Image Preprocessing
Image preprocessing improves the visual appearance of images and aids to improve the prediction accuracy. Median filtering is a nonlinear process useful in reducing impulsive. It is also useful in preserving edges in an image while reducing random noise. In a median filter, a window slides along the image, and the median intensity value of the pixels within the window becomes the output intensity of the pixel being processed. In median filtering, the value of the pixel is replaced by the median of the pixel values in the 3x3 neighborhood. The median filtered lung CT scan image is shown in figure 4.
Figure4: Median filtering image
IV.FEATURE EXTRACTION
In the proposed work, global features are extracted from the preprocessed CT scan image. The various steps involved in HOG feature extraction technique is elaborated below.
A. HOG Features
The Histogram of Oriented Gradients (HOG) is global descriptor of an image, mainly used in computer vision and image processing designed for object detection. The technique counts occurrences of gradient orientation in localized portions of an image.
Copyright to IJIRCCE DOI: 10.15680/IJIRCCE.2016. 0401013 67
small connected regions called cells, and also for the pixels within each cell, a histogram of gradient orientations is compiled. The descriptor is then the concatenation of these histograms. For improved accuracy, the local histograms can be contrast-normalized by calculating an approach of the intensity across a larger region of the image, called a block, and by using this value to normalize each cells within the block. This normalization results in better invariance to changes in illumination and shadowing. The steps involved in HOG features extracting process is shown in figure 5.
Figure 5. HOG feature extraction
a) Gradient Computation
In the HOG features, dividing the image window into small spatial regions called cells, for each cell accumulating a local 1-D histogram of gradient directions or edge orientations over the pixels of the cell. The calculation is the computation of the gradient values. The most common method is to apply the 1-D centered, point discrete derivative mask in one or both of the horizontal and vertical directions. Specifically, this method requires filtering the colour or intensity data of the image with the following filter kernels:
[-1, 0, 1 ] and [-1, 0, 1]T
Testing the gradients computed using Gaussian smoothing followed by one of several discrete derivative masks.
b) Orientation Binning
In the HOG features, the next step of calculation is creating the cell histograms. Each pixel calculates a weighted vote for an edge orientation histogram channel based on the orientation of the gradient element centred on it, and the votes are accumulated into orientation bins over local spatial regions is called cells. Cells can be either rectangular or radial. The orientation bins are evenly spaced 0 to 180 degrees or 0 to 360 degrees, depending on whether the gradient is “unsigned” or “signed”. In this experiment, the image pixel size cells are computed as 128x128 with 9 orientation bins for [0°,180°] interval. For each pixel’s orientation, the corresponding orientation bin is found.
Cell division
Gradient computation
Orientation binning
Descriptor block
Copyright to IJIRCCE DOI: 10.15680/IJIRCCE.2016. 0401013 68
c) Descriptor Block
In the HOG features, the gradient strengths must be locally normalized, which requires grouping the cells together into larger, spatially connected blocks. The HOG descriptor is the concatenated vector of the components and parts of the normalized cell histograms from every one of the block regions. These blocks typically overlap, meaning that each cell contributes more often than once to the final descriptor. Two main block geometries occur: rectangular R-HOG blocks and also circular C-HOG blocks.
In this experiment, the rectangular R-HOG is used for calculating the optimal parameters 2x2 cell blocks of 4x4 pixel cells with 9 histogram channels. For each CT scan image 36 HOG -global features are extracted.
d) Block Normalization
There are four different methods for block normalization. Let V be the non-normalized vector containing all histograms in a given block, ||ᶹ||K be its k-norm for k=1,2 and e be some small constant (the exact value, hopefully, is
unimportant). Then the normalization factor can be one of the following: L2-norm: =
|| ||
L2-hys: L2-norm followed by clipping (limiting the maximum values of v to 0.2) and renormalizing, as in L1-norm: =
|| ||
L1-sqrt: = | |
In addition, the scheme L2-hys can be computed by first taking the L2-norm, clipping the result, and then renormalizing [8].
V. MACHINE LEARNING ALGORITHMS
A. Decision Tree
A decision tree is a hierarchical structure that consists of nodes and branches [9]. There are three types of nodes: the root that has only outgoing branches, the internal nodes that have one incoming and two or more outgoing branches and terminal (leaf) nodes that have no outgoing branches. All terminal nodes have a class label assigned to them [10]. Each non terminal node in the tree represents a test on one of the attributes and each branch that comes out of the node represents one of the possible outcomes of the test performed. A query instance is classified by starting at the root node, testing the attribute specified by this node, and then moving down the tree branch corresponding to the outcome of the test for this attribute. This process is repeated until it gets to a terminal node, where the class label is given to the query instance.
B. Multilayer Layer Perceptron
The Multilayer Perceptron (MLP) is the most common neural network. This type of neural network is known as a supervised network because it requires a desired output in order to learn. The purpose of the MLP is to develop a model that correctly maps the input data to the output using historical data so that the model can then be used to produce the output result when the desired output is unknown. In the first step, the MLP is used to learn the behaviour of the input data using back-propagation algorithm.
This step is called the training phase. In the second step, the trained MLP is used to test using unknown input data. The back-propagation algorithm compares the result that is obtained in this step with the result that was expected. This kind of classification is called supervised classification. The MLP computes the error signal using the obtained output and desired output. The computed signal error is then fed back to the neural network and used to adjust the weights such that with each iteration the error decreases and the neural model gets closer and closer to produce the desired output [11].
C. Naive Bayes
Copyright to IJIRCCE DOI: 10.15680/IJIRCCE.2016. 0401013 69
independent of the values of other variable. A Naive Bayes classifier is a simple probabilistic classifier based on Bayes theorem with strong independence assumptions [12]. For the given classes wj dataset x,
x) =p(x |ω )P( ω ) p(x)
Where
p(x) = p(x | ω )P( ω)
D. Support Vector Machine
Support Vector Machine a new approach to supervised pattern classification which has been successfully applied to a wide range of pattern recognition problems. Support vector machine is a training algorithm for learning classification and regression rules from data. SVM is most suitable for working accurately and efficiently with high dimensionality feature spaces. SVM is based on strong mathematical foundations and results in simple yet very powerful algorithms [13].
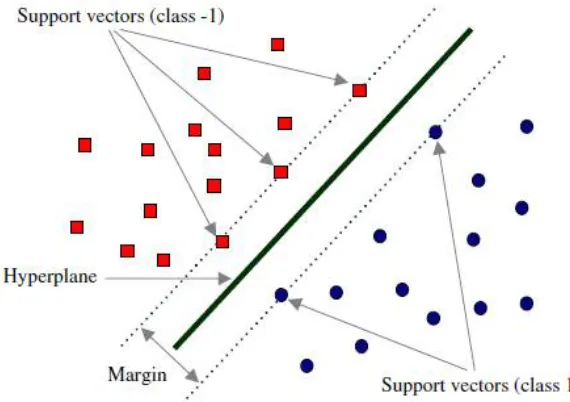
A support vector machine develops a hyper plane or number of hyper planes in a high or unlimited dimensional space, which is used for classification. If hyper plane is achieved the good separation and consists of the largest distance to the nearby training data points of any class. When classifier having the larger margin then generalization error will be lower. Assigned a set of training examples, each one marked for belonging to one of two categories, an SVM training algorithm builds a model that assigns new examples into one group or the other, making it very a non-probabilistic binary linear classifier [14]. The Maximal Margin Classifier has been shown in figure 6.
Figure 6: Maximal Margin Classifier
VI.EXPERIMENT AND RESULTS
Copyright to IJIRCCE DOI: 10.15680/IJIRCCE.2016. 0401013 70
A total of 366 images were used out of which 80% images were used for training and 20% images were used for testing. The features are extracted from the image data set and respective training set is created for constructing the appropriate model.
The performance of the trained models is evaluated for its predictive accuracy. Predictive accuracy is used as a performance measure for image classification. The prediction accuracy is measured as the ratio of number of correctly classified instances in the test dataset and the total number of test cases. The performance of the Naive Bayes, Multilayer Perceptron, Decision Tree and the Support Vector Machine classifiers are given in Table I.
Table I: Performance of the classifiers using HOG - Global descriptor
Classifiers Predictive Accuracy
Time taken to build model (In seconds)
NB 60.10% 0.1 J48 84.42% 21.14 MLP 92.34% 0.17 SVM 89.70% 0.13
Figure 7: Classification Accuracy of the Models
The results indicate that Multilayer Perceptron - a Neural Network model performs better than other models, even though its learning time is greater. Support Vector Machine model also equivalently providing better performance with minimum learning time. Greater accuracy can be achieved by increasing the size of the training dataset.
VII. CONCLUSION
Lung disease classification through CT imagery analysis is a important clinical information to diagnose the lung disease. The proposed work automated the lung disease classification task using CT scan image of lungs by employing supervised machine learning techniques, Naive Bayes, Decision Tree, Multilayer Perceptron and Support Vector Machine. Automatic detection of lung disease would be helpful in quick diagnosis of lung disease and improve the
0 10 20 30 40 50 60 70 80 90 100
NB J48 MLP SVM
Predictive Accuarcy
classifiers
Copyright to IJIRCCE DOI: 10.15680/IJIRCCE.2016. 0401013 71
quality of life of patients with suitable therapies. In future the work will be extended using both global and local features as well as an efficient interface will be designed.
REFERENCES
1. 'Lung Disease & Respiratory Health Center', WebMD, LLC, 2014.
2. Kraft M. Approach to the patient with respiratory disease: Goldman's Cecil Medicine, 24th edition, Philadelphia, PA: Saunders Elsevier, 2011. 3. C. Bhuvaneswari, P. Aruna, D. Loganathan, 'A new fusion model for classification of the lung disease using genetic algorithm', Egyptian
Informatics Journal, 15(2): 69-77, 2014.
4. C. Bhuvaneswari, P. Aruna, D. Loganathan, 'Advanced segmentation technique using genetic algorithm for recognition of lung disease from CT scans of thorax', International Journal of Engineering Research and Applications, 3(4): 2517-2524 , 2013.
5. Xiabi Liu, Ling Ma, Li song, Yanfeng Zhao, Xinming Zhao, Chunwu zhou, 'Recognizing common CT imaging signs of lung disease through a new feature selection method based on fisher criterion and genetic optimization', IEEE Journal of Biomedical and Health Informatics, 19(2): 635 - 647, 2014.
6. S.P. Kamalapriya, S. Pathur Nisha, V.S. Thangarasu, 'Enhanced image patch approximation for lung tissue classification using feature based extraction', Indian Journal of Research, 3(2): 226-228, 2014.
7. Swati P. Tidke, vrishali A, Chakkarwar, 'Classification of lung tumor using SVM', International Journal Of Computational Engineering Research, 2(5): 1254-1257, 2012.
8. N. Dalal, B. Triggs, 'Histograms of oriented gradients for human detection', IEEE Computer Society Conference on Computer Vision and Pattern Recognition, 1: 886 - 893, 2005.
9. P.N. Tan, M. Steinbach, V. Kumar, 'Introduction to Data Mining', University of Minnesota Publisher, Addison-Wesley, 2006. 10. Ian H. Witten, Eibe Frank, 2005. Data Mining: Practical Machine Learning Tools and Techniques: Morgan Kaufmann.
11. M. Misiti, Y. Misiti and G. Oppenheim, J-M. Poggi, 'Wavelet toolbox for use with MATLAB User’s Guide: Version 3, The Mathworks, 2006. 12. Narasimha Murty M, Susheela Devi V,' Pattern Recognition: An Algorithmic Approach', 2011.
13. Vapnik V, 'Statistical Learning Theory: Wiley-Interscience, New York, 1998.
14. Soman K.P, Loganathan R, Ajay V, 'Machine Learning with SVM and other kernel methods', PHI, India, 2009. 15. https://niams.imaging.nci.nih.gov/ncia/login.jsf.
16. S. Karpagavalli, C.V Banupriya, 'Electrocardiogram Beat Classification Using Support Vector Machine and Extreme Learning Machine', Published in the book ICT and Critical Infrastructure: Proceedings of the 48th Annual Convention of Computer Society of India,1, Advances in Intelligent Systems and Computing (AISC) Series, Published by Springer, 248, 2014.
17. S. Karpagavalli, Ms. K. Menaka, 'Mammogram Classification using Extreme Learning Machine and Genetic Programming', In the proceedings of IEEE Xplore and International Conference on Computer Communication and Informatics, 2014.