Plant Disease Prediction using Machine Learning
Algorithms
G. Prem Rishi Kranth
UG Student Koneru Lakshmaiah Education Foundation
Guntur (A.P), 522502
M. Hema Lalitha
UG Student Koneru Lakshmaiah Education Foundation
Guntur (A.P), 522502
Laharika Basava
UG Student Koneru Lakshmaiah Education Foundation
Guntur (A.P), 522502
Anjali Mathur,
PhD Associate Professor Koneru Lakshmaiah Education FoundationGuntur (A.P), 522502
ABSTRACT
Machine learning is the one of the branch in Artificial Intelligence to work automatically or give the instructions to a particular system to perform a action. The goal of machine Learning is to understand the structure of the data and fit that data into models that can be understood and utilized by the people. The proposed research work is for analysis of various machine algorithms applying on plant disease prediction. A plant shows some visible effects of disease, as a response to the pathogen. The visible features such as shape, size, dryness, wilting, are very helpful to recognize the plant condition. The research paper deals with all such features and apply various machine learning technologies to find out the output. The research work deals with decision tree, Naive Bayes theorem, artificial neural network and k-mean clustering and random forest algorithms. Disease development depends on three conditions-host plants susceptible to disease, favorable environment and viable pathogen. The presence of all three conditions is must for a disease to occur.
Keywords
Naive Bayes, Artificial neural network, random forest, k-means clustering
1.
INTRODUCTION
Machine Learning behaves like self-learning concept which will work without any interruption of a human. Now a day's self-driving cars, hand-writing recognition, Stock market are some of the examples of Machine Learning concepts. Machine learning will be able to predict the future based on the past or historical data. A computer program is said to be learned from experience E with respect to some clause of task T and performance measure P, if its performance on T as measured by P improves with experience E. Machine learning broadly uses three major learning algorithms Supervised learning, Unsupervised learning, Reinforcement learning. Machine learning can be used in each and every routine task performed by human being. The research work deals with plant disease prediction with the help of machine learning A plant disease is a physiological abnormality. Once a plant suffers from any diseases it shows up certain symptoms. symptoms are the outward changes in the physical appearance that are gradually developed and can be witnessed by naked eyes. Illustrations of symptoms are wilt leaf spots, rots, cankers and many more. The visible effects of disease can broadly categorize in following types: -
Wilting, it is loss of turgor pressure in a plant leading to temporary or permanent drooping of leaves, shoots, or entire plants from lack of water or infection by different pathogens.
Spot, is a definite, localized, round to regular lesion, often with a border of a different color, characterized as to location (leaf spot, fruit spot) and color (brown spot, black spot); Powdery mildew, is a fungal disease that affects a wide range of plants. Infected plants display white powdery spots on the leaves and stems. As the disease progresses, the spots get larger and denser.
Galls, these are abnormal growths that occur on leaves, twigs, or branches. They may be simple lumps or complicated structures, plain brown or brightly colored.
Dryness, after normal aging process generally leaf’s get dry and fall down from the tree, but at other times drying of leaves may be a symptom of fungal attacks.
In plant disease diagnosis, data provided is small and some of the values are missing that will require imputation of values we will replace all the null values with -1
The proposed research work applies the concept of ensemble learning, that is implemented through machine learning algorithms. After implementation the result is compare to get the model has the highest accuracy.
2.
LITERATURE SURVEY
In 2011, an innovative approach was presented[1] to automatically grade the disease on plant leaves. According to that, plant pathologists mainly rely on naked eye prediction and a disease scoring scale to grade the disease. That leads some problems associated with manual grading This manual grading is not only time consuming but also not feasible. Hence an image processing-based approach to automatically grade the disease spread on plant leaves by employing Fuzzy Logic had been proposed. The results are proved to be accurate and satisfactory in contrast with manual diseases are inevitable in plants. The proposed methodology aims to model a promising disease grading system for plant leaves. The system was divided into the following steps: (1) Image acquisition (2) Image Pre-processing (3) Color image segmentation (4) Calculating AT and AD (5) Disease grading by Fuzzy Logic.
Artificial neural network, Fuzzy logic. Selecting a classification method is always a difficult task because the quality of result can vary for different input data. Plant leaf disease classifications have wide applications in various fields such as in biological research, in Agriculture etc. The paper provides an overview of different classification techniques used for plant leaf disease classification.
In 2012, an article was published[3] having a detailed description on definition of disease, types of diseases, symptoms and causes of most commonly observed plant diseases
One article was published by Michigan University[4] regarding the threats caused due to diseases. Various conditions for disease development had been discussed there. An overview of major disease-causing organisms and the effect of diseases caused by them was given.
3.
EXPERIMENTAL ANALYSIS
The machine learning deals with classification, the research work is used to classify healthy and unhealthy plants. Our work is based on morphological features of the plant leaf. The techniques represented in this paper are
1. Decision tree 2. K-mean clustering 3. Naive Bayes 4. Random forest
5.
Artificial neural network3.1
Decision Tree
The algorithm contains Predefined target variables. It is a tree in which each branch node represent a choice between a number of alternatives and each leaf node represents a decision. The decision trees takes input as object or situation described by set f properties & output as Yes / No.
1. An Entropy[5] H(S) is a measure of the amount of uncertainty in the (data) set S (i.e. entropy characterizes the (data) set S).
H(S)=
2. Where, S – The current (data) set for which entropy is being calculated (changes every iteration of the ID3 algorithm), X – Set of classes in S, p(x) – The proportion of the number of elements in class x to the number of elements in set S.
When H(S)=0, the set S is perfectly classified (i.e. all elements in S are of the same class).
In ID3 algorithm, entropy is calculated for each
remaining attribute. The attribute with
the smallest entropy is used to split the set S on this iteration. The higher the entropy, the higher the potential to improve the classification here.
3. Information gain[5] IG(A) is the measure of the difference in entropy from before to after the set S is split on an attribute A. In other words, how much uncertainty in S was reduced after splitting set S on attribute A.
IG(A,S)=H(S)
Where, H(S) – Entropy of set S T – The subsets created from splitting set S by attribute A such that.
p(t) – The proportion of the number of elements in t to the number of elements in set S, H(t) – Entropy of subset t.
In ID3, information gain can be calculated (instead of entropy) for each remaining attribute. The attribute with the largest information gain is used to split the set S on this iteration.
[image:2.595.73.549.511.738.2]The plant disease prediction based on decision trees experimental setup was performed in R language and follows results were obtained, in figure-1 and Figure-2.
Fig 2: Decision tree accuracy
The decision tree has been produced (Figure 1) according to the root node selected. Here the root node is HEALTHY. Figure 2 shows the accuracy of the decision tree.
3.2
K-Means Clustering [8]:
It is for partitioning where each cluster center is represented by the mean value of objects in cluster. The input is data set and number of clusters. The output is set of k clusters. The algorithm randomly selects k objects as initial clusters for the remaining objects, an object is assigned to cluster to which it is most similar based on equidistance between cluster object and cluster centers. K-means algorithm improves by computing new mean values or centroids all the objects are again reassigned using the updated means.
Given a set of observations (x1, x2, …, xn), where each
observation is a d-dimensional real vector, k-means clustering aims to partition the n observations into k (≤ n) sets S = {S1, S2, …, Sk} so as to minimize the within-cluster
sum of squares (WCSS) (i.e. variance). Formally, the objective is to find:
=
where μi is the mean of points in Si. This is equivalent to
minimizing the pairwise squared deviations of points in the same cluster:
The equivalence can be deduced from identity
. Because the total variance is constant, this is also equivalent to maximizing the sum of squared deviations between points in different clusters (between-cluster sum of squares, BCSS),[1] which follows easily from the law of total variance.
Figure 3: K-Means
3.3
Naive Bayes[8]
Bayes theorem provides a way to calculate the probability of a hypothesis based on its prior probability and the probabilities of observing various data.
P(h/D)=(P(D/h)*P(h)
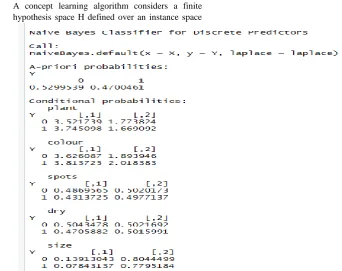
● A concept learning algorithm considers a finite hypothesis space H defined over an instance space
X. The task is to learn the target concept C:X--->[0,1], The learner gets a set of training examples. Brute force bays concept learning algorithm finds the maximum a posterior hypothesis.
R programming implementation of naïve-bayes classifier for plant disease prediction is as follows
Figure 4: Naive Bayes
[image:4.595.77.420.438.709.2]3.4
Random Forest[9]
In this algorithm there are two steps, in the first stage a random forest creation is produced and in the second step the values
that are produced from step one are used and predictions are made. Here select m features from n features where m<<n.
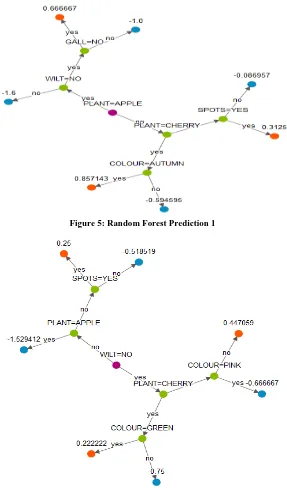
[image:5.595.155.442.148.636.2]Among the m features calculate the node d which has the best split point. Later split the node into child node and repeat the above steps until k number of nodes has been reached. Build the forest by repeating all the above steps z times to produce z number of tree.
[image:5.595.157.443.160.371.2]Figure 5: Random Forest Prediction 1
Figure 6: Random Forest Prediction 2
In Figure 5, Figure 6 different trees has been generated with the help of Random Forest algorithm and final prediction is made on overall dataset
3.5
Neural Network[9]
Let y be the correct output, and f(x) the output function of the network.
Error: E =y-f(x) , Update weights: <- α+ For the total output: =g( , )
At first initialize the weights and threshold and later perform the following steps over the input and desired output dj.
Then calculate the actual output
=f| |
Then later weights are updated
Here in the artificial neural network the output has same variable named HEALTHY and the inputs varies. The input in
[image:6.595.73.523.105.317.2]Figure 7 is plant, color, spots. But Figure 8 has four different inputs color, gall , powdery mildew, wilt.
Figure 7: Neural Network with three parameters
Figure 8: Neural Network with four parameters
Figure 9: Error Calculation
Here how many steps are needed and also the error while calculating the path is shown.
The error does not rise with number of inputs this can be proved with the Figure 8 and Figure 9.
4.
CONCLUSION
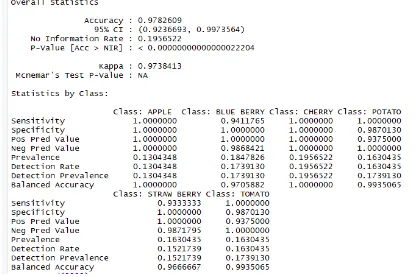
the accuracy of given data in Decision tree, Naive Bayes, SVM , Neural Network we got accuracies as show in Table 1. Table 1: Result Analysis
Methods Accuracy
Decision tree 89.97-97.83
Naive Bayes 83-.98-86.76
Neural Network 89.93
Here some statistical tests are performed to find out possible output predictions with the help of some inbuilt dataset and compared with the techniques with the help of the data set. While techniques are compared, other techniques may be better or poor. But the accuracy differs from each sample taken from dataset.
Future work will involve in image processing and spreading the usage of the model by training it for plant disease recognition on wider land areas, combining aerial photos of captured by drones and convolution neural networks for object detection. And the work may be on the shadowing techniques which is produces best results. By extending this research, there is a hope to achieve a valuable impact on sustainable development, affecting crop quality for future generations.
5.
REFERENCES
[1] Sanjeev S Sannakki, Vijay S Rajpurohit, V B Nargund, Arun Kumar R, Prema S Yallur. 2011. Leaf Disease Grading by Machine Vision and Fuzzy Logic. Gogte Institute of Technology
[2] Savita N. Ghaiwat, Parul Arora. 2014. Detection and Classification of Plant Leaf Diseases Using Image processing Techniques:
[3] Signs and symptoms of plant disease: Is it fungal, viral or bacterial?, Michigan State University Extension. [4] Kimberly Leonberger, Kelly Jackson and Robbie Smith,
Nicole Ward Gauthier. Plant Diseases. University of Kentucky College of Agriculture, Food and Environment.
[5] Online reference- Wikipedia wiki/ID3_algorithm, wiki/K-means_clustering,
[6] Online reference- Wikipedia wiki/Perceptron
[7] Tom M.Mitchell .1997.”Machine Learning”,McGraw Hill.
[8] Ethem Alpaydin. 2010. “Introduction to Machine Learning”, The MIT Press