3645 | P a g e
https://edupediapublications.org/journals/index.php/IJR/
Available online:
The possibility of applying a balanced score card in evaluating theperformance of Iraqi development banks
" Applied Study in Agricultural Bank "
Dr. Haitham Abdul
KhaliqResearcher -JaleelIbraheemShihab
University of Baghdad - Higher Institute of Accounting and Financial
Studies
Abstract
3646 | P a g e
https://edupediapublications.org/journals/index.php/IJR/
Available online:
the modern methods including balanced performance card to include financial and non- All aspects of performance in the bank.
introduction
The banking sector plays an important role in economic and social life because banks are one of the main elements in the process of economic development, which calls for finding a strong banking sector that helps finance all sectors with the funds they need. It is necessary to subject banks of all kinds to performance evaluation The soundness of its financial centers and the development of a sound banking sector that contributes effectively to the process of economic development. The performance appraisal function is an important and fundamental function of great importance, as well as developments in the field of communications and information. All these data call for the need to review traditional approaches to performance evaluation because they are limited to financial dimensions and objectives without attention to non-financial dimensions and objectives, Therefore, there is a need to adopt systems and methods to assess the performance of a comprehensive, integrated and balanced manner through which to obtain a clear and comprehensive picture of all aspects of banking performance, and the performance card Matawan new dimension in the evaluation of performance takes into account the standards Financial performance as well as non-financial metrics. The third topic dealt with the practical aspect that included evaluating the performance of the research sample bank (the Agricultural Bank) according to the Balanced Scorecard, which included The fourth section of the conclusions and recommendations.
Research Methodology First: Problem Research
3647 | P a g e
https://edupediapublications.org/journals/index.php/IJR/
Available online:
Second: Research Significance
The importance of research stems from the importance of the role played by development banks in the economic life which has an important and important role in the economic development process, as well as the importance of the banking sector, which is constantly evolving, as well as the role of performance evaluation in improving the performance of these banks, which Makes evaluation of bank performance necessary and requires the application of modern methods of evaluation in order to obtain a comprehensive and integrated assessment of all financial and non-financial aspects.
Third: Research Objectives
1
- Provide a conceptual framework for the concept of balanced performance card
and its importance and motives of use, as well as characterization of the basic dimensions of the card.
2
. Identify the reasons for the need to use a comprehensive balanced system to assess banking performance.
3
To verify the application of the Balanced Scorecard method in evaluating the performance of Iraqi development banks.
Fourth:Research Hypothesis
The application of the Balanced Scorecard method in evaluating the performance of Iraqi development banks contributes to achieving a comprehensive and balanced assessment of all aspects of financial and non-financial performance through the four dimensions included in the Balanced Scorecard.
Fifth: Borders Research
The search limits can be displayed by: 1
. Spatial boundaries: Defined in a selected sample of the Iraqi banking system represented in:
Agricultural Bank. 2
3648 | P a g e
https://edupediapublications.org/journals/index.php/IJR/
Available online:
Sixth: Sources of data and information collection
The collection of data and information related to the subject of the research was based on:
1
Scientific books and references. 2
- Letters and letters available in libraries that examined the performance
evaluation process. 3
. The annual and statistical reports of the Agricultural Cooperative Bank.
Previous Studies Previous Studies
1- (Abidi, Zaidounfarik Abdul, 2014) entitled "The use of balanced performance
card in improving the measurement of Iraqi banks - Applied research in Rafidain Bank".
The study pointed to the problem of the adoption of Iraqi banks in evaluating the performance of their implementation on the traditional financial indicators only and is not sufficient to keep pace with the continuous development in the business environment, which requires the necessary information necessary to evaluate the performance of all activities of the bank through the use of Balanced Scorecard, On the Balanced Scorecard, and the impact of the application of the card on the performance of Rafidain Bank, and the main findings of the study is that the goal of Balanced Scorecard is the periodic review of the performance of the bank, to identify the shortcomings for processing and processor The shortage of traditional management systems for its inability to link the different enterprise strategies, either the most important conclusion of the study's recommendations is to recognize the importance of using the Balanced Scorecard by banks and regulatory authorities and their impact and their role to determine the levels of performance.
-2 Balaska, Saleh, 2012, entitled "The applicability of the Balanced Scorecard as
a tool for assessing strategy in the Algerian economic institution, a case study
in some institutions."
3649 | P a g e
https://edupediapublications.org/journals/index.php/IJR/
Available online: Matkins
،
2002
-3
(Performance Evaluation in Facilities Management :Using the Balanced
Scorecard Approach).Evaluate the performance of facility management using the
Balanced Scorecard
This research investigates the procedures and methods of measuring the performance of enterprises under the Balanced Scorecard technology. The research indicates that the Balanced Scorecard is a widespread management framework for evaluating the strategic performance of the organizations and emphasizes the importance of non-financial standards in addition to the financial standards in the organizations. In many companies. The suggestions made for the implementation of a balanced scorecard may form future research bases and help to overcome the inherent shortcomings of traditional performance measures by providing a balance of information from a variety of sources to transitive dimensions Is the basis for all organizations.
Theoretical Framework of Research Variables First requirement: performance assessment First: The concept of performance evaluation
Performance evaluation is a stage of effective control achieved by comparing planned and planned goals with what has already been achieved. Performance evaluation is defined as "the process by which the organization compares actual performance to target performance and identifies strengths and weaknesses in performance, Of the extent to which performance contributes to ensuring the sustainability of the enterprise. " (Abu Qahf, 2002: 483)
3650 | P a g e
https://edupediapublications.org/journals/index.php/IJR/
Available online:
desire of senior management to identify and identify the strengths and weaknesses of performance. (Al-Zubaidi, 2011: 90)
Performance evaluation is defined as "comparing actual performance with specific indicators in advance to identify deviations and then taking the necessary corrective steps whenever possible and often comparing what is actually achieved" and what is targeted at the end of a certain time period is usually a year. 2003: 19). Performance evaluation is considered to be an assessment of the Bank's performance. It is the policy to determine the extent to which different departments and centers of responsibility in the Bank achieve the objectives set in advance, to identify deviations, explain their causes and identify appropriate corrections.
Second: The importance of performance evaluation
Evaluation of performance is critical to the diagnosis of the problems facing the organization and the judgment of the adequacy of its performance. The importance of evaluating performance can be highlighted in the following points: (Obeidi, 2009: 35)
1. Performance evaluation directly assists in the diagnosis and resolution of problems and knowledge of the strengths and weaknesses of the enterprise.
2. The performance appraisal process contributes to the improvement and development of the performance of officials. It helps the managerial heads to identify weaknesses and shortcomings in the performance of the staff and to work on their evaluation through training and development. (Hashim, 1989: 192)
3. Evaluation of performance encourages a constructive approach to problem solving. Evaluation provides concrete facts that can be used to make good decisions.
Third: Objectives of performance evaluation
3651 | P a g e
https://edupediapublications.org/journals/index.php/IJR/
Available online:
are some other performance appraisal objectives that can be summarized as follows: (Hindi, 1996: 7)
1 - Activating the SAIs in the performance of their work through the information provided by the performance evaluation so that they can verify that the activities of the organizations are sufficiently efficient and achieve their goals.
2 - to determine the adequacy of the use of available resources in a rational way to achieve a return of lower costs and good quality. (League, 26: 2013)
3 - Improve the supervision and follow-up performance and behavior of subordinates constantly in order to assess them to occupy the leadership positions in the Organization. (Abbas, 2003: 139)
Fourth: Performance evaluation procedures
The process of evaluation depends on several stages: (Sisi, 2011: 360)
1 - Planning stage: The preparation of budgets and discretionary lists if the process of performance evaluation is done through the rates set in advance and at this stage determine the status responsible for the evaluation process and future objectives expected.
2. Comparison of results: After the period covered by the plan, the results are compared. The actual performance is compared with the planned performance and the actual performance is compared to the actual rates.
3 - the stage of identifying deviations and interpretation: knowledge of differences and deviations between actual performance and expected performance or actual performance and then analyze these differences and know the reasons that led to its existence.
4 - the stage of dealing with deviations and processing: the final stage of the evaluation of performance as these deviations are addressed to avoid them in the next stage.
3652 | P a g e
https://edupediapublications.org/journals/index.php/IJR/
Available online:
Balanced Scorecard is one of the contemporary management tools provided by Kaplan & Norton. The Balanced Scorecard is a set of financial and non-financial measures designed to provide a comprehensive and quick picture of the senior management of economic unit performance. (Kaplan & Norton, 1992: 71)
(Morocco, 2006: 277) as an administrative system that helps senior management translate their organization's vision and strategy into a set of interrelated strategic goals and metrics. It has also been recognized as an important tool for measuring and evaluating performance in all companies that helps integrate disparate elements in the company's programs On the customer, redesign processes, improve quality and plan for the long run. (Kassem, 2006: 29)
Second: Characteristics of Balanced Scorecard
The Balanced Scorecard has several characteristics that distinguish it from the other methods of performance evaluation: - (Balaska, 2012: 24)
1 - Link to the strategy and vision of the organization, through their translation to the goals and metrics in four axes, which are the basis of the evaluation process and thus achieve balance.
2 - Achieving a balance between the short and long term goals. 3. Achieve the balance lost in traditional assessment measures.
4 - Enable the administration to take decisions, especially strategy and re - standardize performance in line with the goals.
Third: Balanced Scorecard Importance
The importance of the Balanced Scorecard is realized through the many benefits of its use which are the result of its application in different organizations. The card can be summarized as follows:
1 - attention to long-term performance and short-term after it was limited to financial performance, which measures performance in the short term.
3653 | P a g e
https://edupediapublications.org/journals/index.php/IJR/
Available online:
3 - To create a link between goals and performance measures, and give a comprehensive picture of the nature of operations in the organization.
4. The cause and effect relationship of operational activities and their implications for the results of the financial hub are shown in a coherent manner. (Idris and Al-Ghalbi, 2009: 154)
5 - A contemporary tool that gives an integrated picture of traditional financial standards and other intangible standards that have an impact on performance in the present and future. (Al-Naimi, 2007: 2)
Fourth: Dimensions ofthe Balanced Scorecard
The balanced performance card consists of four dimensions, and each dimension of these dimensions is related to the other with a causal relationship. These
dimensions are as follows:
1. Financial dimension
The financial dimension is one of the most important dimensions of performance evaluation as it represents the final outcome of the organization's activities to achieve shareholder satisfaction by increasing the value of their investments and increasing profits. (Dodin, 2010: 42). Financial objectives must be consistent with profits, growth and shareholder value. With the results of the financial performance of the competing organizations, and it is known that the financial performance measures are measured in the measured profit either net profit after tax or total operating profit resulting from the revenue interview with the costs realized as a result of those revenues. Because the focus on the past as well as the conditions of competition have changed and therefore the traditional financial standards do not improve customer satisfaction or even stimulate employees, in other words,
3654 | P a g e
https://edupediapublications.org/journals/index.php/IJR/
Available online:
the strategy and fit the goals with other goals and metrics in all dimensions of the performance card For a balanced. (Idris and Al-Ghalbi, 2009: 174)
2- Customers Dimension
Today, business organizations are looking at customers as being involved in success, having an active role in the decisions being taken, and they have enough intelligence to distinguish quickly between good products and services, and this makes the administration interested in developing and improving customer relationships , As all organizations seek to achieve the happiness and constant satisfaction of customers as a result of dealing with them rather than looking at that organization with a traditional perspective within the framework of meeting their needs. (Idris and Al-Ghalbi, 2009: 191)
The organizations develop their strategy based on the needs and requirements of the customers for their contribution to the success of the organization and its survival and competition, and can achieve this by providing products with high quality and appropriate prices, so the Balanced Scorecard has taken into account these characteristics by containing them after the customers. (Dudin, 2010: 46)
3- internal operationsDimension
Internal operations are the cornerstones of the Organization's performance and competitiveness. After internal operations, it focuses on the internal operational procedures that distinguish the organization from others. It will achieve the expectations of the expected customers efficiently and efficiently and achieve financial results that satisfy the shareholders. (Awad, 2009: 103)
3655 | P a g e
https://edupediapublications.org/journals/index.php/IJR/
Available online:
customers and the goals of owners. The main objective of this dimension is focused on how to deal with efficiency, quality, total quality management and information technology. And the internal functions that characterize the organization from the rest of the organizations in terms of meeting the needs of customers and their survival and maintenance as well as achieving the financial goals of owners and shareholders.
4 - growth and learning Dimension
It is the last dimension of the Balanced Scorecard. This dimension focuses on the need to meet the advantages that the organization has to make to create long-term improvements as well as the importance of future investments such as asset investments and research and development of new products. Organizations should invest in the areas of individuals, systems and procedures. Organizational Structure If you want to achieve long-term financial goals, organizations that focus on growth and learning need to have good staff systems to facilitate support and support to achieve goals without growth and learning. is able to adapt to the changing environment and to achieve this adjustment must continue In training employees on basic techniques, information systems and proficiency in meeting the requirements of renewable customers. (Obaid, 2005: 87)
Fifth: Balance in Balanced Scorecard
The label of balanced performance card for using financial and non-financial performance measures to evaluate both long and short-term performance in a unified report as well as the balance between them. The performance card was called Baltazbalat for the following reasons: - (Pliska, 2012: 24) (Obaid, 2005: 68) 1. Balance between long and short term objectives.
2 - Interested in the standards of financial performance and non-financial, as organizations that do not care about non-financial performance measures can be delayed in the overall performance indicators, balancing between financial and non-financial performance indicators.
3. Measures the current and future performance of the organization.
3656 | P a g e
https://edupediapublications.org/journals/index.php/IJR/
Available online:
With the characteristics of a balanced performance card, it will provide a comprehensive assessment of performance at all levels and levels in the organization, as well as provide the organization with the necessary information to make strategic decisions both internally and externally.
The third aspect / Applied side of the research - Application of balanced performance card to assess the performance of the bank sample research
First: Evaluating the performance of the Agricultural Bank according to the balanced Scorecard
The balanced performance card includes four main axes, each axis will include a set of quantitative measures. In order to implement the balanced performance card model on the banks, the sample of the research will be reviewed.
The financial axis: The financial axis is an important axis in the evaluation of
performance, as it represents a summary of the economic results resulting from the implementation of the strategy of the bank, and the multiplicity of financial ratios that can be used to measure the financial axis of banks, the most important of which are:
1- The Liquidity Ratio: The Bank's ability to pay its outstanding financial obligations
in the short term is measured by transferring all of its current assets to cash, through which the Bank can return the deposits to its owners at any time it is claimed. All times lead to the risk in the future as obtaining financing on difficult terms, and must not be less than 30% of the total deposits in accordance with the instructions of the Central Bank of Iraq and can be measured by the following equation:
Liquidity Ratio = Current Assets / Current Liabilities x 100
The Agricultural Bank to extract this percentage in order to meet the requirements of the Central Bank of Iraq, which obliges all banks to retain this proportion of liquidity.
3657 | P a g e
https://edupediapublications.org/journals/index.php/IJR/
Available online:
Year
Details
2013 2014 2015
Current assets 87387 2,682 ,27
Current liabilities 2226 217286 27983
Liquidity ratio (%) %36 %22 %83
Source: Preparation of the researcher based on the financial statements of the Agricultural Bank for the years 2013-2015.
Table (1) shows the liquidity ratio of the Agricultural Cooperative Bank for the years of the research sample. The Bank achieved the lowest liquidity ratio of 25% in 2014, while the highest ratio was 72.63% in 2015. In 2013, the liquidity ratio was 35.53% , Due to the realization of the bank in 2014, a low liquidity ratio required by the Central Bank of Iraq is to exclude the liquidity of the branches of the bank in the provinces because of the events that was going through the country.
The higher the liquidity ratio than the percentage determined by the Central Bank specified 30% indicate the disruption of funds with the bank, especially with regard to funding projects for the development of the agricultural sector, the closer the liquidity ratio than zero, the better proportion of the Agricultural Cooperative Bank being a specialized development banks, The higher this is, the more money will be put on hold.
2- Capital adequacy ratio: The amount of capital held by the bank in all cases
involving its capital and reserves, which should not be less than 12% of the total value of its assets, taking into account the risk element in accordance with the Banking Law No. (94) for the year 2004, and are calculated as follows:
Capital base + supporting capital
3658 | P a g e
https://edupediapublications.org/journals/index.php/IJR/
Available online:
Risk-weighted assets within and outside the budget
Table (2) Capital Adequacy Ratio Agricultural Agricultural Bank for the period (2013-2015)
(Million dinars) Year
Details
2013 2014 2015
Capital base and supporting capital 185,951,4 186 194.5
Risk-weighted assets within and
outside the budget 23228,86 36288 39288
Capital adequacy ratio (%) %89 %21 %22
Source: Preparation of the researcher based on the financial statements of the Agricultural Bank for the years 2013-2015.
It is noted in Table (2) that the highest capital adequacy ratio of the Agricultural Cooperative Bank for the years of evaluation was in 2013 at 79% and then decreased in 2014 and 2015 to 51% and 50%, respectively, despite this decrease in the capital adequacy ratio However, the adequacy of the capital of the bank did not fall below the percentage specified in the law of the banks referred to above, which is 12%, which are good ratios if compared to the targeted target specified in the Banking Act mentioned above, and maintains the Agricultural Cooperative Bank of the adequacy of capital specified for Compliance with the laws and instructions issued by the Central Bank of Iraq.
3- Monetary credit to the right of ownership: The spread of this indicator consists
of the total cash credit which represents (total loans and bank facilities), whereas the denominator represents (capital and reserves). This index can be extracted as follows:
3659 | P a g e
https://edupediapublications.org/journals/index.php/IJR/
Available online:
Table (3) Ratio of Cash Credit to Right of Ownership of the Agricultural Cooperative Bank for the Period (2013-2015)
(Million dinars)
Year
Details
2013 2014 2015
Cash Credit 63063 4.3629 4347923
Right of ownership 209598.1 109532.7 96402.1
Cash credit ratio to the right of
ownership% %18 %9 %19
Source: Preparation of the researcher based on the financial statements of the Agricultural Bank for the years 2013-2015.
Table (3) shows the ratio of cash credit to total property rights for the years of the research sample. This percentage for 2013 reached 17% and then decreased to 2014 to become 9%. The percentage for 2015 increased to 19%. Despite this increase, The credit amount of the Agricultural Cooperative Bank (ACB) has been reduced as a result of a conservative credit policy by the Bank by monetary credit.
4- The percentage of change in the funds available to the bank: The funds
available to the Agricultural Cooperative Bank (capital, reserves, loans received) as a specialized bank and table (3-54) shows the percentage of development of funds available to the Agricultural Cooperative Bank for the years of the research sample. It can be extracted through the following formula:
Funds available for the current year - funds available for the previous
year
Change rate = ×011ــــــــــــــــــــــــــــــــــــــــــــــــــــــــــــــــــــــــــــــــــــــــــــــــــــــــــــــــــــــــــــــــــــــــــــــــــــــــــــ
3660 | P a g e
https://edupediapublications.org/journals/index.php/IJR/
Available online:
Table (4) Change in funds available to the Agricultural Cooperative Bank for the period (2013-2015)
(Million dinars) Year
Details
2012 2013 2014 2015
Total money available 1,798882 191,8,83 19222789 18638783 Change in available funds% ـــــــــــــــــ %29 %2827 %7
-Source: Preparation of the researcher based on the financial statements of the Agricultural Bank for the years 2013-2015.
The year 2012 was included as a previous year to determine the percentage change in available funds for the year 2013.
It is noted from Table (4) that the highest rate of development of funds available to the Agricultural Cooperative Bank for the years of the research sample was in 2013, which amounted to 29%, due to the increase of the capital of the bank by (50) billion Iraqi dinars, and then decreased for the years 2014-2015, 0,28% and 8% respectively), which are fluctuating and are not trending towards future development. Therefore, the Bank's ability to make money available for research years is weak to contribute to agricultural and economic development.
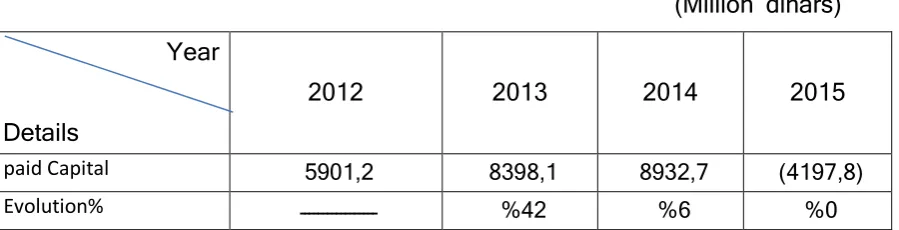
5- The percentage of development in the paid up capital: The capital paid from
the sources is the basis for financing the activity of banks in general and specialized development banks in particular. The percentage of development in the paid up capital can be extracted through the following formula:
3661 | P a g e
https://edupediapublications.org/journals/index.php/IJR/
Available online:
Evolution ratio = ــــــــــــــــــــــــــــــــــــــــــــــــــــــــــــــــــــــــــــــــــــــــــــــــــــــــــــــــــــــــــــــــــ×122
Paid up capital for the previous year
Table (5) Development of paid-up capital of the Agricultural Cooperative Bank for the period (2013-2015)
(Milli on dinars)
Year
Details
2012 2013 2014 2015
paid Capital 22622 122622 122622 122622
Evolution% ـــــــــــــــــ %99 %2 %2
Source: Preparation of the researcher based on the financial statements of the Agricultural Bank for the years 2013-2015.
The year 2012 was included as a previous year to determine the percentage change for the year 2013.
Table (5) shows the increase of the paid up capital of the Agricultural Cooperative Bank from the General Treasury of the State by 50 billion Iraqi dinars in the year 2013 to become (100600) million Iraqi dinars, and despite this increase, it is modest because it did not reach the minimum Of the capital according to the requirements of the Central Bank of Iraq, which obliged all banks to raise their capital to (250) billion Iraqi dinars, either during the years 2014 and 2015 did not occur any increase on the paid-up capital of the Agricultural Cooperative Bank, and the increase in the capital of the Agricultural Bank Cooperative is modest as the capital of specialized banks is mainly in Study Bank for its activities and grant development loans and contribute to the support and development of the agricultural sector which is the main objective of the Bank.
6- Percentage of development in reserves: The percentage of development in
3662 | P a g e
https://edupediapublications.org/journals/index.php/IJR/
Available online:
Reserves for the current year - Reserves for the previous year
Evolution rate of reserves = ـــــــــــــــــــــــــــــــــــــــــــــــــــــــــــــــــــــــــــــــــــــــــــــــــــــــــــــــ×122
Reserves for the previous year
Table (6) Development of reserves of the Agricultural Cooperative Bank for the period (2013-2015)
(Million dinars) Year
Details
2012 2013 2014 2015
paid Capital 292182 739781 793288 ),19887(
Evolution% ـــــــــــــــــ %,2 %6 %2
Source: Preparation of the researcher based on the financial statements of the Agricultural Bank for the years 2013-2015.
The year 2012 was included as a previous year to determine the percentage change for the year 2013.
Table (6) shows that the highest growth rate in the reserves of the Agricultural Cooperative Bank for the years of research was in 2013, reaching 42%, whereas in 2014 and 2015 it decreased to (6%, 0%), The bank, pointing to the weak contribution of these reserves in support of capital to meet the requirements of the Central Bank of Iraq and its weakness in contributing to economic development in general and the economic sector in particular.
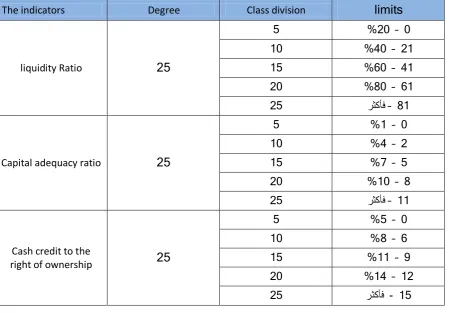
Display results for the financial axis according to the balanced scorecard
3663 | P a g e
https://edupediapublications.org/journals/index.php/IJR/
Available online:
from the criteria approved by the Central Bank of Iraq for some financial and non-financial indicators as follows:
Table (7) Distribution of ratings and upper and lower limits on the financial axis
Indicator
2013 2014 2015 Degree Indicator
limits
liquidity Ratio %36 %22 %83 22 %32 ≥
Capital adequacy ratio %28 %21 %22 22 %12 ≥
Cash credit to the right of
ownership %18 %9 %19 22 %22 – 2
Change in money available %29 %2827 %7- 22 %32-2
Development in capital %99 %2 %2 22 %122 – 2
Development in Reserves %,2 %6 %رفص 22 %22 – 2
122 Source: Preparing the researcher based on the data in the tables above.
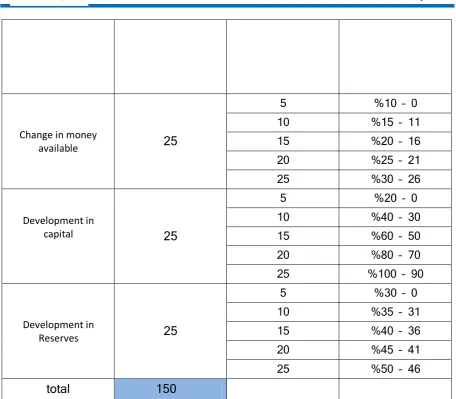
Table (8) Distribution of ratings of the indicators of the financial axis
The indicators Degree Class division limits
liquidity Ratio 25
2 %22 – 2
12 %,2 – 21
12 %62 – ,1
22 %72 – 61
22 رثكأف– 71
Capital adequacy ratio 25
2 %1 – 2
12 %, – 2
12 %8 – 2
22 %12 – 7
22 رثكأف– 11
Cash credit to the
right of ownership 25
2 %2 – 2
12 %7 – 6
12 %11 – 9
22 %1, – 12
3664 | P a g e
https://edupediapublications.org/journals/index.php/IJR/
Available online: Change in money
available 25
2 %12 – 2
12 %12 – 11
12 %22 – 16
22 %22 – 21
22 %32 – 26
Development in
capital 25
2 %22 – 2
12 %,2 – 32
12 %62 – 22
22 %72 – 82
22 %122 – 92
Development in
Reserves 25
2 %32 – 2
12 %32 – 31
12 %,2 – 36
22 %,2 – ,1
22 %22 – ,6
total 150
Source: Preparing the researcher based on the data in Table (7).
Table (9) Allocation of evaluation grades on research years for the financial axis
Indicator 2013 2014 2015
liquidity Ratio 12 12 22
Capital adequacy ratio 22 22 22
Cash credit to the right of ownership 22 12 22
Change in money available 22 2 رفص
Development in capital 22 رفص رفص
Development in Reserves 22 2 رفص
total 132 62 82
3665 | P a g e
https://edupediapublications.org/journals/index.php/IJR/
Available online:
Customer axis: The objectives of the customer base are primarily based on the
service of current and future customers. Accordingly, the customer base will include standards related to customer satisfaction, customer loyalty and acquisition of new customers, as well as improved market share. The pillars of the banking relationship The survival and continuity of the bank depends on the provision of banking services and products to them and gain their satisfaction and attention to their wishes and needs and work to achieve them, especially as these needs and desires in the evolution and change continuous and continuing, which calls for senior management in the bank to reconcile the fulfillment of these desires and need T and the objectives of the bank, and this axis set of indicators are: -
1- Percentage of change Market share: Market share is measured through the
following indicators from year to year as follows:
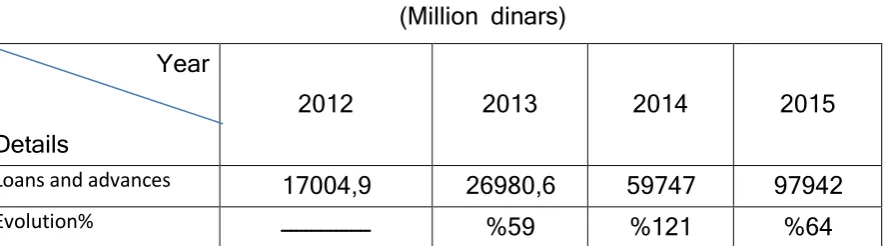
A - The rate of development in loans and advances from the bank's own
resources :: The percentage of change of loans and advances granted by the bank
is calculated from its own resources through the following formula:
Loans and advances for the current year - Loans and advances for the previous year
Rate of change = Loans and advances for the previous year
Table (10) Measuring the development of loans and advances from the bank's own resources for the period (2013-2015)
(Million dinars) Year
Details
2012 2013 2014 2015
Loans and advances 1822,89 2697286 298,8 989,2
Evolution% ــــــــــــــــــ %29 %121 %6,
3666 | P a g e
https://edupediapublications.org/journals/index.php/IJR/
Available online:
The year 2012 was included as a previous year to determine the percentage change for the year 2013.
Table (10) shows that the highest rate of development in loans and advances from the Bank's own resources was in 2014, which amounted to 121% compared with the years of evaluation of the sample. In 2013, the rate was 59%. In 2015, it was 64% Indicates that the Bank has used its own resources to provide loans and advances to the public.
B- Change in agricultural initiative loans:
Table (11) Measuring the percentage of change in the Agricultural Initiative's loans for the period (2013-2015)
(Million dinars) Year
Details
2012 2013 2014 2015
Agricultural Initiative Loans 369792 17,,6,82 672,2 1,,922 Evolution% ــــــــــــــــــ %22- %63- %111
Source: Preparation of the researcher based on the financial statements of the Agricultural Bank for the years 2013-2015.
Table (11) shows that the highest rate of development in loans from the agricultural initiative was in the year 2015, which amounted to 111% compared to the years of evaluation of the research sample because of the use of refunds of loans granted to farmers, in 2013 and 2014, % -63%), due to the slow repayment of loans by borrowers, which are a negative indicator of the bank during the evaluation years.
C- Change in insurance account for facilities
Insurance for facilities for the current year - insurance for facilities for the previous year
3667 | P a g e
https://edupediapublications.org/journals/index.php/IJR/
Available online:
Table (12) Measuring Change in Insurance Account for Agricultural Bank Facilities for the Period (2013-2015)
(Million dinars) Year
Details
2012 2013 2014 2015
Account insurance for facilities 2287 1,6881 ,389 2286 Evolution% ـــــــــــــــــ %2877 %98- %22
Source: Preparation of the researcher based on the financial statements of the Agricultural Bank for the years 2013-2015.
The year 2012 was included as a previous year to determine the percentage change for the year 2013.
Table (12) Note that the best percentage achieved by the bank during the evaluation years for the insurance account for banking facilities is the year 2013 at 2789%, but the bank has witnessed a marked decline in the rate of development in 2014 to become - 97% This is a negative indicator of the bank shows On the decline in banking facilities provided by the bank to customers, and rose in 2015 to 20%, but this rise is weak and does not indicate the adequacy of the bank in providing facilities to customers.
2- Percentage of change in media activities to attract customers:
3668 | P a g e
https://edupediapublications.org/journals/index.php/IJR/
Available online:
Table (13) shows the change in the advertising account of the Agricultural Cooperative Bank for the years of the research sample.
Table (13): Measuring the percentage of change in the account of the Agricultural Bank for the period (2013-2015)
(Million dinars) Year
Details
2012 2013 2014 2015
Account advertising 2282 2182 1,88 ,81
Evolution% ـــــــــــــــــ %2- %31- %82
-Source: Preparation of the researcher based on the financial statements of the Agricultural Bank for the years 2013-2015.
The year 2012 was included as a previous year to determine the percentage change for the year 2013.
Table 13 shows that the percentage of change in media activities achieved by the Bank during the years 2013, 2014 and 2015 is negative (-5%, -31%, -72%), The bank plays media activities that play a big role in the definition of the services provided by the bank and to attract as many customers as possible, which reflects positively on the performance of the bank.
Displaying the results of the customers' axis according to the balanced score card
3669 | P a g e
https://edupediapublications.org/journals/index.php/IJR/
Available online:
Table (14) Distribution of ratings and upper and lower limits on the customer base Sou rce: Pre pari ng the res ear che r bas ed on the data in the tables above.
Table (15) Distribution of the evaluation grades of the customer axis indicators
The indicators Degree Class division limits
Change in loans and advances
22
2 %,2 – 2
12 %62 – ,1
12 %72 – 61
22 %122 – 71
22 %122 – 121
Change in agricultural initiative loans
22
2 %32 – 2
12 %22 – 31
12 %82 – 21
22 %92 – 81
22 %112 – 91
Change in insurance account for facilities
22
2 %22 -2
12 % ,2-21
12 % 62- ,1
22 % 72-61
22 %رثكأف -71
Change in the calculation of media activities
22
2 %2 - 2
12 %, -3
12 %6 -2
22 %7 -8
22 %12- 9
Indicator
2013 2014 2015 Degree Indicator
limits
Change in loans and advances 29 121 6, 22 %122 – 2 Change in agricultural initiative loans 22- 63- 111 22 %112 – 2 Change in insurance account for facilities %2879 %98- %22 22 %122 - %2 Change in the calculation of media
activities %2- %31-
-82
% 22 %12 - %2
3670 | P a g e
https://edupediapublications.org/journals/index.php/IJR/
Available online:
total 100
Source: Preparation of the researcher based on the data of table (14).
Table (16) Allocation of grades on the research years of the customers axis
Indicator 2013 2014 2015
Change in loans and advances 12 22 12
Change in agricultural initiative loans 2 2 22 Change in insurance account for facilities 22 2 2 Change in the calculation of media
activities 2 2 2
total 32 22 ,2
Source: Preparation of the researcher based on the data of tables (14), (15).
3- Axis of internal operations: The core of the internal operations is the core
activities of the bank in order to exploit its available resources efficiently for the availability of a range of products and services that are characterized by quality and customer satisfaction.
1- Productivity index: Productivity is the result of the division of outputs on inputs
or the quantity of production in the use of many production elements, and perhaps the most important elements of production are workers as it is an important element in the success of economic institutions on the diversity and different activities, including banks, Through the lending process carried out by the Bank in order to participate in the process of economic development and expressed as follows:
Productivity = Loans granted / Number of employees × 100
Table (17) Agricultural Productivity Index for the period (2013-2015)
Year
Details
2013 2014 2015
Loans granted / million dinars 12,269 672,2 1,,922
3671 | P a g e
https://edupediapublications.org/journals/index.php/IJR/
Available online:
Source : Preparation of the researcher based on the financial statements of the Agricultural Bank for the years 2013-2015.
Table 17 shows that the highest level of productivity achieved by the Bank in 2013 was 77% and then the ratio in 2014 to 32% due to the suspension of the Agricultural Cooperative Bank from the promotion, receipt and disbursement of transactions until the availability of funding from the Ministry of Finance, The productivity rate increased to 69%, which is better than in 2014 due to the bank's use of the amounts of loans granted and disbursed for loans.
2- Index of repayment: This indicator measures the ability of the bank to recover
the money that was given to borrowers, as the greater the rate of repayment of loans granted the greater the ability of the bank to use this money to grant new loans, and can be extracted through the following formula:
Repayment ratio = Outstanding loans / Outstanding loans x 100
Table (18): Measurement of the rate of repayment of the Agricultural Cooperative Bank for the period (2013-2015)
(Million dinars) Year
Details
2013 2014 2015
Loans paid 82,2989 ,828981 2929289
Outstanding loans 17,,6,82 127,,786 926218,
Payment rate% %37 %38 %33
Source: Preparation of the researcher based on the financial statements of the Agricultural Bank for the years 2013-2015.
Table (18) shows that the highest rate of repayment of the Agricultural Cooperative Bank in 2013 was 38% and then decreased during 2014 and 2015 to 37% and
3672 | P a g e
https://edupediapublications.org/journals/index.php/IJR/
Available online:
33%, respectively, indicating a delay in repayment compared to the amounts due, as well as weak control over The process of collection of amounts due from loans.
3-Creativity: In light of the growing banking environment characterized by dynamic
and intense competition among banks, which necessitates interest in research, development and innovation in the field of business and banking services in order to achieve competitive advantage and progress on other banks and allocate the necessary resources to achieve this. Cooperative of the expenses of the software purchased for the development of banking and can calculate the percentage of creativity at the bank through the following formula:
R & D expenses for the current year - R & D expenses for the previous year
Creativity = R & D expenses for the previous year
Table (19) Measuring the Creativity Ratio of the Agricultural Cooperative Bank for the Period (2013-2015)
Year
Details
2012 2013 2014 2015
Research and development expenses 2,82 3788 ,288 2288 Creativity% ــــــــــــــــــ
ــــ %62 %17 %,,
-Source: Preparation of the researcher based on the financial statements of the Agricultural Bank for the years 2013-2015.
The year 2012 was included as a previous year to determine the percentage change for the year 2013.
3673 | P a g e
https://edupediapublications.org/journals/index.php/IJR/
Available online:
funds for research and development for the ability of the bank to compete and develop and provide advanced banking services.
4- Evolution in banking services: The development of services provided by the
bank to the public can be measured through the following accounts:
A - Change in the calculation of loans and advances: can be calculated through
the following formula:
Loans and advances for the current year - Loans and advances for the previous year
Change rate = Loans and advances for the previous year
Table (20) Measuring the Change in the Loan Account of the Agricultural Bank for the Period (2013-2015)
(Million dinars) Year
Details
2012 2013 2014 2015
Loans and advances 13218728
9
12329,68
, 123821283 16836,288
Change% ـــــــــــــــــــــــ %13 %2827 %9
Source: Preparation of the researcher based on the financial statements of the Agricultural Bank for the years 2013-2015.
The year 2012 was included as a previous year to determine the percentage change for the year 2013.
3674 | P a g e
https://edupediapublications.org/journals/index.php/IJR/
Available online:
despite Of this rise but a weak rise requires the bank to double the provision of loans and advances to customers for the development of the economic sector.
B - Development in the percentage of implementation: Through this ratio is to know the rate of implementation of the plan set by the Agricultural Cooperative Bank in relation to lending, and can be extracted this ratio through the following formula:
Implementation rate = Total loans granted / Amount allocated for lending × 100
Table (21): Measuring the implementation ratio of the Agricultural Bank for the period (2013-2015)
(Million dinars) Year
Details
2013 2014 2015
Total loans granted 12,269 672,2 1,,922
Total amount allocated for lending 271,21 23,222 22,882
Execution percentage % %,, %29 %28
Source: Preparation of the researcher based on the financial statements of the Agricultural Bank for the years 2013-2015.
In Table (21) the implementation rate was 44% for 2013, and then it decreased to 29% in 2014 due to the suspension of disbursement and the failure of the Ministry of Finance to finance the full amount of agricultural initiative loans. In 2015, the percentage increased to 57%. Of this rise, but it is modest and there are still funds not used in the granting of loans as well as the failure of the bank to be careful about the preparation of the plan for loans.
5- The percentage of front line employees: has been based on the number of
3675 | P a g e
https://edupediapublications.org/journals/index.php/IJR/
Available online:
the bank. This percentage is reached by dividing the number of frontline employees by the total number of employees of the main branch In the following formula:
Percentage of frontline workers = Number of frontline staff / number of employees x 100
Table (22) Measuring the proportion of employees in the front lines of the main branch of the Agricultural Cooperative BankFor the period (2013-2015)
Year
Details
2013 2014 2015
Number of frontline employees of the main branch 2 2 2 Number of employees in the main branch 32 36 36
Proportion of frontline staff %6 %6 %6
Source: Preparation of the researcher based on the information obtained from the main branch of the bank for the years 2012-2015.
Note from Table (22) shows that there has been no change in the percentage of employees in the front lines of the Agricultural Cooperative Bank during the years of the research sample due to the limited area of the main branch and therefore its lack of flexibility in case of increasing the demand for the services of the Agricultural Cooperative Bank.
6- The percentage of computer use: The use of computer in banking operations
indicates the extent of development and provide advanced services in the shortest possible time. The number of computers used in the main branch of the bank has been limited to the availability of information on the number of computers used in all branches of the bank. Percentage as follows:
Number of computers used for the current year - Number of computers used for the previous year
3676 | P a g e
https://edupediapublications.org/journals/index.php/IJR/
Available online:
Table (23): Measuring the computer usage rate of the Agricultural Bank for the period (2013-2015)
Year
Details
2012 2013 2014 2015
Total number of computers used in the main
branch 12 12 12 1,
Change% ـــــــــــــــــــــــ رفص %22 %18
Source: Preparation of the researcher based on information from the main branch of the bank for the years 2012 - 2015.
The year 2012 was included as a previous year to determine the rate of change in computer usage for the year 2013.
Table (23) shows that there is no growth in the computers used for 2013 compared to the evaluation years. The highest growth rate of computer usage was in 2014, which reached 20% as a result of the purchase and use of computer programs to develop the work in the bank, To 17%, but these ratios are weak, which requires more attention to the computerization of the work in the bank to reflect positively on the ability of the bank to provide services better than time, cost and quality.
Displaying the results of the internal operations axis according to the balancScore card
Based on the previous studies, the ratings will be distributed on the internal operations axis. The scores of this dimension (175) after the distribution of the scores of this axis on the indicators associated with it and determining the upper and lower limits of each index depending on the actual results reached, On the obtained criteria approved by the Central Bank of Iraq for some financial and non-financial indicators as follows:
3677 | P a g e
https://edupediapublications.org/journals/index.php/IJR/
Available online:
Indicator
2013 2014 2015 Degree Indicator
limits
Productivity %88 %32 %69 22 %72 -32
Payment %37 %38 %33 22 %,2 – 2
creativity
62
% %17
-,,
% 22 %62 – 2
Change in loans and advances %13 %2827 %9 22 %12 – 2 Change in implementation ratio %,, %29 %28 22 %62 – 22 Proportion of frontline workers %6 %6 %6 22 %12 -2 Change in the use of computers 2 %22 %18 22 %22 – 2
182 Source: Preparing the researcher based on the data in the tables above.
Table (25): Distribution of evaluation grades for the internal operations
The
indicators Degree Class division limits
Productivity
22
2 %,2 – 32
12 %22 – ,2
12 %62 – 22
22 %82 – 62
22 %72 – 82
Payment
22
2 %22 – 2
12 %22 – 21
12 %32 – 26
22 %32 – 31
22 % ,2 – 36
creativity
22
2 %22 – 2
12 %32 – 22
12 %,2 – 32
22 %22 – ,2
22 %62 – 22
Change in loans and
advances 22 2 %3 – 2
3678 | P a g e
https://edupediapublications.org/journals/index.php/IJR/
Available online:
12 %9 – 8
22 %12 – 12
22 %12 – 13
Change in
implementation ratio 22 2 %22 – 22
12 %32 – 26
12 %,2 – 36
22 %22 – ,6
22 %62 – 26
Proportion of frontline workers
22
2 %2 – 2
12 %, – 3
12 %6 – 2
22 %7 – 8
22 %12 - 9
Change in the use of computers
22
2 %, – 2
12 %7 – 2
12 %12 – 9
22 %16 – 13
22 %22 – 18
175
Source: Preparation of the researcher based on the data of Table (24).
Table (26) Allocation of grades on the research years of the internal course of operations
Indicator 2013 2014 2015
Productivity
52 2 52
Payment 52 52 52
creativity 52 2 رفص
Change in loans and advances 52 2 52
Change in implementation ratio 52 52 52
Proportion of frontline workers 52 52 52
Change in the use of computers 2 52 52
total 532 02 552
3679 | P a g e
https://edupediapublications.org/journals/index.php/IJR/
Available online:
4- Learning and Growth axis: This section shows the extent to which the
management is interested in the abilities and qualifications of employees and is working on developing them, as well as the attention to information systems, which is the nourishing artery of the decision making process, which contributes to customer satisfaction. And the development of information systems, the management of the bank will not have the ability to achieve the strategic objectives of the axis of customers and the axis of internal operations and therefore its inability to achieve the strategic objectives of the financial axis, and includes this axis on a range of measures, notably:
1- Employee Training: This indicator shows the interest of the management in this
vital aspect of activating the role of employees in the bank by providing distinguished services to customers by improving the scientific and practical capabilities of employees at all levels by motivating them to participate in training courses that help them to develop their expertise and abilities, Procedures of banking work, and are extracted through the following:
Participants in training courses = number of staff involved / total number of staff x 100
Table (27) Measuring the percentage of employees participating in training courses for the period (2013-2015)
Year
Details
2013 2014 2015
Number of employees participating in training
courses 191 312 122
Total number of employees 1629 2167 2129
Percentage of participants in training courses (%) %12 %12 %2
3680 | P a g e
https://edupediapublications.org/journals/index.php/IJR/
Available online:
Table (27) shows that there was a decrease in the number of participants in the training courses for the research years (12%, 15%, 5%), respectively. Has witnessed a number of training courses that reflect positively on the Bank by increasing the satisfaction of its employees with the Bank's interest in developing their standards, as well as the high level of performance of its staff.
2-percentage of holders of higher degrees: refers to the amount of growth in the
number of employees who have obtained higher degrees which contributes to the development of banking work, and relied on data obtained from the main branch of the difficulty of obtaining the holders of higher degrees of all branches of the Agricultural Cooperative Bank, During the following formula:
Higher degree holders to total staff = Number of employees with higher degrees / total staff x 100
Table (28) Measuring the percentage of employees of the Agricultural Cooperative Bank's higher certificates for the period (2013-2015)
Year
Details
2013 2014 2015
Number of graduates of the main branch 2 2 2
Total number of employees of the main branch 32 36 36 Percentage of holders of higher certificates% 2 2 2
Source: Preparation of the researcher based on information from the Agricultural Cooperative Bank for the years 2013-2015.
3681 | P a g e
https://edupediapublications.org/journals/index.php/IJR/
Available online:
3- Employee satisfaction: This indicator aims to identify the turnover of employees
and the extent of their reflection on the employees' satisfaction with their functions and satisfaction in the manner of management followed in dealing with them. The turnover rate of employees has been extracted to the main branch of the bank. As follows:
Turnover = number of employees leaving / total number of employees
Table (29): Measuring Employee Satisfaction with the Agricultural Cooperative Bank for the Period (2013-2015)
Year
Details
2013 2014 2015
Number of employees leaving the main branch 2 2 2 Total number of employees of the main branch 32 36 36
Employee turnover 2 2 2
Source: Preparation of the researcher based on information from the Agricultural Cooperative Bank for the years 2013-2015.
Table (29) shows that the percentage of job vacancies for the years of research is 0%. This is a good indicator of the extent of loyalty of employees to the bank and their satisfaction with the bank's services and satisfaction with management.
4- The percentage of growth in the number of branches of the bank: This
percentage shows the growth achieved by the bank and its coverage of the largest geographical area and increase its market share by increasing the number of branches through which it provides services to the public. Table 30 shows the percentage change in the number of branches of the Agricultural Cooperative Bank during the evaluation years: -
3682 | P a g e
https://edupediapublications.org/journals/index.php/IJR/
Available online:
Year
Details
2012 2013 2014 2015
Number of bank branches ,2 ,2 ,2 ,2
Change% ــــــــــــــــــــــ 2 2 2
Source: Preparation of the researcher based on the annual reports of the Agricultural Cooperative Bank for the years 2012-2015.
It is noted from Table (30) that the number of branches of the Bank during the years of the research sample has not increased, as the number of branches of the bank (42) branch, a negative indicator of the bank indicates the lack of desire to expand and cover the largest possible number of Governorates to offer their services especially as competition is severe in the banking sector.
5- From the services provided to employees: The bank's services and privileges
to its employees is a very important factor in order to win their loyalty and increase their job satisfaction, which will be reflected positively in favor of the bank, and can be measured through the following formulas:
A - Percentage change in training courses: This percentage shows the interest of
the administration to establish training courses that improve and develop the scientific and practical side of the staff, which is reflected on the quality of services they provide, and this ratio is extracted as follows:
Number of training courses for the current year - Number of training courses for the previous year
Development of training courses = Number of training courses for the previous year
Table (31): Measuring the Change in the Number of Training Courses of the Agricultural Cooperative Bank for the Period (2013-2015)
Year
Details
3683 | P a g e
https://edupediapublications.org/journals/index.php/IJR/
Available online:
Number of training courses 98 122 89 22
Change% ـــــــــــــــــــــــ %2 %23- %32
-Source: Preparation of the researcher based on information from the Agricultural Cooperative Bank for the years 2012-2015.
The year 2012 was included as a previous year to determine the percentage change in the number of training courses for the year 2013.
Table (31) shows that the highest rate achieved by the bank in the number of training courses was in 2013, which amounted to 5% compared to the years of evaluation, and then decreased to become (-23% -30%) for the year 2014 and 2015, respectively, due to lack of funds The low rate of training courses for employees is a negative indicator that the bank should take care of and seek to establish training courses to improve the abilities, skills and development of employees, which is a positive indicator for the benefit of the bank.
B- Rewards: and extracted through the following formula: -
Rewards account for the current year - rewards account for the previous year
Development of of incentive rewards = rewards account for the previous year
Table (32): Measuring the Change in the Calculation of the Agricultural Bank's Co-payments for the Period (2013-2015)
(Million Dinars) Year
Details
2012 2013 2014 2015
Account balance rewards workers 36782 7138, 13282 1,,382 Change% ـــــــــــــــــــــــ %121 %73- %962
Source: Preparation of the researcher based on the financial statements of the Agricultural Cooperative Bank for the years 2012-2015.
3684 | P a g e
https://edupediapublications.org/journals/index.php/IJR/
Available online:
Table (32) shows the rate of change in the balance of incentive bonuses granted to employees of the Bank during the years of the research sample (2013-2015). The rate of development for the year 2015 was the best in comparison with the other years, reaching 965%. - 83% negative, a negative indicator is not in favor of the bank affects the satisfaction of employees and their loyalty to the bank.
View the results of the learning curve and growth according to the balanceScorecard
Based on the previous studies, the score will be distributed on the learning and growth axis. The scores of this dimension (150) after the distribution of the scores of this axis on the indicators associated with it and determine the upper and lower limits of each index depending on the actual results reached, To the obtained criteria approved by the Central Bank of Iraq for some financial and non-financial indicators and shown in the table below:
Table (33) Distribution of assessment grades and upper and lower limits on the learning and growth axis
Indicator
2013 2014 2015 Degree Indicator
limits
Staff training %12 %12 %2 22 %12 – 2
Percentage of holders of higher certificates 2 2 2 22 %3 - 1
Employee turnover 2 2 2 22 %9 – 2
Change in the number of bank branches 2 2 2 22 نكمم ددع ربكا – 2 Change in training courses %2 %23- %32- 22 %2 – 2 Evolution rate of rewards %121 %73- %962 22 %رثكأف – 2
Total 122
Source: Preparing the researcher based on the data in the tables above.
Table (34) Distribution of evaluation grades for the learning and growth axis
The
indicators Degree Class division limits