Comparing Speech and Text Classification on ICNALE
Sergiu Nisioi
Center for Computational Linguistics, Faculty of Mathematics and Computer Science,
University of Bucharest Academiei 14, Bucaharest, Romania
Abstract
In this paper we explore and compare a speech and text classification approach on a corpus of native and non-native English speakers. We experiment on a subset of the International Corpus Network of Asian Learners of English containing the recorded speeches and the equivalent text transcriptions. Our results suggest a high correlation between the spoken and written classification results, showing that native accent is highly correlated with grammatical structures found in text.
Keywords:Native Language Identification, Accent Recognition, Learner Corpora, Text Classification
1.
Introduction
When students learn a new language, they commonly make use of the grammatical rules specific to their native lan-guage (NL) to produce utterances in the target lanlan-guage (TL). The learning process is shaped by a so-called cross-linguistic influence(Kellerman and Sharwood-Smith, 1986; Arabski, 2006) that involves not only the NL of a learner, but also additional other languages he may have acquired before TL. On one hand, this linguistic information can contribute to a better assimilation of new grammatical rules and on the other hand, it can also impede the developmental process by erroneously transferring into the TL utterances. Interlanguage is a system of grammatical rules that emerges when learners - both children and adults - express meaning in the TL (Selinker and Rutherford, 2014). It represents a complete linguistic system, covering aspects such as vocab-ulary use, morphology, phonology or syntax.
Herein we plan to investigate two aspects of interlanguage in foreign students of English: the first regards their English accent and its distinctiveness and the second one is related to the particular syntactical patterns occurring in speakers that share the same native language. In particular, we make use of the International Corpus Network of Asian Learners of English (Ishikawa, 2013)1 to train a machine learning classifier on the speeches and transcripts corresponding to students from different Asian countries. In order to clas-sify the speeches we repurpose a set of features previously used for gender and affect detection. Therefore, we estab-lish a first baseline for ICNALE on both speech and text and provide a comparative analysis between these two distinct aspects of interlanguage.
Identifying the native language (NLI) can be of crucial im-portance for a wide range of NLP applications, from train-ing better language models to more robust speech recogni-tion systems that can “comprehend” non-native speech/text and accent. Error detection and correction are also key tasks that can be improved on account of native language information. Furthermore, from a second language
acqui-1ICNALE - http://language.sakura.ne.jp/
icnale/
sition perspective, NLI tools can help consolidate previ-ous linguistic hypotheses and improve the quality of lan-guage teaching and learning: systems can help students self-evaluate and prevent them for making mistakes while teachers can track the learning process and the recurring problems more easily.
2.
Previous Work
Native language identification is a prolific research area tackled in various previous studies (Koppel et al., 2005; Brooke and Hirst, 2012). Different classification systems have been compared at the 2013 NLI Shared Task (Tetreault et al., 2013) while Nisioi (2015) claim to be able to sepa-rate between speakers based on their originating country, regardless of the native language. In addition to previous approaches, we also compare the texts with actual native utterances in order to bring additional empirical evidence regarding the interlanguage hypothesis.
1 1.5 2 2.5 3 3.5 4 4.5 5 5.5 6
speaking writing listening reading
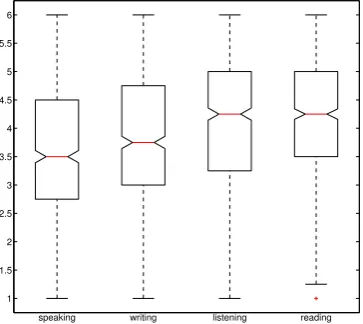
Figure 1: Box-plots of evaluation scores for the participants involved in the experiments.
3.
The International Corpus Network of
Asian Learners of English (ICNALE)
ICNALE (Ishikawa, 2013) is the result of a mutual collab-oration to produce a high quality learner corpus to research the cross-linguistic influences present in the English inter-language of speakers from the Asian continent.
In our work, we use a subset of the ICNALE-spoken (Ishikawa, 2014) that contains native recordings of students from English-speaking countries labeled as ENS and au-dio files of students (males and females) from Philippine (PHL), Japan (JPN), Taiwan (TWN), People’s Republic of China (CHN), Indonesia (IDN), Pakistan (PAK) and Singa-pore (SIN). We have selected only spoken samples on the same topic - students being asked to discuss the importance of having a part time job.
Figure 1 contains the box-plots of the proficiency levels in speech, writing, listening and reading which are scored with doubles from one to six points. Therefore, the average performance of English production is around 3.5 for both speaking and writing with no significant outliers found in the dataset. For listening and reading, the average scores were higher - students being able to understand the lan-guage better than to actually speak it. The values are col-lected only for non-native speakers, indicating a medium speech proficiency.
Speaker’s gender is not evenly distributed - the number of female participants is larger - 410, compared to the male participants - 314. In addition, a brief analysis of the avail-able transcripts for each speech reveals the existence of un-clear audio portions corresponding to each class: 27 from China, 16 from Taiwan, 12 from Indonesia, 11 from Sin-gapore and 9 from all the rest together (including native speech). The average length of each recording is around 110.45 words.
Finally, to classify our speech data, we split each file into chunks of two seconds using SoX (Sound eXchange) tool. This allows the creation of a large and varied sample of training examples for each class corresponding to different native languages. We consider the two second segments be-cause they cover two or more syllables, which is sufficient for the classifier to predict the native accent.
4.
Speech and Text Classification
Classifier. We use a linear L1-regularized L2-loss support vector classification machine (Fan et al., 2008) in combina-tion with grid search for best parameter seleccombina-tion. The basic form of the classifier for some given examplesxi∈Rnand
binary targetsyi={−1,+1}, can be briefly expressed as:
min
w f(w)≡ kwk1+C
X
i∈I(w)
bi(w)2 (1)
where k · k1 is the l1 norm, kwk1 is a regularization term and C > 0 is a weighting factor that we approxi-mate through cross-validation. Thel2loss is expressed as
bi(w)≡1−yiwTxiandI(w)≡ {i|bi(w)>0}is the set
of indices corresponding to positive loss for each example. This sum of losses does not have a second order derivative, so in order to solve the optimization problem for this clas-sifier, we use the generalized second order derivative or a small positive value if the derivative is zero. Yuan et al. (2010) study the efficiency in terms of both convergence time and classification accuracy for this approach, suggest-ing that the main advantage relies in the possibility to use this classifier for large amounts of data.
For our data, we traink∗(k−1)/2classifiers in a pairwise fashion for each two native language pairs. This approach resembles a multi-class classifier (Wu et al., 2004) and al-lows us to make comparisons between individual English accents. The same approach is used on both text and speech classification experiments and the results are obtained with ten fold cross-validations for each individual experiment.
Speech features. We classify the data regardless of the speaker’s gender or individual proficiency level. To clas-sify between different non-native accents, we repurpose the features indicated for the INTERSPEECH 2010 Paralin-guistic Challenge (Schuller et al., 2010). These features were initially designed to be used for gender, age or affect detection. They count 1 582 acoustic features and translit-eration (including non-linguistic features), among with 21 functionals and 38 low-level descriptors (with regression coefficients) extracted by simple moving average low-pass filtering. These features cover important aspects related to intonation and pronunciation for English language learners. The extractor is based on openSMILE2 which can be
con-figured to return the features mentioned previously.
Text features. In order to classify texts, we use function words (Koppel and Ordan, 2011) - conjunctions, preposi-tions, determiners, particles, pronouns, etc. These words are used unconsciously to tie sentences and create mean-ing; they reveal syntactic constructs and are often used in native language identification or general text classification tasks (Brooke and Hirst, 2012; Nisioi, 2015). Each text document is represented as a vector of weighted function words. We use the log-entropy weighting method, encoun-tered in latent semantic indexing (Landauer et al., 2013) to reduce the importance of high frequency features and in-crease the weights for the ones that are good discriminants between documents (Jarvis et al., 2012). We compute the
2
Language
pairs ENS CHN TWN SIN IDN PHL JPN PAK
ENS 0.0 78.31 85.77 80.44 87.06 86.81 99.14 90.29 CHN 87.06 0.0 79.69 82.46 82.62 88.08 99.33 91.87 TWN 87.06 84.57 0.0 80.71 79.83 87.21 99.12 90.66 SIN 76.61 90.54 90.54 0.0 84.89 82.37 99.58 90.89 IDN 90.04 83.08 80.59 92.03 0.0 87.37 99.29 91.16 PHL 85.57 87.56 81.09 79.60 86.56 0.0 99.18 90.35 JPN 93.53 88.55 87.56 98.01 88.05 91.04 0.0 97.95 PAK 87.56 90.04 93.53 90.04 89.55 84.57 94.02 0.0
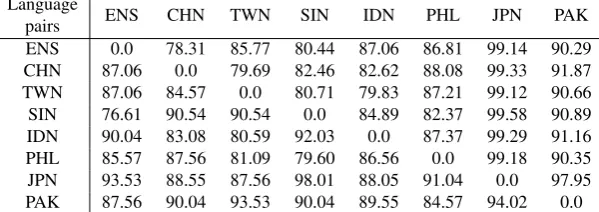
Table 1: Speech classification results: for each row, we present the accuracy of correctly classified speakers in a pairwise classification setup.
Language
pairs ENS CHN TWN SIN IDN PHL JPN PAK
ENS 0.0 88.00 86.14 78.22 90.10 86.14 94.06 89.11 CHN 86.14 0.0 82.18 89.11 82.18 88.12 86.14 92.08 TWN 88.00 87.00 0.0 90.00 82.00 76.00 85.00 94.00 SIN 75.00 92.00 91.09 0.0 92.00 81.00 98.00 89.00 IDN 90.00 84.00 79.21 92.08 0.0 82.18 86.14 87.13 PHL 85.00 87.00 86.14 78.22 91.00 0.0 91.00 86.00 JPN 93.00 91.00 90.10 98.02 90.00 91.09 0.0 93.07 PAK 86.00 88.00 93.07 91.09 92.00 83.17 95.00 0.0
Table 2: Text classification results: for each row, we present the accuracy of correctly classified texts in a pairwise classifi-cation setup.
entropy for a featureiby the following formula:
gi= 1 +
N X
j=1
pijlog 1 +pij
logN (2)
whereN is the number of examples in the corpus andpijis
defined by the normalized frequency of wordiin example
j.
To normalize thepij values, we divide by the global
fre-quency in the corpus, defined as:
gfi =
N X
j=1 tfij
in consequence, the value ofpijbecomes:pij=
tfij
gfi.
The final weight of a feature is computed by multiplying the entropy with the log weight:
logentij =gilog(tfij+ 1) (3)
4.1.
Results
Thespeechclassification results for ICNALE are rendered in Table 1 and the corresponding results on the transcrip-tions are available in Table 2. For each native language on each row, we provide the percentage of correct classifi-cations against examples from the column, e.g. row ENS column SIN in Table 2 indicate that 78.22% of the native English examples are correctly classified. This also means that the remaining examples (21.78%) are missclassified as Singaporean. Such a high error rate can be attributed to the fact that English is an official language in Singapore which can facilitate the acquisition process. In addition to this, the percentage of correctly classified ENS vs. SIN
examples for speech (Table 1) is higher, possibly because Singaporean English developed a particular system of pro-nunciation (Kortmann et al., 2004) which makes it more distinguishable versus native speakers.
Given the results in Table 1 and Table 2, one can observe that native English speakers (ENS) can be classified with reasonable accuracies on both speech and text. We consider remarkable the fact that Mandarin native speakers from China and Taiwan are also correctly classified. This result is in accordance with previous research on native language identification (Nisioi, 2015) that claims to distinguish be-tween speakers of the same native language from different geographical areas. Learners when speaking a foreign lan-guage are not only influenced by the linguistic structures of the native language, but also by the actual learning curric-ula they are following, the interaction with foreign speakers or even sociocultural factors (Howard and Jane L., 1982; Giles et al., 1977) that are specific to the region in which they study. We are aware, however that People’s Republic of China has within its borders a larger degree of dialec-tal and linguistic variation than Taiwan. Last but not least, Japanese speakers present a strong pattern that differentiate them from all the other English speakers with high accura-cies - 93.53% against spoken and 93% against written na-tive English. Students from Pakistan also exhibit larger dif-ferences in both written and oral versions of the speeches.
non-native varieties of a language when compared to multi-label approaches.
4.2.
Pearson correlation
We have classified both the speeches and the correspond-ing transcriptions, but we are also interested to observe in what degree the two results are similar to each other. In this subsection we address this question. Therefore, we make use of the Pearson correlation as a measure of similarity between the vectors corresponding to each native language in each row.
Pearson’s correlation ρ ∈ [−1,1]measures the degree of dependence between two vectorsX ={xi}andY ={yi}
of sizenand has the following formula:
ρ= P
i(xi−x¯)(yi−y¯)
pP
i(xi−x¯)2
P
i(yi−y¯)2
(4)
wherex¯andy¯are the sample mean of X and Y, respectively. We linearize the values in Table 1 and Table 2 to obtain a value of ρ = 0.9889, signifying a high degree of pos-itive correlation between the results. In addition, we are interested to observe which particular native languages are not correlated in terms of classification accuracy. Figure 2 contains the values computed for the individual rows corresponding to each native language. One important
ENS CHN TWN SIN IDN PHL JPN PAK
0.96 0.97 0.98 0.99 1
Figure 2: Pearson correlation between speech and text per-centages of the correctly classified documents
observation arises from this figure - Taiwanese speakers present the least amount of correlation (0.9686) between speech and text results. In addition, we observed that the speeches are better correlated than the texts, in particular for speakers from Taiwan and China:ρtext(CHN,TWN)< ρspeech(CHN,TWN). A result that can be confirmed by the
fact that Chinese and Taiwanese speakers share similar ac-cents in English, but the text versions are less similar to each other. This assumption is also confirmed by Table 1 where only 79.69% of Chinese speakers are correctly clas-sified and Table 2, where the text classification accuracies are higher.
5.
Conclusions
We present a speech-text classification comparison us-ing data from the International Corpus Network of Asian Learners of English3, a novel corpus that is further extended
and developed. For speech classification, we have repur-posed a set of acoustic, not necessarily linguistic, features with the aim to distinguish between pairs of different na-tive accents. Compared to other such attempts (see Sec-tion 2.), we proposed a simpler classifier based on a lin-ear L1-regularized L2-loss support vector machine which proved to be effective in both of our experiments. The re-sults indicate that a pair-wise multi-class classifier can po-tentially perform better than multi-label classifiers on our dataset. Furthermore, our speech classification results in Table 1 demonstrate both the efficiency of this approach and the fact that only two seconds of speech are required to extract certain phonological marks that uncover the native language of a speaker.
For text classification, we employ the log-entropy weight-ing of function words since these types of features are (as much as possible) independent to the topic of the writing. The classification results in Table 2 further suggest that dis-tinctive patterns are encountered in the utterances of non-native learners, patterns that can be traced through a per-son’s use of function words and applied to distinguish the speakers based on their native tongue.
In addition to existing studies on interlanguage and accent varieties, we investigate the connection between the classi-fication results of the spoken and written datasets. In this matter, we notice a high correlation between the two sets of results - a fact that validates them from both computational and linguistic perspectives. Last but not least, we note that additional linguistic and social variables can be involved when differences emerge between speakers of the same na-tive language, e.g. the Mandarin dialect from China and Taiwan. These difference can be explained by the various linguistic backgrounds (Nisioi, 2015) of the speakers. We are aware, however, that a thorough analysis would be nec-essary to investigate the relations that emerge between dif-ferent speakers of related mother tongues, analysis which we plan to approach in our future work.
6.
Bibliographical References
Arabski, J. (2006). Cross-linguistic Influences in the Sec-ond Language Lexicon. SecSec-ond language acquisition. Multilingual Matters.
Arslan, L. M. and Hansen, J. H. L. (1996). Language ac-cent classification in american english. Speech Commu-nication, 18(4):353–367.
Brooke, J. and Hirst, G. (2012). Robust, Lexicalized Na-tive Language Identification. InProceedings of COLING 2012, pages 391–408, Mumbai, India, December. The COLING 2012 Organizing Committee.
Deshpande, S., Chikkerur, S., and Govindaraju, V. (2005). Accent classification in speech. InAutomatic Identifica-tion Advanced Technologies, 2005. Fourth IEEE Work-shop on, pages 139–143, Oct.
3Additional resources used in these experiments are available
Fan, R.-E., Chang, K.-W., Hsieh, C.-J., Wang, X.-R., and Lin, C.-J. (2008). Liblinear: A library for large linear classification.J. Mach. Learn. Res., 9:1871–1874, June. Giles, H., Bourhis, R. Y., and Taylor, D. M. (1977). To-wards a theory of language in ethnic group relations. Language, ethnicity and intergroup relations, 307348. Howard, G. and Jane L., B. (1982). An intergroup
ap-proach to second language acquisition. Journal of Mul-tilingual and Multicultural Development, 3(1):17–40. Ishikawa, S. (2013). The icnale and sophisticated
con-trastive interlanguage analysis of asian learners of en-glish. Learner corpus studies in Asia and the world, 1:91–118.
Jarvis, S., Casta˜neda-Jim´enez, G., and Nielsen, R. (2012). Detecting L2 Writers’ L1s on the Basis of Their Lexical Styles. In Scott Jarvis et al., editors,Approaching Lan-guage Transfer through Text Classification, pages 34–70. Multilingual Matters.
Kat, L. W. and Fung, P. (1999). Fast accent identification and accented speech recognition. InAcoustics, Speech, and Signal Processing, 1999. Proceedings., 1999 IEEE International Conference on, volume 1, pages 221–224. IEEE.
Kellerman, E. and Sharwood-Smith, M. (1986). Crosslin-guistic Influence in Second Language Acquisition. Lan-guage Teaching Methodology Series. Pearson College Division.
Koppel, M. and Ordan, N. (2011). Translationese and its dialects. In Proceedings of the 49th Annual Meet-ing of the Association for Computational LMeet-inguistics: Human Language Technologies-Volume 1, pages 1318– 1326. Association for Computational Linguistics. Koppel, M., Schler, J., and Zigdon, K. (2005).
Determin-ing an author’s native language by minDetermin-ing a text for er-rors. InProceedings of the eleventh ACM SIGKDD in-ternational conference on Knowledge discovery in data mining, pages 624–628, Chicago, IL. ACM.
Kortmann, B., Schneider, E. W., Burridge, K., Mesthrie, R., and Upton, C. (2004). A handbook of varieties of English: a multimedia reference tool. Walter de Gruyter. Landauer, T., McNamara, D., Dennis, S., and Kintsch, W. (2013). Handbook of Latent Semantic Analysis. Taylor and Francis.
Lopes, J., Trancoso, I., and Abad, A. (2011). A nativeness classifier for ted talks. InAcoustics, Speech and Signal Processing (ICASSP), 2011 IEEE International Confer-ence on, pages 5672–5675. IEEE.
Ma, Z. and Fokou´e, E. (2014). A comparison of classifiers in performing speaker accent recognition using mfccs. Open Journal of Statistics, 4(04):258.
Nisioi, S. (2015). Feature analysis for native language identification. In Alexander F. Gelbukh, editor, Computational Linguistics and Intelligent Text Processing -16th International Conference, CICLing 2015, Cairo, Egypt, Proceedings, Lecture Notes in Computer Science. Springer.
Schuller, B., Steidl, S., Batliner, A., Burkhardt, F., Dev-illers, L., M¨uller, C. A., and Narayanan, S. S. (2010).
The interspeech 2010 paralinguistic challenge. In IN-TERSPEECH, pages 2794–2797.
Selinker, L. and Rutherford, W. (2014). Rediscovering In-terlanguage. Applied Linguistics and Language Study. Routledge.
Teixeira, C., Trancoso, I., and Serralheiro, A. (1996). Ac-cent identification. In Spoken Language, 1996. ICSLP 96. Proceedings., Fourth International Conference on, volume 3, pages 1784–1787. IEEE.
Tetreault, J., Blanchard, D., and Cahill, A. (2013). A report on the first native language identification shared task. In Proceedings of the Eighth Workshop on Innovative Use of NLP for Building Educational Applications, Atlanta, GA, USA, June. Association for Computational Linguis-tics.
Witt, S. M. and Young, S. J. (1997). Language learning based on non-native speech recognition. InFifth Euro-pean Conference on Speech Communication and Tech-nology, EUROSPEECH 1997, Rhodes, Greece, Septem-ber 22-25, 1997.
Wu, T.-F., Lin, C.-J., and Weng, R. C. (2004). Probabil-ity estimates for multi-class classification by pairwise coupling. The Journal of Machine Learning Research, 5:975–1005.
Yuan, G.-X., Chang, K.-W., Hsieh, C.-J., and Lin, C.-J. (2010). A comparison of optimization methods and soft-ware for large-scale l1-regularized linear classification. The Journal of Machine Learning Research, 11:3183– 3234.
7.
Language Resource References
Ishikawa, Shinichiro. (2013). The ICNALE andsophisti-cated contrastive interlanguage analysis of Asian learn-ers of English. Kobe Univlearn-ersity, Learner Corpus Studies in Asia and the World.