Textual complexity as a predictor of difficulty of listening items in
language proficiency tests
Anastassia Loukina, Su-Youn Yoon,
Jennifer Sakano, Youhua Wei, Kathleen M. Sheehan
Educational Testing Service 660 Rosedale Road, Princeton, NJ 08541, USA
{aloukina,syoon,jsakano,ywei,ksheehan}@ets.org
Abstract
In this paper we explore to what extent the difficulty of listening items in an English language proficiency test can be predicted by the textual properties of the item text. We show that a system based on multiple text complexity features can predict item difficulty for several different item types and for some items achieves higher accuracy than human estimates of item difficulty.
1 Introduction
Many language proficiency tests measuring listening or reading comprehension consist of multiple ques-tions or “items” of varying complexity. For simpler items, finding the correct answer may be easy even for relatively low-proficiency speakers while other, more difficult, items require higher levels of profi-ciency. In addition, multiple sets of items or “forms” are usually created for large-scale language tests to reduce the possibility that the test takers are already familiar with a particular item. In order to be fair to all test takers, such forms need to be comparable in terms of difficulty of the items they contain. Therefore item difficulty is a crucial parameter for every new item added to the test. In test theory, item difficulty is defined by the proportion of the test takers who answer the item correctly (Holland and Thayer, 1985). This value can be estimated empirically by a pilot study before the item is used in an actual test. However, reliable estimates of item difficulty require a substantial amount of test taker re-sponses. There are also concerns about item exposure, especially if an item is to be used in a high-stakes test.
In this study we consider an automated system for item difficulty prediction that can help obtain quick estimates of item difficulty for new items and assist test developers in creating items of varying complexity while retaining form comparability. The novel contribution of this study is the application of the state-of-the-art findings related to predicting the difficulty of spoken texts to predicting the difficulty of listening items in a language proficiency test.
Listening comprehension items often consist of a recorded passage followed by a printed or recorded multiple choice question related to this passage. Several studies have investigated the factors that affect the difficulty of such listening and reading test items. Previous work on item difficulty prediction (Boldt and Freedle, 1996; Freedle and Kostin, 1996; Nissan et al., 1995; Rupp et al., 2001) identified three types of variables that affect item difficulty. The first category are the variables related to the text such as its length or information density. The second group of variables consider various properties of the question, for example, the number of negatives in correct and incorrect responses (“distractors”) to the question or lexical overlap between the correct and incorrect responses. Finally, the last group of variables considers interaction between the text and the question, for example, what kind of information a test taker needs to extract from the text to provide the correct answer. In these studies a relatively small number of features from all of these groups were moderately predictive of item difficulty with an R2 around 0.3. More
recently, Hoshino and Nakagawa (2010), Susanti et al. (2016), and Beinborn et al. (2014) developed item difficulty prediction systems for other types of items such as those contained in Cloze tests or vocabulary tests. They used features that assess (a) the difficulty of a passage, (b) the difficulty of a correct answer, This work is licensed under a Creative Commons Attribution 4.0 International License. License details: http:// creativecommons.org/licenses/by/4.0/
and (c) the similarity between the correct answer and the distractors, but the detailed implementation of features and the performance in predicting item difficulty substantially varied across different studies. These studies were also conducted on relatively small numbers of items and test takers.
While previous studies found that all three categories of features were predictive of item difficulty, many of the features were designed for particular item types and therefore required new features to be developed for new item types. In this study, we use a large corpus of items to investigate whether item difficulty can be estimated using a large pool of more general text complexity features that can be applicable across a wide range of items. In contrast to previous studies such as Beinborn et al. (2014), which were generally limited to items comprised of short texts, some item-types in this study assess the understanding of relatively long texts, and this further motivates our use of generic text complexity features in the item difficulty prediction.
Compared to the relatively limited number of studies on item difficulty, there exists extensive research on the factors that affect ESL reading and listening comprehension as well as automated text difficulty prediction systems for spoken and written texts. Mature automated text difficulty prediction systems (Landauer et al., 1998; Sheehan et al., 2013) are already available and have been used operationally to evaluate reading materials selected for use in instruction and assessment. For listening materials, a comprehensive list of features known to affect a spoken text difficulty has been recently provided by Bloomfield et al. (2010) who classified these features along four dimensions: length, complexity, organization, and auditory features. Moreover, many studies explored individual features. Thus syntactic complexity and vocabulary difficulty features have been found to have a strong and consistent effect on reading and listening comprehension (Blau, 1990; Nissan et al., 1995). For the auditory dimension, speaker accent, disfluencies, audio quality (background noise), and speaking rate were found as important factors (Blau, 1990; Brindley and Slatyer, 2002). Based on these findings, Kotani et al. (2014) and Yoon et al. (2016) developed fully automated spoken text difficulty prediction systems and reported promising performances.
Of the four dimensions identified by Bloomfield et al. (2010), the auditory dimension of the items in this study was generally held almost constant since acoustic characteristics such as speaker accent, speaking rate, and audio quality were closely monitored during the original recording. As a result, they were very homogenous. Therefore, we focused on the first three dimensions: length, complexity and organization of the item text, and we explored whether these can predict item difficulty as measured empirically.
This study focuses on the following aspects:
• We use a set of generic text complexity features for four largely different item-types.
• We use a large set of items with an objective item difficulty index estimated by students’ perfor-mance from a large scale language proficiency test.
• We provide further insight about the relationship between item difficulties and passage difficulties.
2 Data and methodology 2.1 Corpus of listening items
We used a large collection of listening items from an international English language proficiency test. The corpus comprised four types of multiple choice items listed here in increasing order of complexity:
• Picture description (PD): Test takers are presented with a picture and four recorded statements. Their task is to select the statement that best describes the given picture.
• Dialogue completion (DC): Test takers hear a question or a statement and several possible responses. Their task is to choose which response is the most appropriate.
• Monologue (M): Test takers listen to a recording of a monologue (e.g., announcement or advertise-ment) and answer a series of printed questions about the content of the recording.
Compared toPDandDC, theCandMitems have a more complex structure. For these two item types the items are clustered into testlets or sets with three items per testlet. All items in the same testlet refer to a common listening passage (conversation or monologue). The listening passages inC andMitems are also much longer than inPDandDCitems; the number of words ranged from 41 to 174 and the mean was 97.17. Cand Mitem are further classified into gist items that assess understanding of the central idea and detail items that assess understanding of details.
The total number of items used in this study is presented in Table 1. The items were included in 154 operational test forms administered from 2009 to 2013 to two groups of test takers referred to hereafter as Group A and Group B. Both groups included English language learners, but the two groups took test in different countries. The number of test takers for each admin was around 30,000 on average, and the minimum number of test takers was 3,599.
Group Total PD DC C M
Group A 5092 520 1569 1501 1502
Group B 6436 671 2011 1872 1882
Both 1694 165 511 504 514
Total 9834 1026 3069 2869 2870
Table 1: The number of items of different types across the two populations
2.2 Item difficulty indicators 2.2.1 EQDelta
The difficulty of each item was estimated by delta. It is computed by Eq. 1,
∆ = 13−4Zp (1)
wherepis the proportion of the test taker population who answered the item correctly andZpis theZ value corresponding to a givenpvalue in the standard normal distribution (Holland and Thayer, 1985).
Thus on the delta scale, the higher delta values denote more difficult items. In the testing program, the observed deltas obtained from different test forms were equated to a common scale, so that the equated deltas can be compared across test forms. These empirically obtained equated deltas (”EQDelta”) were used as a response variable in our study.
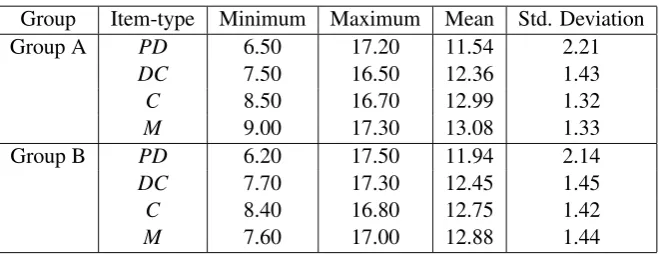
The descriptive statistics of item difficulty are shown in Table 2. The means of different item-types ranged from11.54to13.08.
Group Item-type Minimum Maximum Mean Std. Deviation
Group A PD 6.50 17.20 11.54 2.21
DC 7.50 16.50 12.36 1.43
C 8.50 16.70 12.99 1.32
M 9.00 17.30 13.08 1.33
Group B PD 6.20 17.50 11.94 2.14
DC 7.70 17.30 12.45 1.45
C 8.40 16.80 12.75 1.42
[image:3.595.135.465.613.740.2]M 7.60 17.00 12.88 1.44
2.2.2 Item sequence
The Equated Deltas can only be computed after the item has been administered to a certain number of test takers. When creating new items, test developers rely on their experience and prior understanding of item difficulty drivers to vary the difficulty of the items. This predicted difficulty is generally used to sequence the items within each form in increasing order of difficulty. Note that the relationship between the item sequence and item difficulty is less direct forCandMitems where several items are combined in sets. In this case the placing of the items in the form are determined by the overall difficulty of the whole set and therefore item order is a less useful indicator of the perceived difficulty of individual items within each set. Nonetheless in the absence of other criteria, item sequence can be used as a proxy for expert human estimate of item difficulty, a useful benchmark for the automated system for item difficulty prediction.
2.3 Text complexity features
In order to obtain text features, we used an automated text complexity prediction system, TextEvalu-ator (Sheehan et al., 2013; Sheehan et al., 2014; Napolitano et al., 2015). TextEvaluator is a fully automated system which was created to assess the complexity of reading passages for both native and non-native speakers including the complexity of reading items in English Language proficiency tests (Chen et al., 2015).
TextEvaluatorgenerates 339 raw features based on vocabulary lists and various NLP technologies such as tagging and automated parsing. The features were designed to measure the degree of complexity along the four dimensions: vocabulary, syntax, cohesion, and discourse. These features can be categorized into the follow subgroups:
• Academic Vocabulary (vocabulary): features in this dimension measure the proportion of academic vocabulary in the text. e.g., the frequency of academic words normalized by text length
• Concreteness (vocabulary): features in this dimension measure the degree of concreteness of the text by aggregating concreteness rating of each word in the text.
• Word unfamiliarity (vocabulary): features in this dimension measure the difficulty of vocabulary used in the text. e.g., the frequency of rare words normalized by text length
• Syntactic Complexity (syntax): features in this dimension measure the complexity of grammatical structures used in the text. e.g., the average frequency of long sentences, and average number of words per sentence.
• Cohesion (cohesion): this dimension includes two different types of features (cohesion): frequency of content word overlap and frequency of casual conjuncts.
• Argumentations (cohesion): this dimension includes two features: the frequency of concessive and adversative conjuncts
• Conversational style (discourse): features in this dimension measure the proportion of words related to conversational text (e.g., conversational verbs, communication verbs, and contractions)
• Degree of narrativity (discourse): features in this dimension calculate the frequency of expressions related to narrativity (e.g., frequency of past tense verbs and frequency of 3rd person singular pro-nouns.)
TextEvaluator analyzed the features of the entire item: the audio, the question, and the options for item types PD and DC. For item types C and M, which consist of an audio stimulus share between the three items and 3 items consisting of a question related to this stimulus and possible responses,
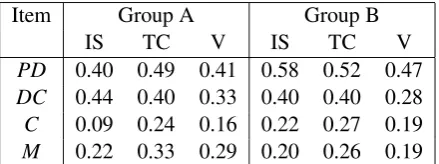
Item Group A Group B
IS TC V IS TC V
PD 0.40 0.49 0.41 0.58 0.52 0.47
DC 0.44 0.40 0.33 0.40 0.40 0.28
C 0.09 0.24 0.16 0.22 0.27 0.19
[image:5.595.190.410.64.146.2]M 0.22 0.33 0.29 0.20 0.26 0.19
Table 3: Model performance (Pearson’s r between predicted and observed EQDelta) based on item sequence (IS), all text complexity features (TC) and vocabulary features only (V) for two populations of test takers
2.4 Experiment design
The goal of the experiment was to evaluate how well TextEvaluator features can predict EQDelta for each item. For a benchmark we used the system which predicts the EQDelta based on a single feature: the position in which the item appears in the form, which to some degree reflects the estimate of item complexity assigned to the item by test developers1.
We built separate models for each of the two populations and four different item types. ForC and
Mitems, which consisted of both recorded propmt and printed questions, we trained 3 types of models: the complexity of a recorded passage only, the complexity of printed questions only, and both sets of features.
For each group, the data were randomly split into training (50%), development (25%) and evaluation (25%) partitions. ForC and Mitems the partitions were created so that the items related to the same stimulus were always in the same partition. The models were trained on the training set, fine-tuned using evaluations on the development set and finally evaluated on held-out evaluation set.
We used 9 regressors available via SKLL package (Blanchard et al., 2016) to map either the item sequence or the text complexity features to the EQDelta. These included ordinary least squares linear regression, LASSO regression, decision tree regression, elastic net, k-neighbours regression, stochastic gradient descent regression, linear and non-linear support vector regressions and random forest regres-sion. The model performance was evaluated by correlation between predicted and observed EQDelta on new data.
3 Results
The analysis of model performance on the development set showed that forTextEvaluator features ran-dom forest regressor consistently outperformed other learners. All classifiers produced similar results for the benchmark system based on item sequence. Therefore for consistency we used random forest regressor for both benchmark and complexity-based models.
3.1 Item sequence benchmark
The dependency between item sequence and its empirically established difficulty varied between the item types (see Table 3). Item sequence was the strongest predictor of item difficulty for the two simpler items,PDandDC, withrvarying between 0.40 and 0.58. As expected, the performance was noticeably lower forCandM(rbetween 0.09 and 0.22) since these items are combined into sets and sequenced by the overall difficulty of the sets. These patterns were observed for both populations.
3.2 Text complexity
We first looked at the performance of the models based on text complexity of the whole item presented to the test taker. ForPDandDCthe complexity features were computed on the script of the recorded item text. For items Cand Mthese models contained features computed for the recorded passage and printed questions.
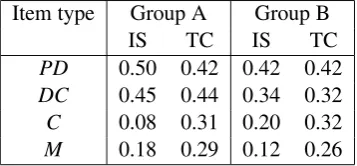
Item type Group A Group B
IS TC IS TC
PD 0.50 0.42 0.42 0.42
DC 0.45 0.44 0.34 0.32
C 0.08 0.31 0.20 0.32
[image:6.595.210.389.65.148.2]M 0.18 0.29 0.12 0.26
Table 4: Model performance (Pearson’s r between predicted and observed EQDelta) based on item sequence (IS) and Text complexity (TC) on the held-out evaluation set
The performance of the complexity-based models generally followed the same pattern as was previ-ously observed for sequence-based models: the correlation between predicted and observed items de-creased from simpler to more complex items withraround 0.4-0.5 forPDitems andraround 0.24-0.33 forMandC.
When compared to human benchmark, forPD and DC items the models based on text complexity produced similar results. At the same time, the complexity of the text for Cand Mitems was a better predictor of item difficulty than the item sequence benchmark.
In order to further investigate the relationship between item type and item difficulty prediction, we analyzed the distribution of EQDelta using training data partition.
If EQDelta was not normally distributed for a certain item type (e.g., with a skew towards easy or difficult items), it may have increased the difficulty of the automated prediction and decreased the corre-lation between predicted difficulty and EQDelta. However, we did not find such tendency; all item types showed a normal distribution. We also found that EQDeltas for PDitem type were more widely dis-tributed than other items. The standard deviation was approximately 1.4times greater than for the other item types. This wider distribution of EQDeltas may contribute to higher performance of the automated system forPDitem type.
Finally, we explored what features contributed most to the final prediction by computing the variable importance for each feature (Breiman, 2001). We found that for all item types the most highly ranked features were related to the lexical content of the item text. These 26 features covered three aspects of vocabulary: first, vocabulary diversity measured as type-to-token ratio in item text. Second, the difficulty of vocabulary in the item text as measured by the frequency of the words in different corpora; Third, the concreteness and imageability of the text (Sheehan et al., 2013). Table 3 shows the performance of all models considered in this study.
3.3 Model performance on the evaluation set
Our analysis of system performance on the development set reported in the previous sections showed the best performance was achieved by the system based on all text complexity features and random forest regressor. We therefore evaluated the performance of these final models on the held-out evaluation set that had not been used for any other analyses.
The results were consistent with what was observed on the development set. These are presented in Table 4.
3.4 Comparison between recorded and printed parts of the item
Two types of items in our study, C and M, consisted of a listening passage shared between different items within a testlet and printed questions unique for each item. For these two item types we compared performance of text complexity features computed on different parts of the items. CandM items infer the test takers’ understanding of the listening passage. Therefore we initially hypothesized that the text complexity of a common listening passage would be a strong predictor of the item difficulty. However, the empirical results did not support this.
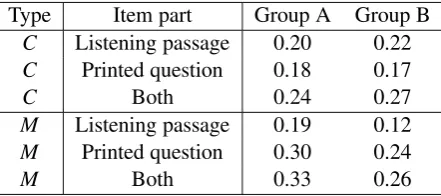
combining the two parts of the items. At the same time forMitems the performance of the model based on the listening passage was substantially lower than that of the model based on the printed question. There also was only a very little improvement when the listening passage was added to printed question. These results are presented in Table 5.
Type Item part Group A Group B
C Listening passage 0.20 0.22
C Printed question 0.18 0.17
C Both 0.24 0.27
M Listening passage 0.19 0.12
M Printed question 0.30 0.24
[image:7.595.189.410.129.227.2]M Both 0.33 0.26
Table 5: Baseline performance (Pearson’sr) for models based on different parts of complex items
4 Discussion
In this paper we explored to what extent the text complexity of the item text can be used to predict item difficulty. We compared text complexity-based prediction system to the benchmark system based on item sequence, which we treated as an indication of test developer intuition about item difficulty.
As expected, the benchmark model based on item sequence (experts’ judgements) performed worse for Cand M items than for PDand DC items. As discussed earlier, the former are grouped into sets and are not sequenced according to difficulty of individual items. However, even for simpler items the item sequence was not a strong predictor of item difficulty. One reason for this is that factors other than item difficulty may affect the item sequence in the form and therefore item position may not always accurately reflect the expert judgment about its difficulty. At the same time, this result is also consistent with Beinborn et al. (2014)’s results where English language teachers classified items into four groups (very easy, easy, medium, and difficult). The inter-rater agreement for three raters was not high (Fleissκ
= 0.36). This shows that the item difficulty rating is a challenging task even for experts.
Item text complexity was a stronger predictor of item difficulty for less complex item types (PDand
DC) than for more complex item types. Interestingly, the best performance was observed for PDitems even though the system had no access to the information about the graphic part of the item. For more complex items, Cand M, the text complexity of the item text appeared to have a smaller contribution to overall item difficulty. Furthermore, we found that forM items the textual complexity of the longer listening passage shared between several items was less predictive of item difficulty than the textual complexity of the actual question and responses.
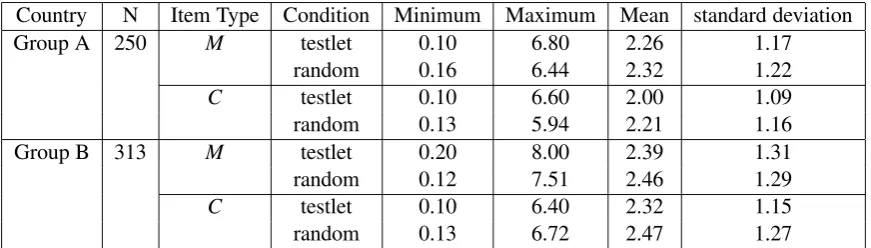
To investigate this further, we conducted the following experiment. First, for each item type, we calculated a range of deltas per each set of items (testlet-condition). Next, we paired three randomly selected items and calculated a range of deltas (random-condition). We conducted a descriptive analysis of delta ranges for these two conditions. Table 6 summarizes the results of this experiment.
The range of difficulty among items within the same testlet (or set) was quite wide. The average difficulty ranges were slightly lower than random-condition, but not largely different. If the overall difficulty of listening passage had substantial impact on the item difficulty, the difficulties of the items that shared the same listening passage might have been within a small range and therefore the difficulty ranges in the testlet condition would be smaller than for the random sets. However, we did not find such a tendency: the difficulty ranges of the testlets were comparable to random sets.
Country N Item Type Condition Minimum Maximum Mean standard deviation
Group A 250 M testlet 0.10 6.80 2.26 1.17
random 0.16 6.44 2.32 1.22
C testlet 0.10 6.60 2.00 1.09
random 0.13 5.94 2.21 1.16
Group B 313 M testlet 0.20 8.00 2.39 1.31
random 0.12 7.51 2.46 1.29
C testlet 0.10 6.40 2.32 1.15
[image:8.595.82.518.64.188.2]random 0.13 6.72 2.47 1.27
Table 6: Comparison of difficulty ranges between testlets and random sets
5 Conclusion
Our analyses demonstrated that the generic features measuring item text complexity can be used to predict item difficulty. For simpler item types, the text complexity of the item text accounts for a larger share of variance than for more complex items. Our results also show that the accuracy of the generic system based on the text complexity features is equal to or better than the accuracy of human estimates. This result was consistent for a several types of items with different structure and across two different populations of test takers.
We also found that the most highly ranked features were related to item vocabulary, such as lexical frequency of the words as well as the level of concreteness. However, the system based on vocabulary features performed worse than the system based on all features. Finally, for sets of items which shared a common listening passage, the best performance was achieved by combining the text complexity of the printed questions and the recorded passage.
Acknowledgments
We thank Chi Lu and Diane Napolitano for their help with processing the data. We also thank Ikkyu Choi, Chong Min Lee, Keelan Evanini, Michael Flor and Susan Nissan for their comments and suggestions.
References
Lisa Beinborn, Torsten Zesch, and Iryna Gurevych. 2014. Predicting the difficulty of language proficiency tests.
Transactions of the Association for Computational Linguistics, 2:517–529.
Dan Blanchard, Nitin Madnani, and Michael Heilman. 2016. Skll: Scikit-learn laboratory.
Eileen K Blau. 1990. The effect of syntax, speed, and pauses on listening comprehension. TESOL quarterly, 24(4):746–753.
Amber Bloomfield, Sarah C Wayland, Elizabeth Rhoades, Allison Blodgett, Jared Linck, and Steven Ross. 2010. What makes listening difficult? factors affecting second language listening comprehension. Technical report, DTIC Document.
R.F. Boldt and Roy Freedle. 1996. Using a neural net to predict item difficulty. ETS Research Report, RR-96-31.
Leo Breiman. 2001. Random forests.Machine learning, 45:5–32.
Geoff Brindley and Helen Slatyer. 2002. Exploring task difficulty in esl listening assessment. Language Testing, 19(4):369–394.
Jing Chen, Kathleen M Sheehan, Luke Harding, and Diane Schmitt. 2015. Analyzing and Comparing Reading Stimulus Materials Across the TOEFL Family of Assessments.ETS Research Report, RR-15-08.
Paul W. Holland and Dorothy T. Thayer. 1985. An alternate definition of the ETS delta scale of item difficulty. program statistics research.ETS Research Reports, ETS-RR-85-43.
Ayako Hoshino and Hiroshi Nakagawa. 2010. Predicting the Difficulty of Multiple-Choice Close Questions for Computer-Adaptive Testing.Special issue: Natural Language Processing and its Applications, page 279. Katsunori Kotani, Shota Ueda, Takehiko Yoshimi, and Hiroaki Nanjo. 2014. A listenability measuring method for
an adaptive computer-assisted language learning and teaching system. InProceedings of the 28th Pacific Asia
Conference on Language, Information and Computation, pages 387–394.
Thomas K. Landauer, Peter W. Foltz, and Darrell Laham. 1998. An introduction to latent semantic analysis.
Discourse Processes, 25(2-3):259–284.
Diane Napolitano, Kathleen M Sheehan, and Robert Mundkowsky. 2015. Online Readability and Text Complexity Analysis with TextEvaluator. InProceedings of NAACL-HLT 2015, Denver, Colorado, May 31 - June 5, 2015, pages 96–100.
Susan Nissan, Felicia Devincenzi, and Linda K. Tang. 1995. An analysis of factors affecting the difficulty of dialogue items in TOEFL listening comprehension.ETS Research Report, RR-95-37.
Andre A. Rupp, Paula Garcia, and Joan Jamieson. 2001. Combining multiple regression and CART to understand difficulty in second language reading and listening comprehension test items. International Journal of Testing, 1(3-4):185–216.
Kathleen M Sheehan, Michael Flor, and Diane Napolitano. 2013. A two-stage approach for generating unbiased estimates of text complexity. InProceedings of the Workshop on Natural Language Processing for Improving Textual Accessibility, pages 49–58.
Kathleen M. Sheehan, Irene Kostin, Diane Napolitano, and Michael Flor. 2014. The TextEvaluator tool: Helping teachers and test developers select texts for use in instruction and assessment.The Elementary School Journal, 115(2):184–209.
Yuni Susanti, Hitoshi Nishikawa, Takenobu Tokunaga, and Obari Hiroyuki. 2016. Item Difficulty Analysis of English Vocabulary Questions. InProceedings of the 8th International Conference on Computer Supported Education, pages 267–274.