Driver Evaluation System Using Mobile Phone
and OBD-II System
Sujata Khedkar, Asst. Professor, Department of Computer,
V.E.S.I.T.,Mumbai, India
Akshaykumar Oswal Manjari Setty Srinivas Ravi
Department of Computer Department of Computer Department of Computer
V.E.S.I.T. V.E.S.I.T. V.E.S.I.T.
Mumbai, India Mumbai, India Mumbai, India
Abstract—Road traffic accidents, errant driving, uneconomical driving are common road problems today. Poor driving is contributed as one of the primary causes of these problems. To tackle the issues in concern, the Driver Evaluation System (DES) evaluates a driver’s skills depending upon fuel efficiency achieved, acceleration, braking and many more factors using in-mobile sensors and car’s On-Board Diagnostics-II (OBD-II) system. An algorithm gives a score for every drive to the driver indicating his/her efficiency on a scale of 100. The scores are used to encourage and motivate the drivers to improve their driving. Scores are also given for individual parameters, which are used to evaluate the driver’s skills. This helps the driver to get feedback on his/her driving behavior. Additionally, the drivers can view and analyze their progress over time making use of graphs for historic data present in the system. Besides services specific to driver, a separate module is developed for organizations like RTO, Insurance companies, Transport companies, etc. to monitor and analyze their drivers’ scores and graphs.
Keywords— Driver Assessment; Driver Evaluation; OBD-II; Accelerometer; Mobile phone sensors; Safe Driving.
I. INTRODUCTION
Road traffic injuries are the eighth leading cause of death globally. The total number of road traffic deaths is unacceptably high at 1.24 million per year with many more injured around the world. Current trends suggest that by 2030 road traffic deaths will become the fifth leading cause of death unless urgent action is taken [1]. The burden of crashes is counted not only in lives and permanent injuries but also as a cost to the society.
Besides the road traffic accidents, the Global Warming is also an issue. Transportation produces almost 30 percent of all U.S. global warming emissions. The amount of fuel consumed by cars and trucks governs how much global warming pollution enters the atmosphere: the more fuel burned, the more pollution released [2]. In addition to technological advancement in automobiles and roads, good driving behaviour addresses the above concerns. Fig. 1 shows the share of improper driving on total road traffic accidents.
Fig. 1: Reasons for Road Traffic Accidents
II. LITERATURE
The Literature survey uses a descriptive writing approach and describes the existing and established theory and research in the report area, in our case, Driver Evaluation. It provides context for our work. Our survey has tried to cover everything published related to our topic. It includes books, papers and patents.
Malik [4] emphasized in this research thesis, the need and usefulness for an Intelligent Driver Training System (IDTS). The focus was on designing and implementing a system that can determine the competence level of driving maneuvers and provide feedback on the driving tasks in an intuitive manner. One of the important aspects of the Graduated Driver Licensing (GDL) program is to enable less experienced drivers progressively gain driving experience. GDL addresses the fact that both instructors and drivers should have an opportunity to establish and nurture the driver’s productive patterns of thinking and it should promote higher levels of awareness around their own learning and driving ability. The book is relevant in its extensive effort to provide driver feedback and training.
Jensen, et al.[5] developed a driver classification system, based on in-vehicle operating data. They offer a useful tool to create a safer transportation environment. In the paper, several mathematical strategies are presented to analyze collected vehicle data for driver classification. A group of test subjects were involved and collected data was analyzed off-line and a driver classification system was proposed. The driver classification is necessary step towards understanding which category a particular driver falls under and accordingly provide suggestions for improvement of the driver.
Choudhary, et. al [6] proposed in this paper, a scheme of moving-vehicles behavior detection based on accelerometer. Three-axis accelerometers are installed on vehicles to capture the moving car postures. A fuzzy interpretation system is developed to infer states of vehicle posture, such as normal driving, left/right turning, departure, acceleration, braking and bumping. Based on the appreciation of vehicle postures, the unsafe driving behaviors of car will be detected. In this paper, the strategy and development of hardware, vehicle stance measurement and dangerous driving behavior inferences are presented and realized. This paper finds relevance in the project by its method of detecting car maneuvers and thus being able to say how the driver is driving.
Pearlman Richard et.al [7] discloses a method of geospatial data based assessment driver behavior to improve driver safety and efficiency. A method of a server device may comprise determining that a telemetry data is associated with a vehicle communicatively coupled with the server device and comparing the telemetry data with a driver objective data. A variance between the telemetry data and the driver objective data may then be determined. A performance score may be generated upon comparison of the variance to a threshold limit and/or the driver objective data. The performance score may be published along with other performance scores of other drivers in other vehicles also communicatively coupled with the server device to a reporting dashboard module.
Shim Jaeryong’s et.al [8] present invention relates to a driving habit analyzing and diagnosing system and method, which can calculate data information of various sensors installed in a vehicle and statistical parameters through the information, and accurately analyze and diagnose a driver's driving habit on the basis of the statistical parameters. The present invention comprises: a data processing server for
calculating an observation threshold for performing several types of processing ; a statistical analysis server for extracting input values from a database (DB), estimating statistical model parameters, and storing the estimated parameters and results thereof in the DB; a diagnosis server for predicting relative risks of drivers to perform statistical processing and rank the drivers, and analyzing a driver's habit and each event type to perform a driving correction.
Plante, et al. [9] developed vehicle operator performance history recording and reporting systems which include devices and methods of automatically collecting and processing vehicle crash or event data over time to form a driver history report. A driver history report may include many factors to express performance or quality of driver service, and these may be reduced to a single value normalized expression in view of a collection of many drivers. Vehicle event recorders are arranged to capture data relating to a particular event. These vehicle event recorders are further coupled to systems which form an association between collected data and the vehicle operator in command of the vehicle at the event moment. An analyzer system operates to recall data, particularly data from a plurality of events all associated with a single operator but recorded over an extended period of time. Together, these factors may each be weighted and summed in accordance with specially devised a formula including those having a single value solution.
Cook Bryon, et al. [10][11] patented a system for reducing driving risk that comprises an event capture device and a processor. The event capture device is to capture a driving event of a vehicle during a driving trip. A processor configured to assign a risk identifier to the driving event, to generate an event score based at least in part on the risk identifier, and to generate a driver score based at least in part on the event score and one or more driver challenge factors. The system and method provides robust and reliable event scoring and reporting, while also optimizing data transmission bandwidth. The system includes onboard vehicular driving event detectors that record data related to detected driving events, selectively store or transfer data related to said detected driving events. If elected, the onboard vehicular system will score a detected driving event, compare the local score to historical values previously stored within the onboard system, and upload selective data or data types to a remote server or user if the system concludes that a serious driving event has occurred.
data of the bus are collected in real time, an alarm is given in real time, and therefore travelling safety of the bus is improved.
Moncrief Rick L., et al. [13] developed a system for driver assessment and training comprising a simulator which can be operated by a driver or pilot under test or in training, the simulator displaying scenarios the driver or pilot must drive through or fly through. The inputs of the driver or pilot in reaction to the displayed scenario are fed to a free body model which calculates the resulting movement of the simulated vehicle in the displayed world. Scoring can be by analysis of calculated Fonda curves comparing the driver performance to performances by one or more normative drivers plotted by standard deviation from norm on the vertical axis and sample point on the horizontal axis.
III. SOLUTION FOR IMPROVING HUMAN FACTORS FOR
DRIVING
Through various research and studies conducted in field of psychology, it is now known that human behavior can be changed more quickly and be made long lasting by rewarding desirable behavior than by penalizing undesirable behavior. Rewarding road safety behavior can also be effective, as shown by research for instance, the use of seatbelts and maintaining driving speeds within the permissible limits. But for optimum effect, a proper rewarding system needs to be devised. A system which monitors driver continuously and utilizes this real time data for allocating an appropriate score, provides appropriate feedback accordingly, and thus helps in chastising errant drivers.
Our approach for this purpose is to consider all human factors that can be analyzed with a regular mobile phone, a car and an OBD-II adapter. These human factors are the major causes for road accidents and global warming. The measured human factors are given as inputs to a smart algorithm that delivers an appropriate score to the driver based on his efficiency. Also, scores for each individual parameter will be displayed.
A. The metrics for good driving behaviour
Our system evaluates the driver. Data for evaluation is obtained in real time from mobile phone sensors as well as OBD-II system using OBD-II Bluetooth/Wi-Fi/wired adapters. These adapters send data from car to mobile phone. All the data is processed in the mobile phone.
The various parameters against which the driver is evaluated are described ahead. The most important and widely accepted parameter is efficiency. The lesser the fuel consumed per unit distance, more is the efficiency. The distance between the starting and ending points can be determined using odometer readings and fuel consumed using OBD-II fuel level sensor. Optionally, the distance can also be measured using GPS and maps. Using the GPS, current location of car can be traced every second to not just determine distance travelled but also speed and acceleration. Redundant calculations can be used to reduce errors. Currently, most cars provide average and/or instantaneous fuel economy information.
Cars should be driven at optimum RPM for maximum efficiency. The higher the RPM more is the fuel consumed.
Hence, RPM should be as low as possible. OBD-II can sense the RPM of the engine. Thus, cars should be driven at the highest gear possible for a particular speed. For maximum acceleration, with no ascend or descend in road, gears should be shifted at RPM providing maximum torque. The RPM providing maximum torque is known for a car model.
Redline RPM or extremely high RPM damages the car. The clutch, accelerator and brake pedals should be used as frugally as possible to lessen overall wear and tear of the system. Thus for example, if a car is to be stopped, the speed should be gradually reduced - much in advance. To this effect that ideally brakes should not be used to slow down. Due to extreme braking and accelerating, passenger comfort is compromised, all the energy being harnessed from the fuel are not utilized thus decreasing efficiency of the drive. OBD II clutch pedal position, throttle position and engine speed sensors can be used to check the appropriate usage of clutch, accelerator and brakes.
Passenger comfort is a popular metric for good driving. The passengers are subjected to mostly longitudinal motion when a car moves and lateral motion when it is turned. Motion perpendicular to the road surface is experienced in case of speed-breakers, bumps or potholes on the road. The passengers when subjected to combination of mild changes in all the three motions feel comfortable. Passenger comfort is compromised when the change is drastic. Sudden longitudinal motion change can be during fast starts. Sudden lateral motion is experienced during sharp turns or bends or while driving and dodging the traffic. The accelerometer along with gyroscope and magnetometer of the mobile phone can sense sudden movements of car and thus help in detecting rash driving habits like sharp overtaking. Accelerometer senses vibrations. The threshold for classifying whether a particular driving maneuver in lateral and longitudinal direction is extremely rash or rash or acceptable is checked by allowing the passengers (preferably experts) to give their feedback and use it as training data set for data mining. The passenger is prompted to give feedback each and every time a particular preset threshold is crossed. The feedback would involve stating whether the driving maneuver was acceptable or not to the passenger. The threshold calculated from such a large dataset can be used as the threshold for driving maneuver in lateral direction.
Speed limits for different stretches of road are decided keeping in mind the safety and road traffic conditions. Thus, sticking to speed lesser than the speed limit is not just obeying the traffic law but also ensuring safety. Navigational maps provide the speed limit for the current stretch of road being driven and compares with car’s speed (obtainable from OBD-II).
between the points at which turn signal was given and turn actually taken can be calculated. No fixed distance is mentioned in traffic laws. But giving turn signals at least 100 feet before the turn is considered safe. Currently there are some cars that implement Lane Departure Warning system that detects turns and lane changes done without using turn signals and alerts the driver about the car drifting to other lane using audio and/or haptic alert. Some implementations of this technology detect the lane markings using cameras. Some of the cars even automatically adjust their orientation in case of unannounced lane departure detection.
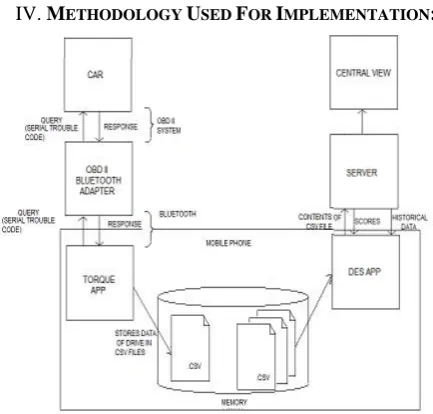
IV. METHODOLOGY USED FOR IMPLEMENTATION:
Fig. 2: System block diagram
For evaluating and assigning scores for various parameters to a driver, following technique has been adopted:
When a driver is driving, various considered parameters are monitored and their values are captured periodically. The Torque app is used to capture driving data from car via a Bluetooth enabled OBD II adapter. This OBD II adapter acts as an interface between the car's OBD II system and the mobile phone.
The data captured is stored in *.csv format as log data. These logs are first filtered and then sent to the centralized server, where the data is stored and analyzed to generate scores. Now the driver can view his/her scores and also visualize past performance as a graph (Line chart). The scores, now stored on the central server, are also accessible to secondary users for monitoring and evaluation purpose.
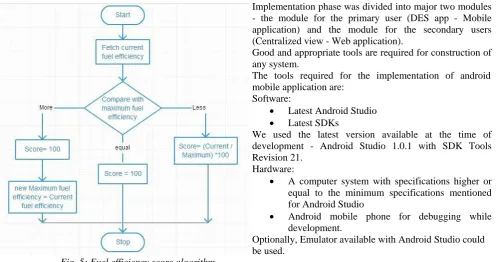
V. ALGORITHMS
The designing of algorithms for score calculation is very important for DES to be effective towards its motives. Thus algorithm designing phase involved preparation of literature survey, analysis of requirements, five month research of driving cars around analyzing the parameters essential for determining skills of driver. Constraints were the amount of information available from OBD-II system and mobile phone sensors. After analysis, algorithms were designed. The algorithms followed what the DES aimed for
- accurately tell the amount of skills of the driver. Two major parameters that are used for score calculation is passenger comfort and fuel efficiency
.
Fig. 3: Acceleration Score Algorithm
Fig. 4: General algorithm for longitudinal, linear and vertical acceleration scores algorithms
Fig. 5: Fuel efficiency score algorithm
Fuel efficiency score algorithm is intelligent. It compares the fuel efficiency achieved by the driver for a drive with the highest achieved fuel efficiency by any driver driving similar car model. This ensures the system does not need figures of maximum fuel efficiency for every car model. Also such company claimed maximum fuel efficiency is achieved under ideal conditions and hence tougher to achieve. So achieving fuel efficiency equivalent to highest fuel efficiency of the particular car model results in score of a perfect 100. Otherwise the score is relative to the maximum fuel efficiency of the car model.
VI. IMPLEMENTATION
Fig 6: Shaded modules indicate modules implemented by us.
Implementation phase was divided into major two modules - the module for the primary user (DES app - Mobile application) and the module for the secondary users (Centralized view - Web application).
Good and appropriate tools are required for construction of any system.
The tools required for the implementation of android mobile application are:
Software:
Latest Android Studio Latest SDKs
We used the latest version available at the time of development - Android Studio 1.0.1 with SDK Tools Revision 21.
Hardware:
A computer system with specifications higher or equal to the minimum specifications mentioned for Android Studio
Android mobile phone for debugging while
development.
Optionally, Emulator available with Android Studio could be used.
The tools required for the implementation of server and the Centralized View are:
Software:
Apache HTTP Server
MySQL Database Management System PHP latest version
Alternatively, a package that bundles them all could be used. For example - XAMPP or WAMP packages. We used XAMPP.
Hardware:
A computer system with specifications higher or equal to the minimum specifications mentioned for XAMPP or WAMP.
Once the tools are ready the system is implemented. For the purpose of simplicity, the implementation goals are incremental.
VII.RESULTS
Fig 7: Simulation Model
switch on Torque app before driving and log the data from car. In DES app, the user can evaluate self by choosing log of a particular drive and view scores. User can analyse his past performance by choosing a particular parameter and viewing corresponding graph generated.
A user has to initially enter the car and self-details which are stored in memory. To evaluate and get scores, user has to choose a particular drive’s log and view scores generated. He gets to see an overall score as well as scores for each parameter.
For analyzing his performance over past week, user can choose analyze option, wherein he has to choose a parameter he wishes to analyze. A graph is generated for that parameter that shows the trend of improvement, stable or degradation.
Fig 8: DES app screens
generated, are all provided to increase the utility of the system to the users.
Fig 9: DES app screens
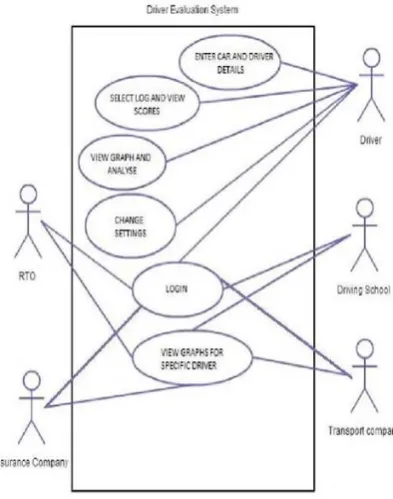
VIII. OTHER ASPECTS OF DES A. Business model
For the success of every product or service, the potential users should find maximum of their requirements being satisfied. Users of the system and their usage pattern are as follows:
1) Regional Transport Office (RTO) and driving schools RTO have the responsibility to assess people’s driving skills before issuing them Driver’s License. RTO may issue permanent driver’s license only when the driver holding learner’s license achieves a certain score. This could make RTO meet its goal efficiently.
Driving Schools can make use of the system to train and test the people to pass RTO’s driving test.
2) Insurance companies
Settling claims according to the driving behavior of the claimant enables the insurance companies to not cover for unsafe drivers and thus increase their profits ethically. Thus, this would also deter unsafe drivers.
3) Transport companies
Transport companies managing fleet of vehicles may find this useful to monitor their drivers. Not only could they determine how efficiently the drivers drive, but also remotely determine their current location and the route they have taken as the application makes use of GPS.
4) People willing to improve their driving skill
Besides the scores, features like leaderboard system, information about the location where the vehicle is parked, nearest fuel station - keeping in mind fuel left in the vehicle, resetting capability to remove fault codes that are often
Keeping these potential uses and users in mind, we developed a centralized view for secondary viewers. Here third party organizations’ member can first login to authenticate himself and enter a particular driver’s license number to view his past performance in the form of various graphs and analyze his driving skill.
Fig 11: Intelligent auto complete gives suggestions while entering license number to save the user’s time and effort
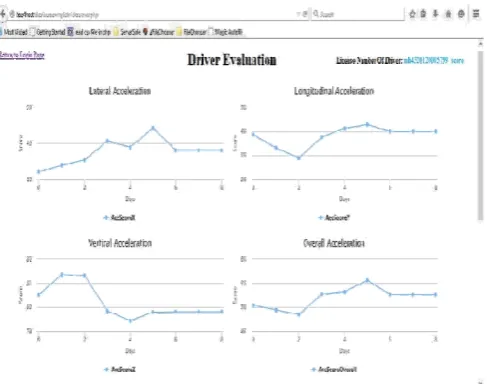
Fig 12: Complete analysis of past performance of the Driver
B. Future Scope
With further refinements, the app will stand to be a wholesome solution to curb road errant. The app can be then made mandatory for regulatory purpose and the adapter interface can be pre-installed in car itself.
The third party module will benefit different target organisations. For example, the RTO module can automate the process of issuing driver license. Automation gives the advantage of faster service in a reliable manner.
Also, those who are holding learning license and fail to obey the rules of proper driving can be penalised by not granting permanent license immediately. Similarly,
permanent licenses of those disobeying traffic laws can be taken away. Insurance policies implementation will be fairer.
Android’s Android Auto and Apple’s CarPlay are in-built car info-entertainment systems. In their subsequent versions, they could be synchronized with the car computer systems like Engine Control Module (ECM) and Body Control Module (BCM). This would enable to implement our system without use of any accessory - mobile phone or OBD-II adapter.
The DES may prove to be useful to check the competency of not just human drivers but also unmanned vehicles.
C. Limitations
User needs to own a mobile phone powered by Android version 2.3.6 (Gingerbread) or above. For current version, user needs to have Torque app
installed on his/her mobile phone.
The user has to manually switch on the app every time he drives to record driving parameters. The user should be willing and determined to
improve self.
The app evaluates the driver based on vehicle sensor readings. Vehicle sensor readings also depend on surrounding environment and the state of the car. So, for example, driving on a patchy stretch of road will give bad Vertical acceleration score. Therefore, the driver needs to understand and employ self-analysis to be able to use the app efficiently.
IX. CONCLUSION
The DES app is developed with an aim to help users to improve their driving skills. It stands to be an extremely beneficial app for several individual car owners as well as others like Fleet owners and third party users like RTO and Insurance companies mentioned before. Self-analysis by driver is important for self-improvement using this app; therefore, the driver needs to be motivated throughout the process.
Additional services like sharing scores, comparing self with friends and other peers is being planned in future versions to help in keeping up the motivation.
Although this app isn't a complete solution, it definitely has its share in making roads safer. This marks the beginning of road safety using app in technology. Further refinement can make this a remarkable, simple yet effective solution.
REFERENCES
[1] Toroyan.T, Global status report on road safety 2013. Supporting a decade of action. WHO, Geneva, Switzerland (2013) 318 pp. ISBN 978 92 4 156456 4
[2] Car emissions and Global Warming. Union of Concerned Scientists USA.
[3] Joakim Östlund, et al., “Driving performance assessment methods and metrics”, AIDE D2.2.5, IST-1-507674-IP Information Society Technologies (IST) Programme, December 22, 2005
[4] Husnain Malik, “An Assessment System for Evaluation of Driving Competencies”, Centre for Accident Research And Road Safety – Queensland Queensland University of Technology, January 2011 [5] Jensen, M., et al., “Analysis of in-vehicle driver behaviour data for
[6] Ashutosh Kumar Choudhary, et al., “An approach to detect dangerous driving behavior through in Car system”, International Journal of Emerging Trends in Engineering and Development, Issue 4, Vol.3 (May 2014), ISN 2249-6149
[7] Pearlman Richard, et al., “Geospatial data based assessment of driver behavior and performance”, European Patent CA2867447 (A1), September 19, 2013
[8] Shim Jaeryong, et al., “System and method for analyzing and diagnosing driving habit”, European Patent WO2015053423 (A1), April 16, 2015
[9] Plante, et al., “Vehicle operator performance history recording, scoring and reporting systems”, U.S. Patent 8 989 959, March 24, 2015
[10] Cook Bryon, et al., “Driver risk assessment system and method employing automated driver log”, European Patent US2014292504 (A1), October 2, 2014
[11] Cook Bryon, et al., “Driver risk assessment system and method employing selectively automatic event scoring”, European Patent US2015025734 (A1), January 22, 2015
[12] Li Xuyou, et al., “Bus driver driving level assessment method based on MEMS IMU”, European Patent CN104091079 (A), October 08, 2014