Sleep Disorder Recognition using Wearable Sensor
and Raspberry Pi
Vinay Kumar Chandna1, Sagar Narang2 Yash Bansal3
Senior member, IEEE Student Member IEEE Student Member IEEE
Prof. and Head Electrical Final Year, MAIT Delhi Final Year, MAIT Delhi JSS Academy of Technical Education
Noida,
Abstract- Sleep analysis is usually done inside a sleep laboratory under close supervision of doctors with the help of cardiac rhythm using electro cardiography (ECG), breathing patterns, brain activities using electro encephalography (EEG), eye movement using electrooculography (EOG) and muscle activity during sleep. The data collected through these devices is thus utilized for further analysis and has uncertainty and noise. In this paper, a novel approach for sleep analysis is discussed with Raspberry Pi. Sample data is collected during night with the sensor attached to the patient’s pillow and observations are made during various sleep stages. The data is also utilized for the calculation of sleep efficiency that is further divided into awake, light sleep and deep sleep percentage as shown by the hypnogram. This methodology helps us in easy analysis of quality of sleep and calculation of sleep debt. The methodology is useful for the patients who are unable to go to the hospital.
Index Terms— Accelerometer, ECG, EEG, Gyroscope, NREM sleep, Raspberry Pi, REM sleep, Sleep Analysis, Sleep Debt, Sleep Apnea ,Sleep disorder, Wearable sensor.
I.INTRODUCTION
Sleep is an essential natural activity that is useful to avoid fatigue, stress and keeps people healthy. One fourth of a life time is spent sleeping, approximated to 2,500 hours per year. Lack of sleep can affect the memory, immune system, cognitive functioning, learning abilities, and alertness and thus lead to poor work performance of an individual. Furthermore, researchers have found correlations between sleeplessness and certain diseases, such as heart disease and diabetes. [1]
There are several technologies made by the researchers for monitoring human sleep. Some of them require an artificial stimulated environment where in a patient is analyzed under several factors, for instance, cardiac rhythm using electrocardiography [ECG], breathing patterns, brain activities electroencephalography [EEG], eye movement electrooculography [EOG] and muscle activity during human sleep. These techniques are based on physiological signals from the human body [9] .However with as many as 55 sensors on a human body, the natural sleeping patterns of the patient is disturbed. Some of the methods are based on the patient’s medical history and surveys. Thus, there is a need of an efficient way to remotely monitor human sleep in a natural environment. [4]
The normal human sleep is broadly categorized as: 1. Rapid eye movement (REM sleep) [3]
2. Non-Rapid eye movement (NREM or non-REM sleep).
Each type of these categories have distinctive set of physiological and neurological characteristics associated with it. Fig.1. shows the typical hypnogram that shows the average human sleep cycle with various stages viz. awake, REM, light, medium, deep and very deep[2] .The characteristics of the human sleep cycle is as shown in table-I.
Table-I: Typical characteristics of the common human sleep stages
Sleep Stages Behavior
Awake Conscious state of mind
REM Sleep Dreams occur, muscles are turned off, provides energy to brain and body
Light non-REM Sleep Occasional muscle twitching, Light decrease in temperature
Deep non-REM Sleep Slower breathing rates.
The above table depicts various sleep stages in a human sleep cycle with their characteristic behaviors.
Fig.1. A typical Hypnogram representing various sleep cycles of a 7 hour sleep.
night with the sensor attached to the patient’s pillow and observations are made. The data is also utilized for the calculation of sleep efficiency that is further categorized into awake, light sleep and deep sleep percentage.
In our study of sleep disorder, we collected 20-days subjective sleep-movement data which is considered as a parameter for sleep efficiency calculation. Then, efficiency report was prepared and further investigating if the data would allow us to recognize whether the patient suffered from sleep disorders or not. The Sleep Analysis Algorithm is based on the hypothesis that quality of sleep is directly related to the motion of patient during the sleep [10].
Sleep study and analysis has a lot of applications. Some serious ailments related to human sleep are as follows: 1. Sleep-related breathing disorders: Central Apnea
Syndromes, Upper Airway Resistance Syndrome. 2. Sleep-related movement disorders: Restless Legs
Syndrome (RLS),Periodic limb movement disorder 3. Sleep-related seizure disorders.
4. Common sleep disorders: Insomnia, narcolepsy.
5. Sleep-related night-time behaviors: Sleepwalking, Night Terrors, or bed-wetting.[6]
II. SLEEP ANALYSIS ALGORITHM
Fig.2. Typical architecture implemented in sleep analysis algorithm.
Data Collection:
The Raspberry Pi in combination with the gyroscope and accelerometer collects data from the motion of the patient. The motion sensor is attached to the pillow or the mattress of the sleeping person under observation. It gathers movement data throughout the course of sleep. The data collected during typical human sleeping cycles is stored on a cloud database using engineering station through a data highway.
Data Processing:
Precision tracking of both moderate and minuscule level motion is performed on the Operator machine. The output range of the wearable motion sensor (±1000) is transformed to an appropriate scale for computation. The sensor collects data on the 3-dimensional axis and the reading of these
individual axis is saved in to the database. The x, y, z axis values are intelligently analyzed and assimilated into a single float point entity using generalized mean. The algorithm classifies the sleep on the basis of degree of motion.
Fig.3. Assimilation of 3-dimensional axis reading into a single float point entity (µ) using generalized mean.
Data Classification:
Based on the motion of the patient, the output values of the gyroscope are segregated into the following categories [7]:
1. Awake: Wakefulness is an everyday recurring state of consciousness in which a human being is conscious and engages in clear cognitive behavioral responses to the external world
2. Light Sleep: Lasting from 10 to 25 minutes, this is the first stage of factual sleep. The eye movement stops, heart rate slows, and body temperature decreases. About 70 to 90 minutes after falling asleep, humans enter REM sleep. The eyes move speedily, the heart rate and blood pressure increases and breathing patterns shallows. In this category, there is occasional muscle twitching.[3]
3. Deep Sleep: Sleep is a naturally recurrent state characterized by altered consciousness, inhibition of nearly all voluntary muscles and relatively inhibited sensory activity. It is differentiated from category-2 by a decreased ability to react to stimuli.
Data Aggregation:
The float point value (µ) is separated into its respective
sleep categories (Awake, Light Sleep and Deep Sleep). These results are fed into the data operator for result formation, efficiency calculation and sleep disorder recognition.
Data Analysis:
Intelligent Algorithm Variables Used:
1. X = Y-axis reading 2. Y = Y-axis reading 3. Z = Z-axis reading
7. β2 = Sleep_type_light 8. β3 = Sleep_type_awake 9. α = Total value count 10. TST = Total sleeping time 11. TRT = Total recording time
µ =
if (µ>0 or µ<=th1)
β1 = ”DEEP SLEEP” else if (µ>th1 or µ<=th2)
β2 = “LIGHT SLEEP” else if (µ>th2)
β3 = ”AWAKE”
The ratio between the total sleep time (TST) and the total recording time, or TRT, is called the sleep efficiency. Total sleep efficiency =
Deep sleep efficiency =
Light sleep efficiency =
Fig.4. Procedural flow of Intelligent Algorithm
Data Reporting:
Data was collected over a period of twenty nights and it was represented as a graph (Movement V/S Time) for each night. The graphs represents motion of the patient during the night with respect to time, which is known as Hypnogram [8]. It graphically depicts the stages of sleep during the course of each night. After efficiency calculation for each night, a sleep disorder report for the patient was generated. The final report displays quantitative comparison among the each day sleep efficiency for the patient.
III.HARDWARE AND SOFTWARE DESCRIPTION The Raspberry Pi B+ is a credit card-sized single-board computer, developed by the Raspberry Pi Foundation. Linux is the primary operating system supported by Raspberry Pi. The MPU-6050 is a 6-axis Motion tracking device consuming low power and providing high performance requirements of wearable sensors. The MPU-6050 sensor combines a 3-axis gyroscope and a 3-axis accelerometer on the same silicon die with an integrated Digital Motion Processor (DMP).
The sleep disorder analysis system uses Python for software code, R for statistical analysis and graph sketching, and SQLite3 as a database. R is programming language and software environment for statistical computing and graphics. The architecture stack for the system has been shown in figure 6.
The system constraints of the sleep disorder analysis system have been enumerated below:
1. System Power specification :Micro USB socket 5V, 2A
2. System CPU specification: 700 MHz Low Power ARM117
3. System Memory specification: 512 SDRAM 4. Wearable Sensor full scale range : ±1000
5. Wearable Sensor power supply range: :2.375V-3.46 V
Fig.6. Architectural Stack for Sleep Disorder Analysis System
IV.RESULT AND ANALYSIS
using the above algorithm. The Hypnogram (Time v/s Movement graph), as shown in fig.7 is plotted using a single night data for a patient (Day 1) [8]. The efficiency table (Table-II) stores the computed efficiency of the 5 patients over a period of 20 days.
Fig.7. Hypnogram depicting sleep effectiveness for every hour.
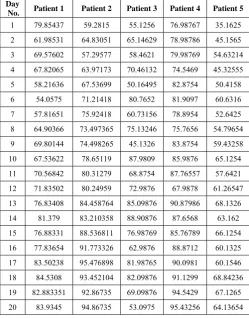
Table-II: Sample data depicting the efficiency calculation of 5 patients for the duration of 20-days.
Day
No. Patient 1 Patient 2 Patient 3 Patient 4 Patient 5 1 79.85437 59.2815 55.1256 76.98767 35.1625
2 61.98531 64.83051 65.14629 78.98786 45.1565
3 69.57602 57.29577 58.4621 79.98769 54.63214
4 67.82065 63.97173 70.46132 74.5469 45.32555
5 58.21636 67.53699 50.16495 82.8754 50.4158
6 54.0575 71.21418 80.7652 81.9097 60.6316
7 57.81651 75.92418 60.73156 78.8954 52.6425
8 64.90366 73.497365 75.13246 75.7656 54.79654
9 69.80144 74.498265 45.1326 83.8754 59.43258
10 67.53622 78.65119 87.9809 85.9876 65.1254
11 70.56842 80.31279 68.8754 87.76557 57.6421
12 71.83502 80.24959 72.9876 67.9878 61.26547
13 76.83408 84.458764 85.09876 90.87986 68.1326
14 81.379 83.210358 88.90876 87.6568 63.162
15 76.88331 88.536811 76.98769 85.76789 66.1254
16 77.83654 91.773326 62.9876 88.8712 60.1325
17 83.50238 95.476898 81.98765 90.0981 60.1546
18 84.5308 93.452104 82.09876 91.1299 68.84236
19 82.883351 92.86735 69.09876 94.5429 67.1265
20 83.9345 94.86735 53.0975 95.43256 64.13654
The next step would be analyzing the efficiency report of each patient and comparing them to other patients. Two types of analysis were done here:
1 .Qualitative Analysis: The sleep efficiency gives us the quality of the sleep the patient is getting. Now, on carefully analyzing Fig.7. , Patient ID 3 and Patient ID 8 have the maximum discrepancy in their efficiencies.
Fig.7. Boxplot comparing the sleep efficiency of 10 patients (Qualitative Analysis)
2. Quantitative Analysis: Effective number of sleeping hours were calculated using the following formula:
Effective Sleeping Hours = (Sleep Efficiency*Total Recording Time)/100
Fig.8. Boxplot comparing the Effective Sleeping hours of 10 patients (Quantitative Analysis)
Analyzing Fig 8 quantitatively, Patient ID 9 and Patient ID 8 have the minimum average Effective sleeping hours.
V.CONCLUSION
The above sections shows two types of analysis done on patients for sleep disorder recognition. The qualitative analysis shows that Patient ID 3 and Patient ID 8 have the maximum discrepancy in their efficiency thus concluding that they have a very erratic quality of sleep.
The qualitative analysis shows that out of all the patients Patient ID 8 and Patient 9 were getting below average number of hours of sleep.
Thus, combining the results from both the analysis, it can be concluded that Patient ID 8 has confirmed sleep disorder and Patient ID 3 and Patient 9 have high risk of developing a sleep disorder.
REFERENCES
[1] Fung Po Tso, David R. White, Simon Jouet, Jeremy Singer, Dimitrios P. Pezaros, “The Glasgow Raspberry Pi Cloud:A Scale Model for Cloud Computing Infrastructures”, Distributed Computing Systems Workshops
[2] Guilleminault, C. and Kreutzer, M.L. (30 September 2003). "Chapter 1 – Normal Sleep". In Michael Billiard. Sleep: Physiology, Investigations, and Medicine (Google eBook). Springer. p. 5. ISBN 978-0-306-47406-4. Retrieved 7 April 2012.
[3] Mirmiran M, Scholtens J, van de Poll NE, Uylings HB, van der Gugten J, Boer GJ (April 1983). "Effects of experimental suppression of active (REM) sleep during early development upon adult brain and behavior in the rat". Brain Research 283 (2-3): 277– 86.PMID 6850353
[4] Cirelli C, Tononi G "Is Sleep Essential?". PLoS Biol (Public Library of Science) 6 (8): e216, doi:10.1371 / journal .pbio 0060216, PMC 2525690.PMID 18752355, 26 August 2008.
[5] Silber MH, Ancoli-Israel S, Bonnet MH, Chokroverty S, Grigg-Damberger MM, et al (2007). "The visual scoring of sleep in adults". Journal of Clinical Sleep Medicine 3 (2): 121– 31.PMID 17557422
[6] Hirshkowitz, Max (2004). "Chapter 10, Neuropsychiatric Aspects of Sleep and Sleep Disorders (pp 315-340)" (Google Books preview includes entire chapter 10). In Stuart C. Yudofsky and Robert E. Hales, editors. Essentials of neuropsychiatry and clinical neurosciences (4 ed.). Arlington, Virginia, USA: American Psychiatric Publishing. ISBN 978-1-58562-005-0
[7] Lee-Chiong TL (2009). Sleep Medicine Essentials. Wiley-Blackwell. pp. 2–3. ISBN 0470195665.
[8] Ng, Beng-Yeong; Lee, Tih-Shih (2008). "Hypnotherapy for Sleep Disorders". Annals of the Academy of Medicine, Singapore 37 (8): 683–8. PMID 18797562
[9] Ivanenko A and Massey C (October 1, 2006). "Assessment and Management of Sleep Disorders in Children". Psychiatric Times 23 (11).