Article
1
Effect of LCF Pre-Damage on Very High Cycle
2
Fatigue Behavior of TC21 Titanium Alloy
3
Nie Baohua 1, Zhao Zihua 2,*, Ouyang Yongzhong 3, Chen Dongchu 1, Chen Hong 1, Sun Haibo 1
4
and Liu Shu 1
5
1 School of Materials Science and Energy Engineering, Foshan University, Foshan 528000, China;
6
[email protected] (N.B.); [email protected] (C.D.); [email protected] (C.H.);
7
[email protected] (S.H); [email protected] (L.S.)
8
2 School of Materials Science and Engineering, Beihang University, Beijing, 100191, China
9
3 School of Environmental and Chemical Engineering, Foshan University, Foshan 528000, China;
10
11
* Correspondence: [email protected]; Tel.: +86-010-8231-3264
12
Abstract: The effect of low cycle fatigue (LCF) pre-damage on the subsequent very high cycle fatigue (VHCF)
13
behavior is investigated in TC21 titanium alloy. LCF pre-damage is applied under 1.8% strain amplitude up to
14
various fractions of the expected life and subsequent VHCF properties are determined using ultrasonic fatigue
15
tests. Results show that 5% of LCF pre-damage insignificantly affects the VHCF limit due to the absent of
16
pre-crack, but decreases the subsequent fatigue crack initiation life estimated by Pairs’ law. Pre-cracks
17
introduced by 10% and 20% of LCF pre-damage significantly reduce the subsequent VHCF limits. The crack
18
initiation site shifts from subsurface-induced fracture for undamaged and 5% of LCF pre-damage specimens
19
to surface pre-crack for 10% and 20% of LCF pre-damage specimens in very high cycle region. The fracture
20
mechanism analysis indicate that LCF pre-crack will re-start to propagate under subsequently low stress
21
amplitude when stress intensity factor of pre-crack is larger than its threshold. Furthermore, the predicted
22
fatigue limits based on EI Haddad model for the LCF pre-damage specimens well agree with the experimental
23
results.
24
Keywords: very high cycle fatigue; fatigue pre-damage; titanium alloy; LCF
25
26
1. Introduction
27
Titanium alloy is widely used for aeronautical structures because of its high specific strength,
28
toughness, and damage tolerance [1]. Throughout the ultra-long time service, the components are
29
subjected to high frequency, low amplitude, and cyclic load, thus very high cycle fatigue of titanium
30
alloys in the life regime beyond 107 cycles has been drawing a world wide attention. In practice,
31
aeronautical structures may consist of low cycles fatigue (LCF) resulting from the take off and drop
32
down of the aircraft and VHCF generated by high-frequency vibrations. VHCF cracks mainly
33
induced from the metallurgical defects such as non-metallic inclusions [2,3], while LCF crack
34
initiated from the specimen surface due to the surface machining flaws and persist slip bands. Thus
35
interest is increasing not only in the capability of pure VHCF but also in that of VHCF combined
36
with LCF fatigue damage.
37
Most recent studies have focused on very high cycle fatigue of titanium alloys under constant
38
amplitude. The S–N curves exhibit either a decreasing shape [3, 4] or a step-wise[4]. These materials
39
also exhibit shifting crack initiation site from surface-induced fracture at low cycle regimes to
40
subsurface-induced fracture at very high cycle regimes [5,6]. Microstructure features such as
41
primary α phase size and distribution [7], crystal orientation [8,9], as well as super grain (grain
42
clusters with similar orientation)[10], and stress ratio[11], loading models[12] are important factors
43
affecting the fatigue crack initiation of titanium alloy. However, few studies have been devoted to
44
the LCF/VHCF combined fatigue behavior of titanium alloys. Hang[13] developed continuum
45
damage mechanics model to evaluate cumulative damage of LCF and VHCF for low
46
carbon-manganese steel, indicating that LCF load significantly influences the VHCF strength.
47
Mayer[14] showed that the deleterious influence of low load cycles below constant amplitude
48
fatigue limit is underestimated for very high cycle fatigue damage of 100Cr6 steel under variable
49
amplitude (VA) loading condition. Treating VHCF as pure failure modes in fatigue design practice is
50
non-conservative throughout ultra-long life service. Furthermore, the effect of LCF load on VHCF
51
fracture mechanism for titanium alloys is not well understood.
52
The effect of LCF pre-damage on VHCF behavior of TC21 titanium alloy was investigated in the
53
present work. The LCF up to various fractions of expect life was used to introduce pre-damage, and
54
then the VHCF behaviors were subsequently characterized. This work aimed to enable fundamental
55
understanding of very high cycle fatigue fracture mechanism combined with LCF pre-damage.
56
2. Experimental procedures
57
2.1. Materials
58
The material used in this study was TC21 titanium alloy with a nominal chemical composition
59
of Ti-6Al-2Sn-2Zr-3Mo-1Cr-2Nb. Heat treatment was as follows: 900 °C for 2 h + air quenching, and
60
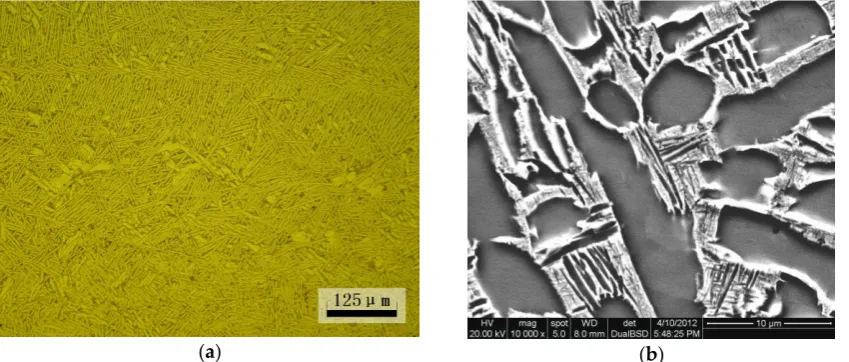
then 600 °C for 4 h + air quenching. The heat-treated material had a high yield strength of 970 MPa
61
and tensile strength of 1070 MPa. A double lamellar basket-weave microstructure was observed (Fig. 1).
62
63
(a) (b)
Figure 1. Basketweave microstructures of TC21 titanium alloy: (a) optical micrograph and (b)
64
backscattered electron micrograph.
65
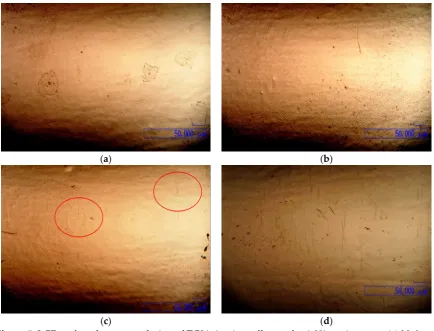
2.2 Surface treatment
66
The specimens underwent electro-polishing (EP) to remove the machining layers to observe
67
fatigue damage morphology and eliminate its influence on fatigue behavior. Electro-polishing was
68
carried out in 59% methanol, 35% n-butanol, 6% perchloric acid under -20 temperature and 20℃ -25V
69
voltage.
70
2.3 Fatigue test
71
2.3.1 Ultrasonic fatigue test
72
Fatigue tests were carried out using an ultrasonic fatigue test machine (20 kHz) at a constant
73
load ratio of R = -1. The ultrasonic fatigue testing method is an accelerated testing method with a
74
frequency far beyond that of conventional fatigue experiments, which brings advantages of
75
effectiveness and economy characters for very high cycle fatigue tests comparing with conventional
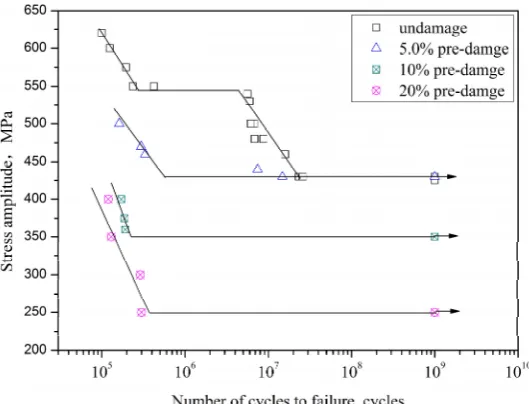
76
tests method. The some basic components of an ultrasonic fatigue test machine are shown in Fig. 2
77
[15]. An ultrasonic generator transforms 50 or 60 Hz voltage signal into sinusoidal signal with 20
78
kHz; a piezoelectric converter excited by the generator transforms the electrical signal into
79
longitudinal mechanical vibration with same frequency; an ultrasonic horn amplifies the vibration
displacement in order to obtain the required strain amplitude in the middle section of specimen; a
81
computer control system is necessary to control the load amplitude and acquire test data. The
82
maximum displacement amplitude measured by means of a dynamic sensor is obtained at the end of
83
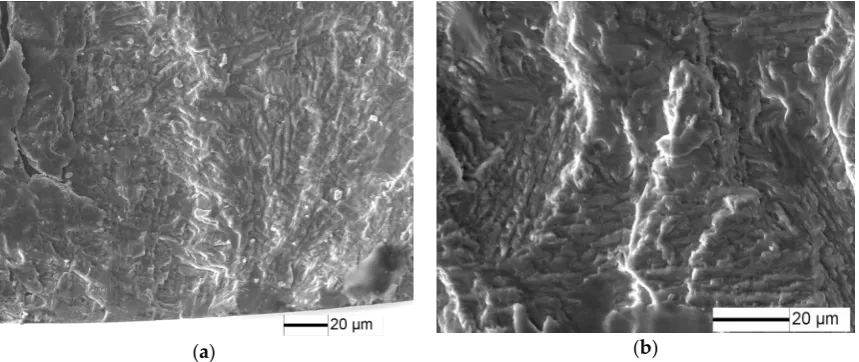
the specimen, while the strain excitation in push-pull cycles (load ratio R=-1) reaches the maximum
84
in the middle section of the specimen, which produces the required high frequency fatigue stress. In
85
addition, compressed air cooling gun is necessary to be used to prevent the temperature increasing
86
of specimen in the tests.
87
Considering that the amplifier and the specimen must work at resonance, the specimen
88
geometry was designed using the elastic wave theory. Fig. 3 shows the geometries of the fatigue
89
specimens and its dimensions.
90
91
Figure 2. The schematic diagram of ultrasonic fatigue test system [15].
92
93
94
Figure 3. Shape and dimensions of the test specimens.
95
2.3.2 LCF fatigue tests
96
The specimen were tested under uniaxial constant strain amplitude controlled strain ratio was
97
then approximately R=1. The Instron 8801 fatigue machine is employed to perform the LCF tests.
98
Considering the dimensions of ultrasonic fatigue test specimens (Fig.3), LCF test was controlled
99
under transverse diameter deformation. The diameter deformation can be converted to longitudinal
100
direction through the formulas below [13]:
101
1
( )
p dia e
p E
σ
ε ε ν
ν
= − + (1)
102
1 (1 e)
dia
p p
E
ν σ
ε ε
ν ν
= − − (2)
103
where εdia, εp, ε are diameter deformation, longitudinal plastic strain, longitudinal total strain,
104
respectively. E, υe are Young modulus, elastic Poisson coefficient. υp is plastic Poisson coefficient and
105
its value is always 0.5. σ is the longitudinal stress.
106
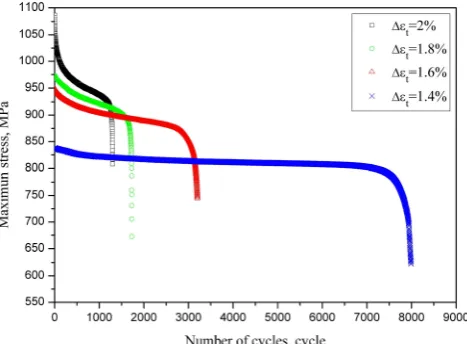
In all LCF tests, reversed triangle strain waveform was submitted to the specimens. The failure
107
condition is set as its maximum stress decreasing 20% after its cyclic saturation. Fig. 4 shows fatigue
108
life is 1864 cycles at 1.8% strain amplitude. Furthermore, the fatigue damage morphology of
109
different stage fatigue were observed using a video microscope .
111
112
Figure 4. Cycle strain-stress response and fatigue life of TC21 titanium alloy
113
2.3.3. LCF/VHCF combined fatigue tests
114
In order to investigate the effect of LCF pre-damage on behavior of VHCF for TC21 titanium
115
alloy, specimens were submitted to a same prior 1.8% strain range (strain ratio: -1). LCF pre-damage
116
was applied onto ultrasonic fatigue specimens at 1.8% strain range for 90 cycles (5% of fatigue life),
117
180cycles (10% of fatigue life), 360 cycles (20% of fatigue life), respectively. The subsequent VHCF
118
tests are performed by using ultrasonic fatigue test machine at R = -1, room temperature.
119
2.3.4 Fatigue pre-crack propagation
120
Fatigue pre-crack was obtained by LCF at 1.8% strain range and ratio of -1. The propagation of
121
fatigue pre-crack under subsequently low stress amplitude were observed using a video microscope.
122
Fatigue crack propagation rate was expressed as follows:
123
i+1 i
i+1 i
a - a a
da / dN = =
N N - N
Δ
Δ (3)
124
where
a
iis crack depth at cycle number Ni, which is supposed to be equal to 0.8c [16], and a125
surface crack with length 2c was obtained using the video microscope.
126
3. Results
127
3.1 LCF damage of TC21 titanium alloy
128
The LCF surface damage evolution of TC21 titanium alloy under 1.8% strain amplitude is
129
shown in Fig.5. No surface crack is observed in 90 cycles (5% of LCF life) until the number of cycles
130
increase to 180 cycles (about 10% of LCF life). However, the number of microcrack significantly
131
increase in 360 cycles (about 20% of LCF life), then these microcrack were expanded to merge until
132
the specimen is broken.
(a) (b)
(c) (d)
Figure 5. LCF surface damage evolution of TC21 titanium alloy under 1.8% strain range: (a) N=0
135
cycles ; (b) N=90cycles (5%); (c) N=180 cycles (10%); (d) N=360 cycles (20%).
136
137
The fracture surfaces of specimens under 1.8% strain range, Nf = 1864 cycles are shown in Fig. 6.
138
LCF cracks initiate from multiple sites on the sample surface, and a radial ridge pattern parallel to
139
the crack propagation direction is observed on the fracture surface (Fig. 6a). Some small elliptical
140
planes have traces of friction at the fatigue crack initiation site (Figs. 6b and 6c), indicating these
141
small cracks were expanded to merge to fracture, as is accordance with Fig.5d. Cleavage character is
142
observed near the small planes (Fig. 6c). And typical fatigue striation is displayed on fatigue crack
143
steady propagation(Fig. 6d).
144
145
(c) (d)
Figure 6. Fatigue fracture surface of TC21 alloy under 1.8% strain range, N = 1864 cycles: (a)
146
macroscopic morphology, (b) crack initiation morphology, (c) crack initiation character, and (d)
147
crack propagation morphology.
148
3.2 S-N curves after fatigue pre-damage
149
Fig.7 shows that the S–N curve of undamaged specimens exhibit either a step-wise, which is
150
similar to the reference [4,5], while the pre-damaged specimens exist knee of horizontal lines for
151
their S-N curves when fatiue life is higher than 105 cycles. 5% of LCF pre-damage insignificantly
152
affects fatigue limit but remarkably decreases fatigue life above fatigue limit compared with
153
undamaged specimens. Fatigue life at 500 MPa stress amplitude is reduced by two orders of
154
magnitude after 5% of LCF pre-damage. Fatigue limits for 10% and 20% of the expected life
155
pre-damage decrease from 430 MPa to 350 MPa and 250 MPa for the undamaged specimens,
156
respectively. However, it was reported that the LCF pre-damage with high R value insignificantly
157
affects fatigue limit because of its overloading effect [17,18]. In this paper, residual compressive
158
stress is introduced at the pre-crack tip because of tensile overload; however, the pre-crack that acts
159
as a blunt notch yields a residual tensile stress due to the high compression overload for a stress ratio
160
of -1. Thus, the overloading effect of the alloy is significantly reduced by the residual tensile stress.
161
Figure 7. S-N curves of TC21 for LCF pre-damage specimens
162
3.3 Fracture character of fatigue pre-damage specimens
163
As is showed in Fig.8, fatigue crack of TC21 titanium alloy under low stress amplitude initiates
164
from the subsurface. α/β lamellar characteristics are observed at the crack initiation site where fine
granular area (FGA) is found along the α lamellar. The FGA characteristics of TC21 titanium alloy
166
are similar to those of high-strength steels [19,20], although non-metallic inclusions are not observed
167
at the FGA center.
168
169
(a) (b)
Figure 8. Fatigue fracture surface of TC21 titanium alloy at σ = 480 MPa and N = 6.86 × 10⁶ cycles: (a)
170
fatigue crack initiation site, and (b) high magnification morphology of crack initiation site.
171
172
The typical fatigue fracture surfaces of 5% of LCF pre-damage specimens are shown in Figs. 9
173
and 10. fatigue crack initiates from the specimen surface at 470 MPa stress amplitude (Fig. 9), while
174
fatigue crack tends to initiate from the specimen subsurface for undamaged specimen (Fig. 8). Radial
175
ridge pattern parallel to the crack propagation direction is displayed on the fracture surface.
176
However, fatigue crack initiates from the specimen subsurface at VHCF limit stress amplitude
177
(430MPa), and a fine granular area is observed at the crack initiation site (Fig. 10), which has similar
178
crack initiation character to undamaged specimens.
179
180
(a) (b)
Figure 9. Fracture surface for 5% of LCF pre-damage specimens at σ = 470 MPa and N = 1.27 × 10⁵
181
cycles: (a) macroscopic morphology, and (b) crack initiation character.
182
(a) (b)
Figure 10. Fracture surface for 5% of LCF pre-damage specimens at σ = 430 MPa and N = 1.48 × 10⁷
189
cycles: (a) macroscopic morphology, and (b) crack initiation character.
190
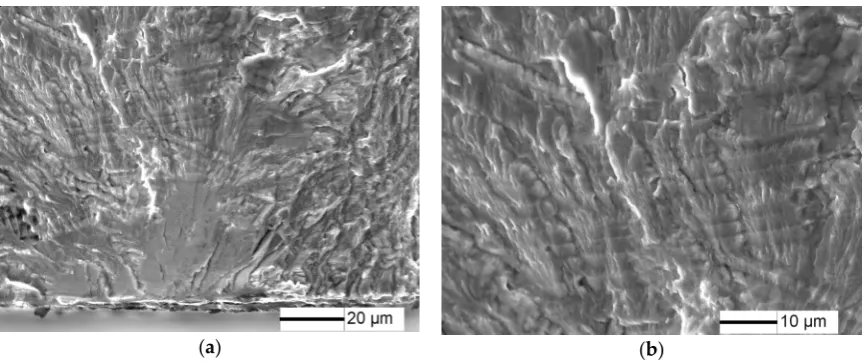
Fatigue fracture surfaces of 10% and 20% of LCF pre-damage specimens at low stress amplitude
191
are shown in Figs. 11 and 12. Fatigue crack initiates from the specimen surface (Figs. 11a,12a), and a
192
small elliptical plane with traces of friction is observed at the fatigue crack initiation site (Figs.
193
11b,12b), similar to that of LCF crack. And the depth of the small plane is approximately 14.7 µm and
194
41.5 µm, respectively. Moreover, crack-propagation morphology is observed outside the small plane
195
at the crack initiation site. The crack-propagation character is associated with α/β lamellar
196
microstructure generated by the subsequent low stress fatigue, rather than the cleavage morphology
197
generated by LCF. Therefore, the small plane at crack initiation site is supposed to be formed from
198
fatigue pre-cracks.
199
200
(a) (b)
Figure 11. Fracture surface for 10% of LCF pre-damage specimens atσ= 375 MPa and N = 1.88 × 10⁵
201
cycles: (a) crack initiation character, and (b) crack propagation character
202
203
(a) (b)
Figure 12. Fracture surface for 20% of LCF pre-damage specimens at σ = 350 MPa and N = 1.35 × 10⁵
205
cycles: (a) crack initiation character, and (b) crack propagation character.
206
4. Discussions
207
4.1 Effect of LCF pre-damge on VHCF fracture mechanism
208
For 5% of LCF pre-damage, the fatigue pre-crack is not formed by the fatigue pre-damage,
209
however, it reduces the resistance of crack initiation by activating the slip systems. According to
210
weaken chain theory, fatigue pre-damage is a weak point, and then fatigue cracks can initiate from
211
the activating slip systems at high stress amplitude [21], as is shown in Fig. 9a, and 5% of LCF
212
pre-damge decreases fatigue properties of TC21 titanium alloy. However, the activating slip systems
213
do not result in the surface fatigue crack initiation at VHCF limit, while fatigue crack initiates from
214
the specimen subsurface at VHCF limit. The results indicates that fatigue early damage occurred at
215
sample surface rather than sample interior.
216
The pre-crack with the approximately 14.7 µm and 41.5 µm depth are introduced by 10% and
217
20% fatigue damage. According to EI Haddad fatigue small crack theory, the pre-crack is considered
218
as small cracks, and the stress intensity factor ΔK can be expressed as[22]:
219
220
a
(
0)
K
Y
σ π
a a
Δ =
+
(4)221
Where
σ
ais the stress amplitude, Y is the geometry factor for a surface crack expressed as the222
reference [3]. The size of a small defect
a
is the length of the pre-crack, and the intrinsic crack223
length
a
0is given by [23]:224
2 0
,
1
(
th)
e nK
a
Y
π
σ
Δ
=
Δ
(5)225
Where Δσe,n is the stress range at the fatigue limit of an undamaged specimen, ΔKth is the threshold
226
of fatigue crack growth. The value of ΔKth can be estimated usingΔKFGA [24], which is the threshold
227
of the stress intensity factor for FGA (Fig. 8b) and can be calculated by the following formula:
228
a
0.5
FGA FGA
K
σ π
area
Δ
=
(6)229
where and areaFGA is the area of FGA.
230
Thus, ΔKFGA is equal to 2.78 MPam1/2 based on Fig.8. The fatigue limit of TC21 alloy is about
231
430 MPa (Fig. 7), and the intrinsic crack length
a
0is about 27.56 µm, as obtained from Eq. (5). The232
stress intensity factors of 10% and 20% fatigue pre-cracks under 375MPa and 280MPa stress
233
amplitude slightly above its endure limits (Fig.7) are 3.02 MPam1/2 and 2.86MPam1/2, which are
234
higher than ΔKth. It indicated that the pre-cracks will steadily propagate.
235
The effect of fatigue pre-crack on the fatigue limit of TC21 alloy can be described using the EI
236
Haddad model. The fatigue limit for specimens with a small pre-crack is defined as follows [24]:
239
2 ,
0 1
( )
( )
th e n
K Y a+ a
σ
π
Δ
Δ = (7)
240
According to Eq. (7), the fatigue limit of TC21 alloy with 10% and 20% of LCF pre-damage is
241
about 347.3 and 261.6 MPa, respectively, which well agrees with the experimental data (Fig.13). This
242
finding suggests that fatigue pre-crack plays a significant role in the reduction of fatigue strength.
243
244
Figure 13. Kitagawa diagram of TC21 titanium alloy with LCF pre-damage
245
246
The stress state of the surface initiation crack is regarded as plane stress condition. For mode-I
247
crack, the plastic zone size rc at the crack tip under plane stress condition is [25]:
248
2
y
1
(
I)
c
K
r
π σ
Δ
=
(8)249
Thus the size of the plastic zone for pre-crack is calculated by Eq.(8). For 10% of LCF
250
pre-damage under stress amplitude 375MPa and 20% of LCF pre-damage under stress amplitude
251
350MPa, the plastic zone is 2.62um and 3.8um, which are much smaller than the size of lamellar
252
basket-weave. This suggest that fatigue early crack growth is significantly influenced by the
253
microstructure (Figs.11b, 12b), which fatigue crack is prone to grow towards the most preferred
254
direction for propagation.
255
4.2 Effect of fatigue pre-damage on fatigue life
256
The propagation of the LCF pre-crack follows Paris’ law:
257
( )m
da
C K
dN = Δ (9)
258
Fig. 14 shows that the LCF pre-crack propagation rate increases with increased stress intensity
259
factor and can be expressed as:
260
261
-13 5.066
d / da N=8.64 10 (× ΔK) (10)
264
Figure 14. Relation between the expected pre-crack propagation rate da/dN and stress intensity
265
factor ΔK
266
267
The LCF pre-crack propagation life under a low stress amplitude can be estimated as:
268
269
1 /2 1 /2
0 p
( )
[1 ( / 2)] ( )
m m
fr
m
a a
N
m C Y σ π
− − −
=
− Δ (11)
270
whereafris the size of the fatigue fracture zone. C and m can be obtained by Eq. (10).
271
The fatigue pre-crack acted as a small crack has a higher propagation rate than that of a long
272
crack with the same nominal stress intensity factor range. An intrinsic crack length
a
0is added to the273
actual length of crack a to unify the differences in the crack propagation rates between small and
274
long cracks[25]. And the crack propagation rate independent of crack size can be calculated by linear
275
elastic fracture mechanics.
276
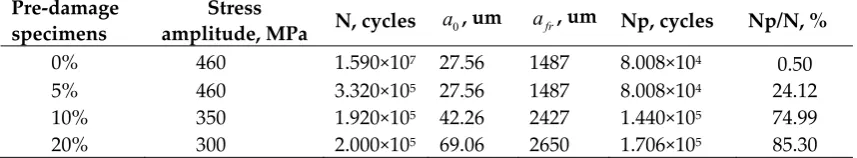
According to Eq. (11), the crack propagation life of TC21 alloy for 5%, 10% and 20% LCF of
277
pre-damage are shown in Table 1. The pre-crack propagation lives for 10% and 20% of LCF
278
pre-damage samples account for a major portion of the expected life, which also indicate that the
279
pre-crack directly propagate under subsequent stress amplitude. However, less than 1% of the
280
expected life is consumed in the crack-propagation life for TC21 alloy without pre-damage. For 5%
281
of LCF pre-damage samples, fatigue pre-crack is not observed at the crack initiation site, but more
282
than 20% of the expected life is consumed in the crack-propagation life, indicating 5% of LCF
283
pre-damage promote the initiation of fatigue crack.
284
285
Table 1 Estimation of fatigue crack-propagation life
286
Pre-damage specimens
Stress
amplitude, MPa N, cycles a0, um afr, um Np, cycles Np/N, %
0% 460 1.590×10⁷ 27.56 1487 8.008×10⁴ 0.50
5% 460 3.320×10⁵ 27.56 1487 8.008×10⁴ 24.12
10% 350 1.920×10⁵ 42.26 2427 1.440×10⁵ 74.99
20% 300 2.000×10⁵ 69.06 2650 1.706×10⁵ 85.30
5. Conclusions
287
The conclusions are summarized as follows:
288
(1)The S-N curves of pre-damaged specimens exist knee of horizontal lines for 105 ~ 109 cycles. 5%
289
of LCF pre-damage insignificantly affects the VHCF limit due to the absent of pre-crack, but
290
decreases the subsequent fatigue crack initiation life estimated by Pairs’ law. Pre-cracks introduced
291
by 10% and 20% of LCF pre-damage significantly reduce the subsequent VHCF limits, which are
292
well predicted based on EI Haddad model.
(2)The crack initiation site shifts from subsurface-induced fracture for undamaged and 5% of LCF
294
pre-damage specimens to surface pre-crack for 10% and 20% of LCF pre-damaged specimens. LCF
295
pre-crack will re-start to propagate under subsequently low stress amplitude when stress intensity
296
factor of pre-crack is larger than its threshold.
297
(3)
10% and 20% of LCF pre-damage samples account for a major portion of the expected life, while298
5% of LCF pre-damage decrease the crack initiation life of fatigue.
299
Acknowledgments: This work were supported by the National Natural Science Foundation of China (Grant
300
No.51571009, 21405013), Special funds for scientific and technological development of Guangdong (2017A0101
301
03029), Scientific and technological program of Foshan (2017AB003941),Construction project of Guangdong
302
province engineering technology research center (506302679076), Construction project of Foshan city scientific
303
research platform (2014AG10009, 2016AG100341), Talent research start-up program of Foshan
304
university(gg040940).
305
Author Contributions: Zhao Zihua and Chen Hong conceived and designed the experiments; Nie Baohua, Sun
306
Haibo and Liu shu performed the experiments; Chen Dongchu and Ouyang Yongzhong analyzed the data; Nie
307
Baohua wrote the paper.
308
Conflicts of Interest: The authors declare no conflict of interest.
309
References
310
1. Zheng, Y.C.; Zhao, Z.H.; Zhang, Z.H.; Zong, W.M.; Dong, C. Internal crack initiation characteristics and
311
early growth behaviors for very-high-cycle fatigue of a titanium alloy electron beam welded joints. Mat.
312
Sci. Eng. A 2017, 706, 311-318.
313
2. Deng, H.; Li, W.; Sakai, T.; Sun, Z. Very high cycle fatigue failure analysis and life prediction of Cr-Ni-W
314
gear steel based on crack initiation and growth behaviors. Materials 2015, 8, 8338–8354.
315
3. Nie, B.; Zhang, Z.; Zhao, Z.; Zhong, Q. Very high cycle fatigue behavior of shot-peened 3Cr13 high
316
strength spring steel. Mater. Design 2013, 50, 503-508.
317
4. Zuo, J.H.; Wang, Z.G.; Han, E.H. Effect of microstructure on ultra-high cycle fatigue behavior of
318
Ti–6Al–4V Materials. Mat. Sci. Eng. A 2008, 473, 147-152.
319
5. Andre, P.; Samuel, F. Effects of inclusions on the very high cycle fatigue behaviour of steels. Fatigue Fract.
320
Eng. Mater. Struct. 2017, 40, 1694-1707.
321
6. Stanzl-Tschegg, S. E. Fracture mechanical characterization of the initiation and growth of interior fatigue
322
cracks. Fatigue Fract. Eng. Mater. Struct.2017, 40, 1741-1751.
323
7. Crupi, V.; Epasto, G.; Guglielmino, E.; Squillace, A. Influence of microstructure [alpha + beta and beta] on
324
very high cycle fatigue behaviour of Ti-6Al-4V alloy. Int. J. Fatigue 2017, 95, 64-75.
325
8. LeBiavant, K.; Pommier, S.; Prioul, C. Local texture and fatigue crack initiaton in a Ti-6Al-4V. Fatigue Fract.
326
Eng. Mater. Struct. 2002, 25, 527-45.
327
9. Sinha, V.; Spowart, J.E.; Mills, M.J.; Williams, J.C. Observations on the faceted initiation site in the
328
dwell-fatigue tested ti-6242 alloy: Crystallographic orientation and size effects. Metall Mater. Trans. A 2006,
329
37, 1507-18.
330
10. Ravi Chandran, K.S.; Jha, S.K. Duality of the S–N fatigue curve caused by competing failure modes in a
331
titanium alloy and the role of Poisson defect statistics. Acta Mater.2005, 53, 1867-81.
332
11. Liu, X.; Sun, C.; Hong, Y. Faceted crack initiation characteristics for high-cycle and very-high-cycle fatigue
333
of a titanium alloy under different stress ratios. Int. J. Fatigue 2016, 92, 434-441.
334
12. Nikitin, A.; Palin-Luc, T.; Shanyavskiy, A. Crack initiation in VHCF regime on forged titanium alloy under
335
tensile and torsion loading modes. Int. J. Fatigue 2016, 93, 318-325.
336
13. Huang, Z.Y.; Wanger, D.; Bathias, C.; Chaboche, J.L. Cumulative fatigue damage in low cycle fatigue and
337
gigacycle fatigue for low carbon-manganese steel. Int. J. Fatigue 2011, 33, 115-123.
338
14. Mayer, H.; Haydn, W.; Schuller, R.; Issler, S.; Bacher-Höchst, M. Very high cycle fatigue properties of
339
bainitic high carbon–chromium steel under variable amplitude conditions. Int. J. Fatigue 2009, 31,
340
1300-1308.
341
15. Bathias, C. Piezoelectric fatigue testing machines and devices. Int. J. Fatigue 2006, 28, 1438–45.
342
16. Lin, X.B.; Smit, R.A. Finite element modelling of fatigue crack growth of surface cracked plates. Part II:
343
Crack shape change. Eng. Fract. Mech.1999, 63, 523-540.
17. Morrissey, R.J.; McDowell, D.L.; Nicholas, T. Frequency and stress ratio effects in high cycle fatigue of
345
Ti-6Al-4V. Int. J. Fatigue 1999, 21: 679-685.
346
18. Moshier, M.A.; Nicholas, T.; Hillberry, B.M. Load history effects on fatigue crack growth threshold for
347
Ti-6Al-4V and Ti-17 titanium alloys. Int. J. Fatigue 2001, 23, 253-S258.
348
19. Hui, W.J.; Zhang, Y.J.; Zhao, X.L.;Hang, D.Very high cycle fatigue properties of Cr-Mo low alloy steel
349
containing V-rich MC type carbides. Mat. Sci. Eng. A2016, 651, 311-320.
350
20. Zhao, P.; Cheng, C.; Gao, G.; Hui, W.; Misra, R.DK.; Bai, B.; Weng, Y. The potential significance of
351
microalloying with niobium in governing very high cycle fatigue behavior of bainite/martensite
352
multiphase steels. Mat. Sci. Eng. A 2016, 650, 438-444.
353
21. Lanning, D.; Haritos, G.K.; Nicholas, T.; Maxwell, D.C. Low-cycle fatigue/ high-cycle fatigue interactions
354
in notched Ti-6Al-4V. Fatigue Fract. Engng. Mater. Struct. 2001, 24, 565-578.
355
22. Peter, J.O.; Ritchie, R.O. Influence of foreign-object damage on crack initiation and early crack growth
356
during high-cycle fatigue of Ti-6Al-4V. Eng. Fract. Mech. 2000, 67, 193-207.
357
23. Liu, Y.; Mahadevan,S. Probabilistic fatigue life prediction using an equivalent initial flaw size distribution.
358
Int. J. Fatigue 2009, 31, 476–487.
359
24. Shiozawa, K.; Lu, L. Very high-cycle fatigue behavior of shot-peened high-carbon-chromium bearing steel.
360
Fatigue Fract. Engng. Mater. Struct.2002, 25, 813-822.
361
25. Suresh, S. Fatigue of Materials, 2nd ed.; Cambridge University Press: Cambridge, UK, 1998; pp. 388–392.
![Figure 2. The schematic diagram of ultrasonic fatigue test system [15].](https://thumb-us.123doks.com/thumbv2/123dok_us/7902031.1311806/3.595.193.393.422.496/figure-schematic-diagram-ultrasonic-fatigue-test.webp)