Belle2Lab - An Interactive Tool for a Public Analysis of the
Belle II Data
RokPestotnik1,∗
1Jožef Stefan Institute, Ljubljana, Slovenia
Abstract.Several data samples from a Belle II experiment will be available to the public as a part of the experiment outreach activities. A Belle2Lab tool is de-signed as an interactive graphical user interface to reconstructed particles, off
er-ing users basic particle selection tools. The tool is based on a Blockly JavaScript graphical code generator and can be run in an HTML5 capable browser. It al-lows a description of different particle decays by selecting and combining
par-ticles from the data file, easy histogramming tools and a display of the results by using the JSROOT library. During the analysis, the user has the possibility to apply cuts to the selected variables. A pseudo-code generated by the user interface is sent to the execution server which returns the histograms, that can also be interactively fitted. The Belle2Lab is accessible in two ways: hosted on a single public web server or as a part of the virtual appliance which consists of an Ubuntu 16.04 LTS operating system, a data sample, an analysis framework, and a private web server. The public web server can be used for a single access while the virtual appliance is more suited for a use in a classroom.
1 Introduction
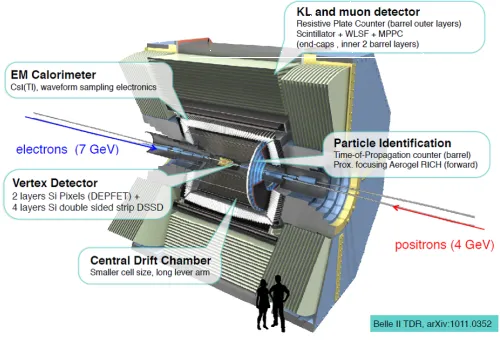
The Belle II experiment is dedicated to studying rare decays of B and D mesons andτleptons coming from collisions in thee+e−SuperKEKB collider [1, 2]. By collecting 50 times larger data sample than its predecessor Belle [3], the experiment will allow measuring deviations from the Standard Model of elementary particles. Decay data are recorded by a Belle II de-tector surrounding the interaction point (Fig.1). The acquired data are processed by a large amount of simulation, reconstruction, and visualization modules, collected in a Belle II analy-sis software framework - BASF2 [4]. The selection of modules, their configuration and order of execution is defined via a Python interface.
As a part of the experiment outreach activities, several reconstructed data samples will be disclosed to the public. Although the analysis framework is user-friendly, it still re-quires the user to be familiar with a Python programming language. Every syntax error in the script slows and stops the analysis and requires debugging of the code. Not skilled users are very fast demotivated since their attention is diverted from the physics of the analyzed process. The interface to the public data should, therefore, be simple, but it should still be configurable by the users in order to attract them. For example, interfacing the data with a simple web form does not offer the user involvement in the analysis process. To minimize a gap due to missing programming skills we created a demonstration and educational applica-tion called Belle2Lab designed for high school and undergraduate students.
∗e-mail: [email protected]
EPJ Web of Conferences 214, 06009 (2019) https://doi.org/10.1051/epjconf/201921406009
Figure 1.Belle II spectrometer is used to record particles around the interaction point of SuperKEKB colider.
2 Belle2Lab Design
The purpose of the application is to present the research methods we use and to show how a physics analysis is done by offering several spectroscopy examples. The Belle2Lab offers the students to discover “new” particles by combining already reconstructed ones. The collab-oration provides enough data to discover the most frequent particles, but it does not contain rare processes. The application is user-friendly since it uses a graphical user interface in which the user interactively chooses and connects building blocks to control the analysis and to describe the physics process.
It is separated in two parts. The description part with the graphical user interface runs in an HTML5 capable browser (web client), which communicates with the execution part (web server), where the analysis is run. At the end of the execution the results, histograms of different properties of the particles in the decay, are sent back to the client. By separating the description and the execution processes, the application can be used in two configurations: either in a single web server or with the web server and the client packaged together with the data in a single virtual appliance.
3 Implementation
The Belle2Lab is based on a Blockly JavaScript graphical code generator [5] inspired by MIT Scratch [6]. The default user interface of the Belle2Lab consists of a toolbox which holds available blocks, and a workspace where the user can drag and rearrange blocks. The workspace includes zoom icons and a trashcan for deleting blocks. Users can create se-quences of blocks and link them by plugging a block output to a block input. The types of connections can be restricted, so that only specific types of output connectors can be plugged in the input ones.
The client running in an HTML5 capable browser generates a JSON string describing the decay (Fig. 2). The string is sent via HTTP request to an execution Apache HTTP server where it is converted in a ROOT script [7], later executed by ROOT. The process initializes the histograms, opens a ROOT data file with a TTree particle list, loops over the events,
{{"analysis":{“neve":"50000","first":"0","print":"0","datasource":"2", “list”:{"combiner":{"list1":{"selector":{"list1":"","charge":"-1", “pid”:"PION","histogram":{"h1d":{"varname":"GetMass","name":"pion Mass", “nbins”:"100","min":"0","max":"1"}} }} ,"list2":{"selector":{"list1":"", “charge”:"1","pid":"PION","histogram":""}} ,"sameparticles":"0",
“pid”:"KAON","m0":"0","m1":"1","histogram":{"h1d":{"varname":"GetMass", “name”:"pipi Mass;GeV/c;N","nbins":"400","min":"0","max":"1"}} }} }}
Figure 2.An example JSON string created by the application.
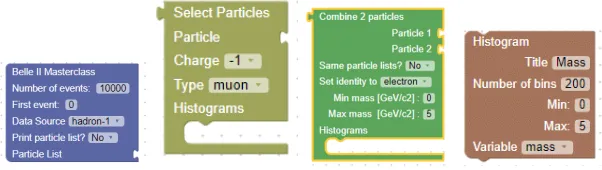
Figure 3.Basic building blocks of the application.
combines the particles and fills the histograms. The histograms are converted at the end of execution to JSON strings and returned back to the web client where they are displayed by JSROOT JavaScript library [8].
3.1 Decay description
In the toolbox there are four types of blocks, that can be used to describe the decay (Fig. 3): the main block to control the event loop, the particle selection block, the particle combiner block and the histogramming block.
The main block Belle II MasterClass allows to select the data source, set the number and starting event number and a flag to print a particle list. In the initial phase of Belle II operation two sets of data from Belle experiment [3] with a total of about 6 mio. of particle decays are available to play with. By selecting the print particle list flag, one can get a list of particles, their momentum, energy and identity in the first 100 events.
The histogram block allows plotting distribution of a selected variable (e.g. en-ergy/momentum/identity) of the particles in the list in a one-dimensional histogram. The user can define a number of bins, a minimum and maximum bin, a histogram title, and a variable to plot.
The particle selection block allows creating a particle list by selecting a charge and parti-cle type. It has two inputs: the input partiparti-cle list, which can be the partiparti-cle list stored in the data file or any other list created during the analysis, and a histogram input where a list of histograms can be appended.
The particle combiner combines two particle lists, considering also cases when both lists are the same. A new particle list is created by applying a mass cut on the invariant mass of the combined particle. The particle combiner allows appending the histogram list to monitor the combination process.
EPJ Web of Conferences 214, 06009 (2019) https://doi.org/10.1051/epjconf/201921406009
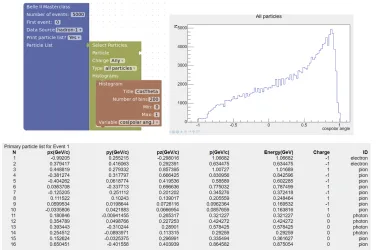
Figure 4. A simple process to explore particle distributions: the process description(upper left), the resulting histogram (upper right) and the particle list (below).
3.2 Analysis execution
After the decay description, the data can be processed by clicking on the Analyze button (Fig. 5). A pseudo-code is generated by the user interface and sent to the execution server which processes the data and returns the histograms at the end.
In the simplest case, an iteration through the data particle list allows to explore distri-butions of different particles and to print particle list (Fig. 4). This step is very important from an educational perspective as it allows to follow the combination process and to see the properties of the reconstructed particles in the list.
Two body decays can be described by including a particle combiner (Fig. 5). In the example, a decay of a neutral pionπ0 to twoγ’s is shown. The returned histogram can be interactively fitted by a user-defined function described in a fit panel.
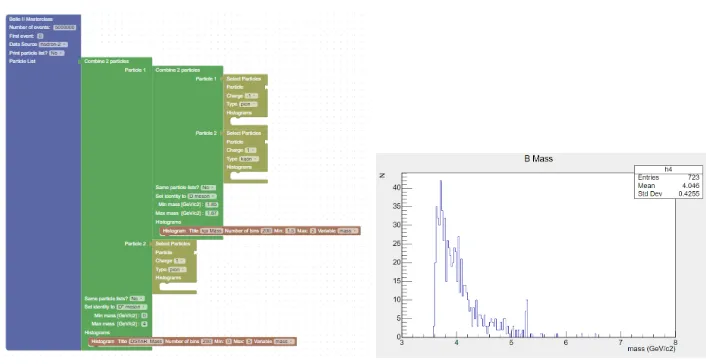
By combining three particles, more complex decays can be studied, for example a decay ofB+ → J/ψK+, followed by a decay ofJ/ψ→µ+µ−(Fig. 6). In this way one can recon-struct different particle decays. The data sample contains enough data to reconrecon-structπ0,Ks, φ,J/ψ,D0,D∗±andB±particles.
3.3 Belle2Lab usage
Figure 4. A simple process to explore particle distributions: the process description(upper left), the resulting histogram (upper right) and the particle list (below).
3.2 Analysis execution
After the decay description, the data can be processed by clicking on the Analyze button (Fig. 5). A pseudo-code is generated by the user interface and sent to the execution server which processes the data and returns the histograms at the end.
In the simplest case, an iteration through the data particle list allows to explore distri-butions of different particles and to print particle list (Fig. 4). This step is very important from an educational perspective as it allows to follow the combination process and to see the properties of the reconstructed particles in the list.
Two body decays can be described by including a particle combiner (Fig. 5). In the example, a decay of a neutral pionπ0 to twoγ’s is shown. The returned histogram can be interactively fitted by a user-defined function described in a fit panel.
By combining three particles, more complex decays can be studied, for example a decay ofB+ → J/ψK+, followed by a decay ofJ/ψ→ µ+µ−(Fig. 6). In this way one can recon-struct different particle decays. The data sample contains enough data to reconrecon-structπ0,Ks, φ,J/ψ,D0,D∗±andB±particles.
3.3 Belle2Lab usage
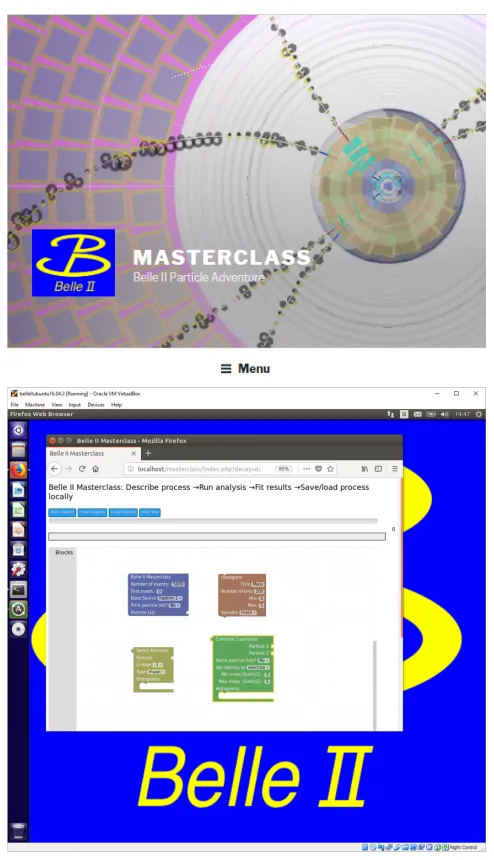
The Belle2Lab is accessible in two ways: hosted on a single public web server (accessible at http://belle2.ijs.si/public) or as a part of the VirtualBox virtual appliance [9], which consists of an Ubuntu 16.04 LTS operating system, a data sample, an analysis framework and a private web server (Fig. 7). The former can be used for single access while the latter is more suited for workshops.
Figure 5.An Example of a decay to two particles.
Figure 6.An Example of a decay to three particles.
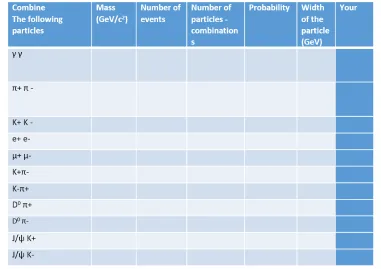
The application will be used as a part of the educational web page with an introduction to the physics of Belle II. We will design a list of exercises which the user will have to perform. As an example, the user will get a table of decay products (Fig. 8). His task will be to find a mother particle and find its properties and to fill in the missing information in the table.
4 Conclusions
The application called Belle2Lab offers users basic particle selection tools. It allows the description of different particle decays by selecting and combining particles from the data file, easy histogramming tools and display of the results by using the JSROOT library.
EPJ Web of Conferences 214, 06009 (2019) https://doi.org/10.1051/epjconf/201921406009
Figure 7. Internet version of the Belle2Lab with an introduction (above) and the virtual appliance (below).
The Belle2Lab application offers the user an easy and intuitive tool for the description of the physics decay processes and analysis of the Belle II data sample, which will be made available for public.
By plotting the invariant mass of the combination of particles, “new” particles can be discovered by peaks in the distribution. The resulting histograms, displayed in a web browser can be interactively fitted with a user-defined function. The tool is accessible on the internet. However, due to processing limits on the single server, a virtual appliance was created which can be distributed to many computers and used during a workshop. The results of the tasks (e.g. particle identity, width and the position of the peak) can be compared by the workshop
Figure 8.Belle2Lab worksheet with processes to explore.
students or between different groups taking part in a multi-site analysis event. Based on the experiences of using the application during several summer schools, we plan to employ the Belle2Lab application as a part of Belle II contribution in the International Masterclasses [10].
References
[1] T.Abe et al., Belle II Technical design report, arXiv:1011.0352 [physics.ins-det] (2010) [2] Belle II experiment, Retrieved from http://www.belle2.org on 1 December 2018 [3] A. Abashian et al., Nucl. Inst. and Meth. in Phys. Res. A479, 117–232 (2002) [4] T. Kuhr et al., Comput Softw Big Sci3, 1 (2019)
[5] Google Blockly, Retrieved from https://developers.google.com/blockly/on 1 December 2018
[6] MIT Scratch, Retrieved from https://scratch.mit.edu/on 1 December 2018
[7] R. Brun and F. Rademakers, Nucl. Inst. and Meth. in Phys. Res. A389, 81-86 (1997); See also http://root.cern.ch/
[8] B. Bellenot and S. Linev, J. Phys. Conf. Ser.664, 062033 (2015)
[9] VirtualBox, Retrieved from https://www.virtualbox.org/on 1 December 2018
[10] International Particle Physics Outreach Group, International Masterclasses, Retrieved from http://physicsmasterclasses.org/on 1 December 2018
EPJ Web of Conferences 214, 06009 (2019) https://doi.org/10.1051/epjconf/201921406009