Lambda polarization feasibility study at BM@N
DilynaSuvarieva1,2,,KonstantinGudima3,, andAlexanderZinchenko1,
1Joint Institute for Nuclear Research, Dubna, Moscow region, Russia 2Plovdiv University "Paisii Hilendarski", Plovdiv, Bulgaria
3IAP AS, Chisinau, Moldova
Abstract. Heavy strange objects (hyperons) could provide essential signatures of the excited and compressed baryonic matter. At NICA, it is planned to study hyperons both in the collider mode (MPD detector) and the fixed-target one (BM@N setup).
Measurements of strange hyperons polarization could give additional information on the strong interaction mechanisms. In heavy-ion collisions, such measurements are even more valuable since the polarization is expected to be sensitive to characteristics of the QCD medium (vorticity, hydrodynamic helicity) and to QCD anomalous transport. In this analysis, the possibility to measure at BM@N the polarization of the lightest strange hyperonΛis studied in Monte Carlo event samples produced with the DCM-QGSM generator. It is shown that the detector will allow to measureΛpolarization with a precision required to check the model predictions.
1 Introduction
The parity-preserving polarization of strange hyperons in hadronic interactions is transverse to scat-tering plane. It is large and sensitive to the strong interactions mechanisms. In the heavy-ion collisions this polarization can be diluted due to rescattering in the QCD medium, while the polarization trans-verse to reaction plane may emerge. It is sensitive to parity-odd characteristics of QCD medium (vorticity, hydrodynamic helicity) and to QCD anomalous transport.
In this analysis, the polarization of the lightest strange hyperonΛ, is studied. Its decay Λ → p+π−is fully reconstructible and the polarization can be extracted from the angular distribution of the final state particles. The polarization is measured with respect to the production plane of theΛ hyperon:n=pˆbeam×p, where ˆpbeamis aligned with the direction of the incoming beam andpis the
Λmomentum.
In theΛrest frame, the angleθbetween the decay proton and the analyzing direction ˆnwill follow the probability distribution:
w(cosθ)=1
2(1+αPcosθ), (1)
whereα =0.642 is the decay asymmetry of the parity violating weak decayΛ → p+π−and P is polarization in the direction of ˆn.
2 BM@N detector
A successful operation of the NICA complex [1] will require the existing machine Nuclotron to be upgraded in order to accelerate Au nuclei. After that, the improved Nuclotron beams will also be used to run a fixed target experiment BM@N [2].
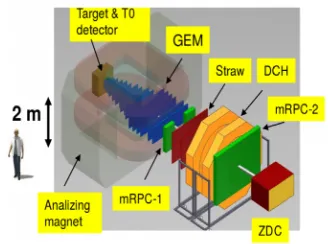
Figure 1.BM@N detector The detector will allow to studyA+Acollisions by
measuring a variety of observables. Particle yields, ra-tios, transverse momentum spectra, rapidity and angular distributions, as well as fluctuations and correlations of hadrons will be studied as a function of the collision en-ergy and centrality.
A sketch of the proposed experimental setup is shown in figure 1. It combines high precision track measurements with time-of-flight information for par-ticle identification and total energy measurements for event characterization. The charged track momenta and multiplicity will be measured with the set of GEM (Gas Electron Multipliers) detectors located downstream of the target inside the analyzing magnet of 0.8 T and drift chambers (Straw, DCH) situated outside the magnetic field. Design parameters of the time-of-flight detectors
based on multigap Resistive Plate Chambers (mRPC-1, -2) with a strip read-out allow efficient dis-crimination between particle species with momentum up to a few GeV/c. The Zero Degree Calorime-ter (ZDC) is designed for the collision centrality analysis by measuring the energy of forward going particles.
3 Analysis method
3.1 Signal extraction
The topology ofΛhyperon decays is shown in figure 2. The event topology (decay of a relatively long-lived particle into two particles) defines the selection criteria: relatively large distance of the closest approach (DCA) to the primary vertex of decay products, small track-to-track separation in the decay vertex, relatively large decay length of the mother particle. For higher efficiency, both the DCAand two-track separation cuts were applied inχ2- space, i.e normalized to their respective errors.
The exact values of selection cuts were found by performing a multidimensional scan over the whole set of selection criteria with a requirement to maximize the invariant mass peak significance, defined asS/√S +B, where S and B are total numbers of signal (described by the gaussian) and background (polynomial function) combinations inside±2σinterval around the peak position. While different physics analyses might prefer different selection quality criteria, the significance looks con-venient to quantitatively evaluate effect of different factors on the reconstruction quality.
The corresponding scan procedure was realized as follows: during the particle combinations the parameters which have been chosen to serve as selection criteria (see above) were recorded along with the invariant mass value. Later, multiple loops over those variables were performed in some steps and their values were used as low or high thresholds, yielding the invariant mass peak significance for each set of selection cut values. Then, the maximum value was taken along with the corresponding set of selection parameters.
outside of the peak region of theΛinvariant mass distribution (in sidebands - figure 2) dominated by the backgroundpπ−combinations from the one in the peak region (dominated by signal combinations) according to the the following formula:
cosθS = (S +B)
S cosθS+B− B
S cosθB, (2)
where S is a signal, B is a background, cosθS+Bis the distribution for the signal peak region and cosθB for the sidebands (figure 3 left).
Figure 2.Left - event topology of a neutral particle two-prong decay; right - reconstructedpπ−invariant mass distribution and sidebands used for background subtraction (hatched areas).
3.2 Polarization extraction
As it can be seen in figure 3 (filled circles on the right), the reconstructed cosθ-distribution can not be directly described by the expression (1) due to detector acceptance effects which distort the original linear dependence. In order to correct for detector effects, one can try to apply a simple approach based on the Monte Carlo simulation of the detector acceptance using events without the effect under study, i.e. with zero lambda polarization. The “unpolarized” cosθ-distribution is shown in figure 3 (empty circles). Dividing the “polarized” distribution by the “unpolarized” one it is possible to observe the net effect due to polarization (figure 5).
4 Results
The study was done for 500 thousand centralAu+Au collisions (0-3.8 fm) with the beam kinetic energyT0=4.5 GeV/nucleon (
√
s=3.5A GeV). The event sample was created with the DCM-QGSM (Dubna Cascade Model - Quark-Gluon String Model) [3–7] event generator. Lambda polarization was calculated according to the model in [8], taking into account hyperon rescattering in the nuclear medium. The event generator output was used to produce two event samples: with and without polarization effects activated by switching on and offlambda anisotropical decay according to (1) during the particle transport with the GEANT3 package.
Figure 3.Left - cosθ-distributions forpπ−combinations from the peak region of the invariant mass distribution (blue line - S+B), from the sidebands (circles - B) and background subtracted one (black line - S); right - back-ground subtracted cosθ-distributions with (filled circles) and without (empty circles) polarization effects taken into account.
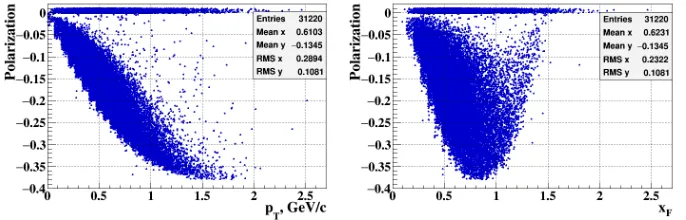
Figure 4.Left - lambda polarization vspT; right - vsxF.
The extracted polarization value in the full phase space covered by the detector can be seen in figure 5 (left) as the slope parameter of the fitted straight line. For comparison, on the right plot of figure 5 one can see the true polarization distribution obtained for selected lambda-hyperons. There is a good agreement between the measured value (-0.1456) and the mean value of the true distribution (-0.1378).
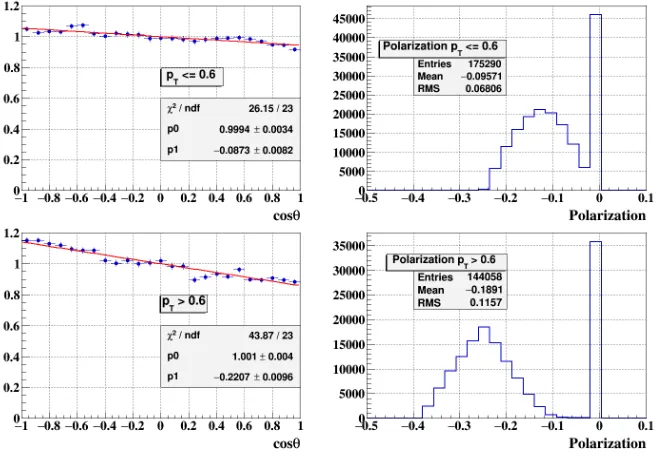
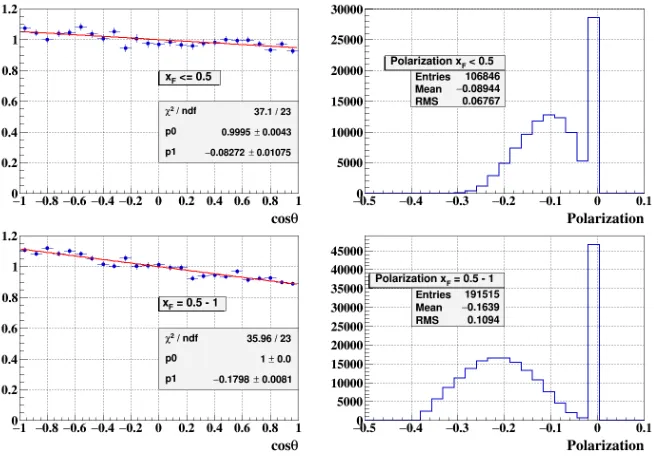
In order to check the sensitivity of the method in different regions of the phase space, two intervals ofpT (pT <0.6 and pT ≥0.6 GeV/c) andxF (xF <0.5 andxF =0.5−1.0) were chosen. One can see from figures 6 and 7 that for these intervals the measured and true polarization values are close to each other as well.
5 Conclusions
The analysis method and procedure for lambda polarization study have been developed and tested on simulated centralAu+Auevents at T0=4.5A GeV in BM@N detector. The obtained results demon-strate quite good sensitivity of the detector to polarization variables. However, secondary lambda hyperons should be taken into account when interpreting the results.
Figure 5.Left) reconstructed cosθ-distribution corrected for detector acceptance fitted to the straight line; right) true lambda polarization distribution for reconstructed events. Zero polarization corresponds to secondary lamb-das.
Figure 6.The same as in figure 5 for samples withpT <0.6 andpT≥0.6 GeV/c.
The extension of the method to some other polarization studies (polarization transverse to reaction plane) will be evaluated.
Acknowledgements
Figure 7.Left) reconstructed cosθ-distribution corrected for detector acceptance fitted to the straight line; right) true lambda polarization distribution for reconstructed events. Upper low - event sample withxF <0.5, lower row - withxF =0.5−1.0.
References
[1] http://nica.jinr.ru
[2] http://nica.jinr.ru/files/BM@N/BMN\_CDR.pdf
[3] V.D. Toneev and K.K. Gudima, Nucl. Phys. A400, 173 (1983)
[4] N.S. Amelin, K.K. Gudima, and V.D. Toneev, Sov. Journ. of Nuclear Phys.51, 1730 (1990) [5] N.S. Amelin et al., Phys. Rev. C47, 2299 (1993)
[6] K.K. Gudima, S.G. Mashnik, and A.J. Sierk, LANL Report LA-UR01-6804 (2001). https://mcnp. lanl.gov/